Climate mitigation potential of cover crops in the United States is regionally concentrated and lower than previous estimates
Abstract
Widespread adoption of regenerative agriculture practices is an integral part of the US plan to achieve net-zero greenhouse gas emissions by 2050. National incentives have particularly increased for the adoption of cover crops (CCs), which have presumably large carbon (C) sequestration potential. However, assessments of national CC climate benefits have not fully considered regional variability, changing C sequestration rates over time, and potential N2O trade-offs. Using the DayCent soil biogeochemical model and current national survey data, we estimate CC climate change mitigation potential to be 39.0 ± 24.1 Mt CO2e year−1, which is 45%–65% lower than previous estimates, with large uncertainty attributed to N2O impacts. Three-fourths of this climate change mitigation potential is concentrated in the North Central, Southern Great Plains and Lower Mississippi regions. Public investment should be focused in these regions to maximize CC climate benefits, but the national contribution of CC to emissions targets may be lower than previously anticipated.
1 INTRODUCTION
Increasingly ambitious reductions in greenhouse gas (GHG) emissions will be required to achieve the 1.5°C temperature goal outlined in the Paris Agreement (Rockström et al., 2017). The most recent US GHG emissions targets reflect this urgency, with a goal of 50% reduction by 2030 and net-zero economy-wide emissions by 2050 (United States of America, 2021; USDA, 2022). This goal must be achieved by rapid and aggressive reductions in fossil fuel use. However, some emissions reductions scenarios may also rely upon carbon dioxide removal (CDR) via improved management of agricultural soils to increase the soil C sink and offset harder to abate GHG emissions sources (e.g., soil nitrous oxide, N2O, and from cropland management). Previous estimates of CDR and GHG emissions reductions potential in natural and managed lands in the United States is upward of 505 Mt CO2e year−1 (Bossio et al., 2020; Fargione et al., 2018; Griscom et al., 2017).
Widespread adoption of cover crops (CCs) could make up 20% of the climate change mitigation potential on agricultural lands because of their relatively large C sequestration potential and high adoptability (Daryanto et al., 2018; Fargione et al., 2018; Kaye & Quemada, 2017). However, national estimates of CC mitigation vary widely, ranging from 65 to 103 Mt CO2e year−1 and tend to rely on simplified calculations that multiply published C sequestration rates or emissions factors by US agricultural land area (Fargione et al., 2018; Roe et al., 2021; Sperow et al., 2003). In practice, C sequestration rates due to CC are highly variable and depend on site-specific factors such as soil type, growing degree days, tillage regime, CC frequency, and CC biomass production, which are heterogenous across farms and regions (Abdalla et al., 2019; McClelland, Paustian, & Schipanski, 2021; Poeplau & Don, 2015; Vicente-Vicente et al., 2016). Accounting for variability in time and space can both improve the confidence surrounding previous estimates and inform where to prioritize CC incentives to maximize public climate benefits.
Furthermore, recent studies highlight the important role of N2O emissions in evaluating GHG benefits of improved agricultural management (Guenet et al., 2021; IPCC, 2014; Lal, 2016). Nitrous oxide is a potent GHG which can, in some cases, completely negate the GHG benefits achieved from C sequestration, particularly on longer time scales when C sequestration benefits are reduced (Lugato et al., 2018; Quemada et al., 2020). Many management and site factors affect the magnitude and direction of N2O impacts, including the C:N ratio of CC biomass, precipitation patterns, N fertilizer adjustments, and CC termination methods (Basche et al., 2014; Han et al., 2017). These factors and the dynamic nature of processes influencing N2O emissions contribute to large variability of N2O impacts across sites. Understanding CC impacts on N2O is therefore critical for quantifying overall potential mitigation benefits.
Here we improve upon national estimates of the potential for CC adoption to mitigate GHG emissions by considering fine-scale spatial and temporal variability of C sequestration and direct N2O emissions. We estimated impacts by Conservation Effects Assessment Project (CEAP) region in the United States to understand where adoption of CC can have greater relative contributions to GHG mitigation (USDA-NRCS, 2018). We compared a high (80%) CC adoption scenario with the most current CC adoption rates in each region (USDA-NASS, 2017) and projected the 20-year net GHG flux for each scenario. The DayCent biogeochemical model was used on 132,319 survey locations included in the National Resources Inventory (NRI), a program that monitors land use in the United States and cumulatively represent 94.1 Mha of cropland in the country, or 70% of total US cropland. These locations are also associated with the most accurate and current cropping practice datasets used in the national GHG inventory, ensuring that our analysis reflects a more realistic estimate of US cropland eligible for CC adoption than in previous assessments. To quantify uncertainty and adjust for model bias, we performed a Bayesian Monte Carlo approach adapted from Ogle et al. (2010) using empirical SOC stocks and N2O flux measured in long-term experiments.
2 MATERIALS AND METHODS
2.1 The DayCent model
The study was conducted using the DayCent model, a terrestrial ecosystem model which simulates C and N fluxes among the atmosphere, vegetation, and soil using a daily time step and to a depth of 30 cm in the soil profile (Del Grosso et al., 2001; Parton et al., 1998). The model partitions soil organic C (SOC) into pools with different decay rates (active, slow, and passive), and SOC pool size is influenced by both quantity and quality of above- and belowground plant inputs (Parton et al., 1998). The N sub-model is affected by decomposition rates of soil organic matter pools and also accounts for fertilizer applications. The model was calibrated with Bayesian methods and observations from long-term experiments and is widely used in agroecosystems (Gurung et al., 2020). Comparisons with field data show that simulated net primary production, SOC stocks, and N2O fluxes agree reasonably well with observed data at both the site and regional scales (Del Grosso et al., 2005; Yang et al., 2021).
DayCent is well-suited for projections of CC adoption since it considers characteristics that may vary among CC species, including biomass quality and quantity, growth periods, and potential N fixation. Our modeling approach takes advantage of recent work by McClelland, Paustian, Williams, et al. (2021) that improved DayCent's ability to predict CC biomass quality and quantity with parameterization for a range of CC species, including cereal rye, clover, sunn hemp, and vetch.
2.2 Point selection and model inputs
Simulations were based on the NRI survey, which was initiated in 1979 by the Natural Resources Conservation Service (NRCS) in the US Department of Agriculture to collect information on soil properties and land management annually throughout the United States (USDA-NRCS, 2016). The survey includes a stratified two-stage random sample design encompassing 349,464 agricultural locations (USDA-NRCS, 2016). Each location has a weight based on the survey design that is used to estimate the total cropland area that the survey location represents. We excluded NRI locations with the production of sugarcane and less-common horticultural crops. We also excluded survey locations which did not have a winter fallow period that could be planted with winter CC (i.e., grasslands, perennial cropping systems, and continuous winter grain systems). The remaining 132,319 NRI locations included in our study represent rotations with alfalfa hay, barley, corn, cotton, grass hay, grass-clover hay, oats, peanuts, potatoes, rice, sorghum, soybeans, sugar beets, sunflowers, tobacco, and spring wheat production, which constitutes approximately 94.1 Mha, or 70% of total national cropland (US-EPA, 2022).
Model inputs included daily weather data, soil data, and detailed management information, such as crop type, cultivation and planting schedules, and amount of N inputs from synthetic fertilizers and organic amendments to soils. Daily weather data from 1979 to 2015, including daily maximum and minimum temperatures and precipitation, were sourced from the 4-km gridded PRISM climate dataset (PRISM Climate Group, 2018) and the Soil Survey Geographic Database (SSURGO) was used to characterize soil properties, including soil texture, depth, and pH, at each survey location (Soil Survey Staff, 2019).
Cover crop adoption was imputed for NRI survey locations using a hot deck method (Andridge & Little, 2010). Winter CC adoption was assumed to be negligible before 1990 and increase at a linear rate until reaching regional adoption rates captured in the 2000–2005 CEAP survey data (USDA-NRCS, 2018). After 2005, winter CC are randomly assigned or removed to match adoption rates reported in the 2012 and 2017 USDA Census of Agriculture (USDA-NASS, 2012, 2017).
While crop histories were sourced from NRI survey data, organic and synthetic fertilization, tillage practices, irrigation management, and CC management were imputed for each NRI survey location using statistical methods employed in the US National GHG Inventory (US-EPA, 2022; Table S1). Nitrogen management imputations were based on data from the USDA-NRCS CEAP and other USDA surveys (Brakebill & Gronberg, 2017; USDA-ERS, 2018; USDA-NASS, 2018; USDA-NRCS, 2018). Tillage management was based on data from the Conservation Technology Information Center (CTIC) for 1980 through 2004 (CTIC, 2004), CEAP survey for 2000 through 2005 (USDA-NRCS, 2018), and USDA Agricultural Resource Management surveys for 2002 through 2015 (Claasen et al., 2018). To account for management uncertainty, six imputed management scenarios were used for model simulations. In other words, historical management data were interpolated six times for each point and the baseline and high CC adoption scenarios were modeled six times each for every NRI point. Detailed methods for the statistical imputation methods can be found in US-EPA (2022).
2.3 Cover crop adoption scenarios and model simulation
Two CC adoption scenarios were simulated, including a baseline adoption scenario and a high adoption scenario. In the baseline scenario, CC were only simulated at NRI locations, which implemented CC between 2010 and 2015. Our baseline adoption rates vary by CEAP region (Table S2). Survey locations with CC in the baseline were also cover cropped in the high adoption scenario, and remaining survey locations were randomly selected for CC adoption until a target 80% adoption rate was achieved in each CEAP region. The 80% adoption was chosen for the high adoption scenario since it is significantly higher than current adoption rates (5.1%; Wallander et al., 2021) and full adoption is highly unlikely as not all barriers to adoption can be overcome with policy (Piñeiro et al., 2020; Plastina et al., 2020). As the selected survey locations could include mixed cash crop systems, CC were not simulated in years that had an over-wintered cash crop (i.e., winter grain and oil seed rape) as the subsequent crop in the time series. This caused total area planted to CC in any given year (54.7 Mha) to be less than total area with CC incorporated throughout the course of the study (74 Mha).
2.4 Historical simulations
To achieve initial values for state variables in the model (i.e., SOC and mineral N), DayCent simulations prior to 2015 followed methodology and input data outlined in the US National Greenhouse Gas Inventory (US-EPA, 2022). First, steady-state organic matter stocks were achieved by simulating native ecosystems for several thousand years until the approximate date of conversion to cropland. This date, as well as crop history prior to 1979 was determined by the Major Land Resource Region (MLRA) level for each survey location (USDA-NRCS, 1997; Williams & Paustian, 2005). Generally, simulations were conducted with low input agricultural practices until 1950, and then fertilizer rates and more productive cropping varieties were introduced into the simulations during the latter part of the 20th century. (More information about the historical simulations is provided in US-EPA, 2022.)
Management practices and crop rotations from 2010 to 2015 were repeated in 6-year cycles, starting in 2016 and continuing through the end of the study period (2039). Weather data from 2008 to 2015 was repeated in 8-year cycles. The starting year of the simulation was set at 2015 and included an initial spin-up period until 2019. Adoption scenarios were implemented in the year 2020 until 2039. This time frame was adopted to remove bias for incomplete cycles of input data (weather and management) and to be consistent with the GHG guidance provided by the Intergovernmental Panel on Climate Change (IPCC, 2019).
2.5 CC type and management
Cover crop selection and planting and termination dates varied among CEAP regions, which are agricultural ecoregion classifications developed by the US Department of Agriculture (USDA-NRCS, 2018). Planting and termination dates were informed by CTIC survey data and guidelines from the Midwest Cover Crops Council (MCCC) and Sustainable Agriculture Research and Education (CTIC, 2014; MCCC, 2020; Schonbeck & Morse, 2006). Simulated CC types included crimson clover (Trifolium incarnatum L.), cereal rye (Secale cereale L.), and radish (Raphanus sativus). These CC species were selected to reflect most common CC species in the CTIC data, which shows that the majority of farmers prefer winter grains (56%–78% depending on region), except in the Western United States where the majority (58.7%) prefer legumes (CTIC, 2014). Logic determining CC type selection was based on cash crop rotation and regional frost dates (Table S3). Clover was simulated if the cash crop was harvested 6–8 weeks before the average frost date for the region and the next crop in the rotation was not a legume. If the next crop was a legume, cereal rye was simulated, except in major wheat-producing regions (Northern Great Plains, Southern Great Plains, North Central, and East Central regions), where radish was simulated instead. Cereal rye was planted if the cash crop was harvested within 6 weeks of the average frost date for the region due to winter tolerance.
Cover crop planting dates were simulated to be within 1 week after cash crop harvest and terminated with herbicides. Over-wintering CC (clover and cereal rye) were terminated 10 to 14 days before planting cash crops, and winter-kill CC (radish) were terminated in January. Fertilization rates were not adjusted for N supplied by legumes in our study, which could be further investigated in future model-based assessments.
2.6 Estimating national mitigation potential and associated uncertainty
A Monte Carlo approach adapted from Ogle et al. (2010) was used to quantify SOC stock and N2O flux uncertainty associated with management input data and error in model structure and parameters. Six imputations of management history for the NRI survey locations were used to represent uncertainty surrounding management practices, such as mineral fertilization rates, manure amendments, and tillage practices. Uncertainty in model parameters and structure was estimated using an empirical approach in which linear mixed-effect models were derived by comparing modeled soil C stocks and N2O fluxes from DayCent with empirical data from long-term experiments (Del Grosso et al., 2010; Ogle et al., 2007). The “true” SOC stocks and N2O fluxes, as represented by the measurement data, are a function of the DayCent predictions and, in the case of N2O, additional covariates, including crop type and freeze–thaw cycling, which were added to address bias in DayCent model predictions. Random effects associated with region, site, and year were also included in these models.
The Monte Carlo analysis had 1000 iterations for each CC scenario. Each iteration included a random selection of one of the six management imputations and a random selection of fixed and random parameter values for the empirical linear mixed effects model (Ogle et al., 2010). For each iteration, SOC stocks and N2O emissions were estimated for each NRI location from 2020 to 2039. NRI survey weights associated with each point were then used to scale outcomes to represent total eligible cropland included in the study, aggregated by CEAP region and at the national scale. The GHG mitigation potential of CC was quantified for each Monte Carlo iteration as the difference in net GHG flux between the high and baseline CC adoption scenarios, and included C stock changes (dSOC), N2O emissions (dN2O), and net GHG flux (calculated by adding dSOC and dN2O converted to CO2-equivalent). Positive dSOC values therefore indicate net C sequestration due to CC, positive dN2O values indicate increases in N2O flux due to CC, and positive GHG mitigation potential indicates decreases in net GHG flux due to CC. Estimates and associated uncertainties of GHG benefits due to CC are based on the mean and standard deviation among all Monte Carlo iterations.
2.7 Analysis for site-level controls on GHG mitigation potential
We also explored the influence of management, climate, and soil factors on C sequestration rates and change in N2O emissions due to CC adoption. For each survey location, we averaged the results from the Monte Carlo simulation (see previous section) to estimate the annual C sequestration rate and N2O emissions for the baseline and CC scenario. Differences in average annual dSOC and dN2O rates with and without CC were calculated for each survey location. Net GHG balance due to CC adoption was also calculated for each location and the percent per region with positive balances was determined.
The site-level dSOC and dN2O rates were statistically analyzed based on variation in soil, climate, and management factors for each site which have previously been shown to be influential in GHG mitigation due to CC, including sand content, tillage regime, annual N fertilizer rates, mean annual precipitation (MAP), potential evapotranspiration, frequency of legume CC, and average annual CC biomass C (Basche et al., 2014; McClelland, Paustian, & Schipanski, 2021). Average annual CC biomass C reflected both biomass production and the number of years that CC were incorporated into the rotation. Tillage regime was included as a continuous variable to account for changes among years and among management imputations. All years with full tillage were assigned a value of 2, reduced tillage was assigned 1 and no-till was assigned 0 and the average of all years was included in the regression. Multiple linear mixed-effect regression models were derived to analyze changes in C sequestration rates, including all individual site factors and an interaction between proportion of legume CC and average CC biomass as fixed effects. The CEAP region was included as a random effect. In addition to the regression analyses, site-level dSOC and dN2O were aggregated at the county level and mapped to visualize regional variability.
Multiple linear mixed-effect regressions were also derived to explore the relationship between site-level dN2O and dSOC rates. All site factors and the interaction between proportion of legume CC and average CC biomass were included as fixed effects as well as dSOC rate and its interaction with site factors. CEAP region was included as a random effect. In all regression analyses, dSOC and dN2O rates were log transformed after adding a constant to each value to avoid issues with negative values. The lme4 package in R statistical software was used for the regression analysis (Bates et al., 2015; R Core Team, 2021).
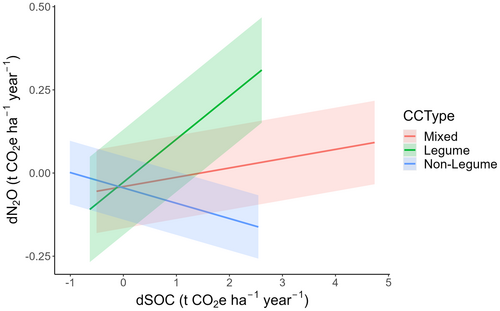
Due to large sample size, p-values and Akaike information criterion were not appropriate metrics to evaluate the regressions. Instead, inclusive R2 and standardized beta coefficients were calculated using the partR2 package in R (Stoffel et al., 2020). Factors which had inclusive R2 greater than 10% were highlighted as having substantial explanatory power on dSOC and dN2O. To visualize the interaction between proportion of legume and dSOC, CC type was defined categorically for each location as either legume (>90% legume CC), mixed (10%–90% mixed CC), or non-legume (<10% legume CC).
3 RESULTS
3.1 National CC mitigation potential
According to our analysis, adopting CC on an additional 74 Mha of cropland throughout the United States has the potential to sequester an additional 39.0 ± 24.3 Mt CO2e year−1 nationally over a 20-year study period. The majority of this GHG mitigation (36.1 ± 7.9 Mt CO2e year−1) is attributed to additional C sequestration, while 2.85 + 22.8 Mt CO2e year−1 was due to slight and highly variable estimated reductions in N2O emissions (Figure 1a).
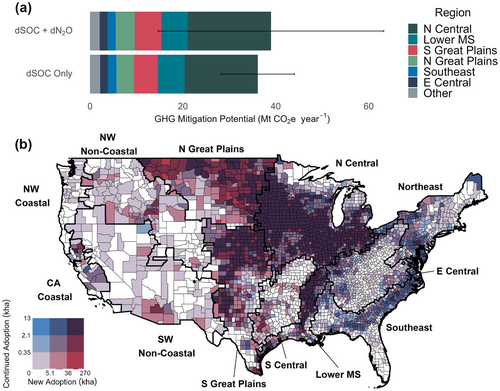
The GHG mitigation potential due to CC adoption was unevenly distributed among CEAP regions and was proportional to the area of cropland eligible in each region (Figure 1). Of the total eligible area (94.1 Mha), 79% is concentrated in mid-continental CEAP regions, including the Northern Plains, Southern Plains, and North Central; these regions therefore contribute to 71% of GHG mitigation potential (Figure 1; Table S2). Western CEAP regions (Northwest Coastal, California Coastal, Northwest Non-Coastal, and Southwest Non-Coastal) had only 2% of total cropland eligible for CC and therefore contributed relatively little to total GHG mitigation. Eastern regions, such as Lower Mississippi, Southeast, and East Central had more total eligible cropland but higher baseline adoption rates, so potential for increased adoption was lower (Figure 1). These regions made up 23% of total mitigation potential.
3.2 Regional and temporal variability in carbon sequestration rates
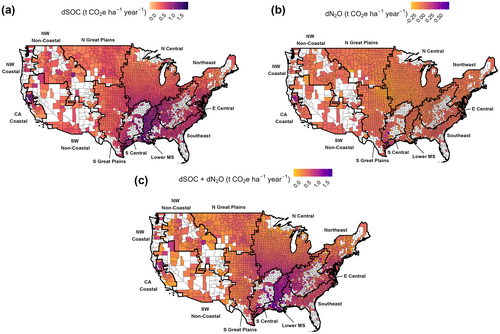
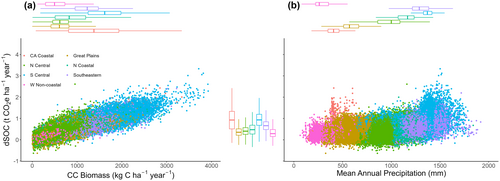
Carbon sequestration rates due to CC were highly variable across regions, with regional changes in SOC accrual averaging between 0.33 ± 0.24 and 0.99 ± 0.39 t CO2e ha−1 year−1 (Figure 2a; Table S4). Multiple linear regression indicated that C sequestration rates were primarily driven by annual CC biomass C, a metric of both CC frequency and average CC biomass C at termination, which explained 62% of variability (Table 1). Change in SOC accrual was also correlated with MAP (Figure 3; Table 1) and decreased by more than half in drier regions such as North Central, Western Non-Coastal, and the Northern and Southern Great Plains, where 81% of eligible CC area is located (Figure 1; Tables S2 and S4). Conversely, the Lower Mississippi and South Central regions were associated with higher precipitation, higher annual biomass production, and higher C sequestration rates (Figure 3; Table S4).
| Factor | dSOC | dN2O | ||
|---|---|---|---|---|
| β | Inclusive R2 | β | Inclusive R2 | |
| dSOC | NAa | NA | −.244 | .002 |
| Sand content | −.104 | .040 | .253 | .142 |
| Tillageb | −.018 | .028 | .052 | .008 |
| Average annual N fertilizer | −.024 | .012 | −.065 | .000 |
| MAP | .141 | .2727 | .208 | .002 |
| PET | −.051 | .129 | .173 | .076 |
| CC legume frequency | .044 | .035 | .093 | .123 |
| Annual CC biomass C | .798 | .6203 | −.433 | .020 |
| CC legume frequency × annual CC biomass C | −.026 | .2042 | .435 | .135 |
| dSOC × sand content | NA | NA | .079 | .133 |
| dSOC × tillage | NA | NA | .090 | .007 |
| dSOC × annual CC biomass C | NA | NA | .314 | .018 |
| dSOC × CC legume frequency | NA | NA | −.071 | .111 |
| Marginal R2 | .646 | .301 | ||
- Note: Outcomes were simulated over a 20-year study period (2020–2039). β represents the standardized coefficient and inclusive R2 represents the variability explained by the site factor independent of other factors.
- Abbreviations: CC, cover crop; dSOC, dissolved soil organic carbon; MAP, mean annual precipitation; PET, potential evapotranspiration.
- a NA, not applicable. Factor not included in analysis.
- b Tillage was included as a continuous variable to account for changes among years and among management imputations. All years with full tillage were assigned a value of 2, reduced tillage was assigned 1, and no-till was assigned 0. Average tillage across years was included in the regression.
The consideration of winter grain production in our analysis further reduced C sequestration rates. Our simulations used the most current 6-year crop rotations reported for NRI locations to account for CC compatibility with crop management. In years where winter grains were produced, CC were not included in our simulations since they are primarily used during the winter fallow period. As a result, CC adoption occurred on 50%–60% of the survey locations across years depending on region and proportion of winter grains produced annually (Table S3).
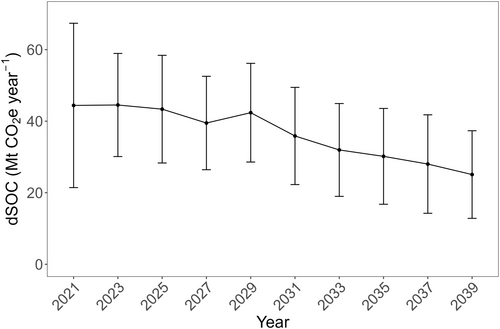
The estimated GHG mitigation potential was also limited by a decline in C sequestration benefits over time following CC adoption. Carbon accrual rates reduced by 44% over the course of the study period, starting at 44.5 ± 14.4 Mt CO2e year−1, and reaching the lowest level of 25.1 ± 12.2 Mt CO2e year−1 in the last 2 years of the study (Figure 4).
3.3 Nitrous oxide trade-offs
Simulated changes in N2O emissions did not greatly impact the magnitude of the national estimated GHG reduction potential but did increase the uncertainty surrounding the estimated mitigation potential by 40% (Figure 1a). In regression analysis, C sequestration rate had low explanatory power for change in N2O emissions (inclusive R2 = .2%; Table 1), indicating that, overall, higher C sequestration due to CC adoption was not associated with a trade-off of increased in N2O emissions. Nitrous oxide impacts were highly variable within and across regions, with average regional changes between −0.05 ± 0.11 and 0.23 ± 0.22 t CO2e ha−1 year−1 (Figure 2; Table S4). Regional differences were primarily due to simulated CC type, which were based on local CC preferences and crop rotations. The N2O trade-offs were correlated with frequency of legume CC incorporation (Figure 5; Table 1), which was more common in regions which lacked legume-based crop rotations (e.g., corn-soy rotations; Table S3).
4 DISCUSSION
4.1 National CC mitigation potential up to 65% lower than previously estimated
Our national estimate of CC GHG mitigation potential (39.0 ± 24.3 Mt CO2e year−1) is substantially lower than previous estimates of CC mitigation potential, which range from 65 to 103 Mt CO2e year−1 (Fargione et al., 2018; Roe et al., 2021; Sperow et al., 2003). These previous assessments represent an upper theoretical maximum, while the use of current land management data and the DayCent model reveal that mitigation potential due to CC adoption is limited by regional variability in net GHG flux, reduced C accrual over time following adoption, and uncertainty surrounding N2O trade-offs.
4.2 Regional and temporal variability limits carbon sequestration rates
We found large regional variability in C sequestration rates due to CC (Figure 2a; Table S4); the Lower Mississippi region and Central California region had rates comparable to averages published in meta-analyses and used in previous mitigation potential assessments involving CC (Abdalla et al., 2019; McClelland, Paustian, & Schipanski, 2021; Poeplau & Don, 2015; Vicente-Vicente et al., 2016). These regions had particularly high C sequestration rates due to higher annual precipitation and longer growing seasons, which yielded greater CC biomass production (Figure 3). However, 81% of cropland eligible for CC adoption is located in drier regions such as North Central, Western Non-Coastal, and the Northern and Southern Great Plains, where C sequestration rates decreased by more than half due to limited precipitation (Figure 3; Table S4). This is consistent with studies showing that SOC gains can be inconsistent and accrue more slowly in semi-arid regions, where C inputs are dependent on variable and low precipitation patterns (Blanco-Canqui et al., 2013; Simon et al., 2022). These areas are underrepresented in CC research compared with wetter climates (Poeplau & Don, 2015), where current CC adoption rates are higher (Figure 1). This suggests that much of the US cropland eligible for new CC adoption is poorly represented in meta-analyses, thus introducing bias in average C sequestration rates for large scale assessments that include a wide range of climates (Abdalla et al., 2019; McClelland, Paustian, & Schipanski, 2021; Poeplau & Don, 2015; Vicente-Vicente et al., 2016). Our national average C sequestration rate of 0.492 t CO2e ha−1 year−1 (134 kg C ha−1 year−1) is aligned with national analysis conducted in France which employed high-resolution modeling approaches to across climatic conditions to estimate an average CC sequestration potential of 131 kg C ha−1 year−1 (Launay et al., 2021).
Total C sequestration potential was further reduced due to the consideration of winter grain production in our analysis. Winter wheat production makes up 13.9 Mha of US cropland and is especially prevalent in the Great Plains regions, where 32% of eligible CC area was located (Figure 1; Table S2; USDA-NASS, 2022). CC frequency is shown to drive soil C accrual, both due to increased C inputs as well as increased microbial biomass and labile C pools (Brennan & Acosta-Martinez, 2017; White et al., 2020). Consequently, CC frequency was a key determinant of average annual CC biomass, which was the largest driver of C accrual rates across study locations (Figure 3; Table 1).
Our analysis also revealed the extent to which C sequestration benefits decline over time following CC adoption (Figure 4). Simulated and field studies alike have shown that C sequestration rates slow as a new steady-state equilibrium is reached (García-González et al., 2018; Mazzoncini et al., 2011), with rates declining significantly after 20 years of CC adoption (Lugato et al., 2018; Quemada et al., 2020). Furthermore, some of the potential for enhancing C sinks on US cropland has already been realized through past adoption of CC and other recommended management practices, such as conservation tillage and organic amendments, which likely further reduced C sequestration rates (Moore et al., 2023; Ogle et al., 2023). The decline in climate benefits over time demonstrates that enhancing the land C sink is not a long-term solution to offset GHG emissions and must be coupled with immediate and aggressive reduction in fossil C emissions (Hansen et al., 2013; Lassaletta & Aguilera, 2015).
4.3 Nitrous oxide trade-offs increase uncertainty surrounding estimated mitigation potential
Nitrous oxide trade-offs were associated with large uncertainty that should be considered when using CC as a climate mitigation measure. Simulated changes in N2O emissions increased the uncertainty surrounding the estimated GHG mitigation potential by 40% (Figure 1a). This level of uncertainty is common for modeled N2O emissions, which are highly sensitive to management data and weather patterns (Del Grosso et al., 2010). Nitrous oxide emissions are driven by multiple factors, including N availability, labile C, soil moisture, and soil physical properties, which are temporally and spatially dynamic, and emissions can increase or decrease depending on CC management choices (Basche et al., 2014). Improved understanding of these processes is needed to accurately predict net GHG impacts at the site level.
The correlation between N2O trade-offs and frequency of legume CC incorporation observed in our study (Table 1; Figure 5) is consistent with previous literature which shows that N additions from legumes can enhance N2O emissions (Basche et al., 2014; Han et al., 2017). These studies emphasize the need to adjust fertilizer rates to account for N inputs from legume CC. In our analysis, we did not simulate a reduction in N inputs with legume CC and therefore GHG benefits due to reduced N2O emissions may be underestimated. Furthermore, fertilizer savings can in turn contribute to greater economic feasibility of CC and reduce indirect GHG emissions associated with fertilizer production (Fargione et al., 2018). Without proper adjustments, however, C sequestration benefits of legume CC may be completely offset by increased N2O emissions, particularly as C pools approach new steady-state equilibrium (Lugato et al., 2018; Quemada et al., 2020). Nitrification inhibitors can also be used in conjunction with CC to minimize the risk of N2O trade-offs (Bozal-Leorri et al., 2023).
4.4 Regions with high relative mitigation potential
The estimated mitigation potential in this study depends on rapid acceleration of CC adoption, which will undoubtedly require substantial investments in incentive-based programs and technical assistance (Kathage et al., 2022; Piñeiro et al., 2020). Our spatially explicit analysis identified regions that have high relative mitigation potentials, where this investment should be concentrated to maximize climate benefits. Specifically, the North Central, Lower Mississippi, and Southern Great Plains regions had relatively large contributions, either due to available cropland (North Central, Southern Great Plains) or high per-area C sequestration rates (Lower Mississippi). They also had negligible or slightly favorable N2O impacts, as primarily grass CC were simulated in these regions due to current producer preference and the prevalence of soy in crop rotations (Table S3).
Regional differences in GHG mitigation potential may inform where incentive and extension programs are prioritized, but trade-offs and other environmental objectives should also be considered. For example, 25% of the national mitigation potential was concentrated in the semi-arid Great Plains; however, CC are also known to reduce yields in this region due to water limitations, since fallow periods are typically used to recharge soil moisture between cash crops (Eash et al., 2021; Wang et al., 2021). In addition to increasing required incentive payments, yield penalties due to CC could also stimulate the expansion of cropland area to maintain regional productivity levels, thus increasing indirect GHG emissions through leakage (Murray et al., 2007). Our analysis demonstrated larger and more variable yield reductions in the Great Plains as compared to other regions, though these yield impacts were marginal (4.4% ± 12.9% and 3.7% ± 16.5% reductions in the Northern and Southern Great Plains, respectively; Table S5). Still, yield impacts were beyond the scope of our research aim to quantify the biophysical mitigation potential of CC in the United States, and we recommend further analysis to corroborate modeled yield output with empirical data. At the same time, CC adoption offers protection against erosion (Blanco-Canqui et al., 2015), which is of particular concern in the Great Plains due to dry conditions and strong winds (Duniway et al., 2019). We did not consider erosion in our analysis as the DayCent model does not estimate erosion impacts. Erosion is shown to have a significant impact on C dynamics and may increase uncertainty surrounding soil C gains estimated here and highlight additional CC benefits (Tan et al., 2020).
In humid regions such as the Lower Mississippi, CC can improve yields and increase nutrient retention, thereby reducing fertilizer costs and addressing water quality concerns (Kladivko et al., 2014; Wang et al., 2021). These CC cobenefits may explain high projected CC adoption rates in the Lower Mississippi region, despite a lack of state-level incentives (Moore et al., 2023; Piñeiro et al., 2020). Regional analysis of CC benefits and trade-offs is needed to examine where and to what extent public benefits align with incentive payments to identify feasible adoption rates and/or to prioritize incentive programs.
5 CONCLUSIONS
Previous CC climate change mitigation potential assessments in the United States have presented theoretical maximums, while we find the actual C sequestration potential of CC is 45%–65% lower when spatial and temporal variability are considered (Fargione et al., 2018; Roe et al., 2021; Sperow et al., 2003). Furthermore, N2O impacts introduce a large degree of uncertainty that should be considered in CC policy that aims to reduce GHG emissions. As CC are estimated to have a large climate change mitigation potential compared with other agricultural GHG mitigation strategies (Fargione et al., 2018), this could have important implications for the extent to which improved management of cropland can contribute to national emissions reduction goals.
Despite these limitations, regions such as North Central, Lower Mississippi River Basin, and Southern Great Plains show high potential to reduce GHG emissions through CC adoption while providing important agroecosystem cobenefits. A regionally based approach that balances mitigation potential with stakeholder valuation of a broader suite of ecosystem services is needed to inform more effective incentive programs and help CC contribute to climate regulation and the sustainability of the US agricultural sector.
AUTHOR CONTRIBUTIONS
Lisa Eash: Data curation; formal analysis; investigation; methodology; validation; visualization; writing – original draft; writing – review and editing. Stephen Ogle: Conceptualization; data curation; funding acquisition; investigation; methodology; project administration; resources; software; supervision; writing – review and editing. Shelby C. McClelland: Conceptualization; funding acquisition; methodology; writing – review and editing. Steven J. Fonte: Supervision; writing – review and editing. Meagan E. Schipanski: Conceptualization; funding acquisition; investigation; methodology; project administration; supervision; writing – review and editing.
ACKNOWLEDGMENTS
We would like to thank Stephen Williams, Shannon Spencer, and Ernie Marx for their technical assistance. We are also grateful for financial support from National Institute for Food and Agriculture (No. 2016-51106-25712).
CONFLICT OF INTEREST STATEMENT
The authors have no conflict of interest to declare.
Open Research
DATA AVAILABILITY STATEMENT
The data that support the findings of this study are available from Dryad at https://doi.org/10.5061/dryad.fbg79cp3v.


