Human-modified landscapes driving the global primate extinction crisis
Abstract
The world's primates have been severely impacted in diverse and profound ways by anthropogenic pressures. Here, we evaluate the impact of various infrastructures and human-modified landscapes on spatial patterns of primate species richness, at both global and regional scales. We overlaid the International Union for the Conservation of Nature (IUCN) range maps of 520 primate species and applied a global 100 km2 grid. We used structural equation modeling and simultaneous autoregressive models to evaluate direct and indirect effects of six human-altered landscapes variables (i.e., human footprint [HFP], croplands [CROP], road density [ROAD], pasture lands [PAST], protected areas [PAs], and Indigenous Peoples' lands [IPLs]) on global primate species richness, threatened and non-threatened species, as well as on species with decreasing and non-decreasing populations. Two-thirds of all primate species are classified as threatened (i.e., Critically Endangered, Endangered, and Vulnerable), with ~86% experiencing population declines, and ~84% impacted by domestic or international trade. We found that the expansion of PAST, HFP, CROP, and road infrastructure had the most direct negative effects on primate richness. In contrast, forested habitat within IPLs and PAs was positively associated in safeguarding primate species diversity globally, with an even stronger effect at the regional level. Our results show that IPLs and PAs play a critical role in primate species conservation, helping to prevent their extinction; in contrast, HFP growth and expansion has a dramatically negative effect on primate species worldwide. Our findings support predictions that the continued negative impact of anthropogenic pressures on natural habitats may lead to a significant decline in global primate species richness, and likely, species extirpations. We advocate for stronger national and international policy frameworks promoting alternative/sustainable livelihoods and reducing persistent anthropogenic pressures to help mitigate the extinction risk of the world's primate species.
1 INTRODUCTION
Recent decades have brought about a significant negative impact on the environment due to anthropogenic pressures such as land use change, overexploitation/over-harvesting, pollution, and climate change, all of which have contributed to a massive global loss in biodiversity (Ceballos et al., 2020; Dirzo et al., 2014). The expansion of land conversion for agriculture and livestock production has led to exponential losses of primary vegetation and natural habitats, which in turn has drastically reduced species' population sizes and overall biodiversity (Curtis et al., 2018; Lanz et al., 2018; Steffen et al., 2015). The scope and magnitude of the increasing human footprint (HFP) (i.e., human population growth which will increase demand and consumption of natural resources at both regional and global scales) threatens ecosystems and accelerates the global mass extinction crisis (Ceballos et al., 2017; Jaureguiberry et al., 2022). Global policy frameworks aimed at mitigating negative effects on biodiversity (e.g., the United Nations Sustainable Development Goals, post-2020 Global Biodiversity Framework) should be based on sound scientific knowledge to understand the value of human-altered ecosystems. This understanding will help address the new challenges in sustaining the health of biodiversity and ecosystem functions (Chan et al., 2023; Leadley et al., 2022; Leclère et al., 2020).
Among terrestrial mammals, non-human primates (hereafter primates) are a diverse and widespread taxonomic group. Critically, they play an important role in regulating community-wide ecological functions, processes, and services (e.g., seed dispersal, pollination, and predator–prey relationships) that promote forest regeneration and carbon sequestration, and provide benefits to local human populations (Chapman et al., 2013; Estrada et al., 2017; Galán-Acedo, Arroyo-Rodríguez, Andresen, et al., 2019; Galán-Acedo, Arroyo-Rodríguez, Cudney-Valenzuela, et al., 2019). Relative to most mammals, primates typically have slow life histories, are gregarious, and have larger body masses, all of which, unfortunately, are traits that make them particularly vulnerable to extinction (Estrada et al., 2017; Purvis et al., 2000). Threats to primates are diverse and include anthropogenically driven factors related to increasing human population growth rates, such as habitat fragmentation and degradation, agricultural expansion, and expanding road and rail networks (Ascensão et al., 2021, 2022; Branch et al., 2022; Estrada et al., 2020). These pressures often lead to direct (e.g., hunting and wildlife trade) and indirect (e.g., loss of genetic diversity) mortalities, ultimately contributing to population declines and local extirpations, increasing species exposure to threats and extinction risks (de Almeida-Rocha et al., 2017; Estrada et al., 2017; Fa et al., 2003). Approximately 68% of all primate species have been listed as threatened (i.e., Critically Endangered [CR], Endangered [EN], or Vulnerable [VU]) by the International Union for the Conservation of Nature (IUCN, 2022) and are at risk of local or range-wide extinction.
Due to their diversity and richness, primate species maintain various ecological niches, thus their ability to cope with anthropogenic pressures is equally diverse (Galán-Acedo, Arroyo-Rodríguez, Andresen, et al., 2019; Galán-Acedo, Arroyo-Rodríguez, Cudney-Valenzuela, et al., 2019; Machado et al., 2022; Mittermeier et al., 2013). Whereas some primates might have little tolerance for anthropogenic pressures and cannot persist in modified habitats, others may be more ecologically flexible, allowing them to persist in anthropogenic landscapes (Eppley et al., 2020; Galán-Acedo et al., 2021; Hoffman & O'Riain, 2012; Siljander et al., 2020). Regardless of the ability to cope within anthropogenic landscapes, both protected areas (PAs) and Indigenous Peoples' lands (IPLs) tend to provide stable habitats for the conservation of primate species and other terrestrial vertebrates (Estrada et al., 2022; Torres-Romero et al., 2020; Torres-Romero & Giordano, 2022), but PAs are not always effective for primate conservation (see e.g., Appleton et al., 2022; Chapman & Peres, 2021; Hoskins et al., 2020; Junker et al., 2020; Nijman, 2005). Despite these species' strongholds, however, our overall lack of knowledge of how anthropogenic variables differentially impact primate diversity at different spatial scales limits efforts to manage their long-term viability (Garnett et al., 2018; Junker et al., 2020).
While the impact of the ongoing sixth mass extinction on earth's biodiversity, including primates, has been explored (see e.g., Ceballos et al., 2017, 2020; Estrada et al., 2017, 2022), only a few studies have evaluated the exposure risk of primate ranges to land use and climate changes (e.g., Carvalho et al., 2019; de Almeida-Rocha et al., 2017; Fernández et al., 2022). However, there is currently a lack of detailed analyses that explore the influence of global- and regional-scale landscape modifications on primate diversity, population trends, and threatened species status. Identifying the effects of anthropogenic pressures on species richness spatial patterns may assist in establishing targeted conservation strategies. Such information may better facilitate the development of regional and transnational conservation actions aimed at mitigating extinction risk across increasingly human-dominated landscapes. Here, we employ a path analysis framework to contrast the dependent and independent associations of human-altered landscape variables, as well as PAs, and IPLs, on primate diversity across and between large-scale spatial gradients, that is, major biogeographic regions (Table 1). Using the most recent IUCN Red List assessments (IUCN, 2022), we specifically examined the following: (i) diversity of primates (i.e., overall species richness), (ii) number of threatened primate species (i.e., CR, EN, and VU) versus non-threatened species (i.e., LC = Least Concern, NT = Near Threatened), and (iii) primate species with a “decreasing” population trend versus non-decreasing (i.e., stable and/or increasing population).
| Predictor | Expected overall relationship | Rationale and reference | Hypotheses |
|---|---|---|---|
| Human footprint (HFP) | Negative | Integrates global records of the cumulative human pressure on the environment, at a spatial resolution of ~1 km. This metric is considered the most complete variable and incorporates most anthropogenic pressures, including human population, built environments, nightlights, railways, navigable waterways, electrical power support infrastructure, and other human land use changes (Venter et al., 2016) | High levels of human population and urbanization leads to growing demands for land, food production, and other resources and services. This in turn translates into high and continuous rates of habitat degradation, loss, and fragmentation as they remove natural vegetation, and thus affect many species occurrences, abundance, diversity, as well as changes in the distribution of species, even increasing local extinctions within species' geographic ranges |
| Pasture lands (PAST) | Negative | Covers 22% of the Earth's land and represents the proportion of pasture land used to support grazing animals, making it the most extensive direct human pressure on the environment. This metric is generated at a spatial resolution of ~1 km (Ramankutty et al., 2008) | |
| Road density (ROAD) | Negative | The measure of road infrastructure (meters of road per km2 land area per cell) on a 5 × 5 arc minute resolution (approximately 8 × 8 km at the equator). Networks of high-traffic roads are strongly correlated with fragmentation, forest loss, and decreased biodiversity worldwide (Meijer et al., 2018) | |
| Croplands (CROP) | Negative | This metric varies in structure from intensely managed monocultures to mosaic agricultures; agricultural expansion and intensification threaten ecosystem functioning and may lead to species extinction through habitat loss and fragmentation. This metric is based on spatially explicit global estimates at a resolution of 0.025° × 0.025° (~3 km × 3 km at the Equator) (Potapov et al., 2022) | |
| Indigenous Peoples' lands (ILPs) | Small/large | IPLs, which include terrestrial lands and spatial territories managed or owned by Indigenous Nations, comprise the majority of recognized terrestrial conservation lands, habitat protection, and ecologically intact landscapes globally (Garnett et al., 2018). Currently, IPLs cover at least ~38 million km2 in 87 countries or politically distinct areas across all inhabited continents, representing over a quarter of the world's land surface (Garnett et al., 2018) | Large patches of habitat are a tenet of conservation to safeguard biodiversity, and typically are more effective to protect large-scale ecological processes. However, sets of small patches usually harbor more species than one or a few larger patches, even small core areas can serve as potential refuges or “safe places” for many species, and thus may play a leading role in maintaining a network of biodiversity hotspots |
| Protected areas (PAs) | Small/large | Protected areas (PAs) are designated lands intended to conserve natural, ecological, or cultural values, as defined by the International Union for Conservation of Nature. Currently, there are approximately 250,000 terrestrial PAs covering 22 million km2. We included the seven distinct protected area categories (IUCN): Ia—strict nature reserve, Ib—wilderness area, II—national park, III—natural monument or feature, IV—habitat/species management area, V—protected landscape/seascape, and VI—multiple use management and protected area, where the sustainable use of natural resources is permitted (UNEP–WCMC, 2022) |
- Note: “Human pressure” represents the anthropogenic variables and, “conservation lands” to landscape attributes, which can affect diversity depending on size (i.e., small/large core areas).
2 METHODS
The order Primates (including strepsirrhines, tarsiers, monkeys, and apes) is the third most specious mammal radiation, constituting approximately 520 extant taxa (IUCN, 2022). They are represented by 16 families within four major geographic regions: (1) The Americas (Aotidae, Atelidae, Callitrichidae, Cebidae, and Pitheciidae), (2) Africa (Cercopithecidae, Galagidae, Lorisidae, and Hominidae), (3) Madagascar (Cheirogaleidae, Daubentoniidae, Indriidae, Lemuridae, and Lepilemuridae), and (4) Asia (Cercopithecidae, Hominidae, Hylobatidae, Lorisidae, and Tarsiidae).
2.1 Species distribution data
We collated data on the geographic range and population assessments of all available extant primate species from the IUCN Red List (http://www.iucnredlist.org, accessed December 2022). We recorded each species' classification according to “Red List” categories (i.e., Not Evaluated, Data Deficient, Least Concern, Near Threatened, Vulnerable, Endangered, Critically Endangered, Extinct in the Wild, and Extinct; IUCN, 2022). We then compiled information on population trends (i.e., declining, stable, increasing, or unknown), as well as the “use and trade” of each species (i.e., food–human; food–animal; medicine–human & veterinary; poisons; manufacturing chemicals; other chemicals; fuels; fibre; construction or structural materials; wearing apparel, accessories; other household goods; pets/display animals, horticulture; research; sport hunting/specimen collecting; establishing ex-situ production, etc.) from the IUCN (2022), and international trade in primates from the CITES database. The only primate range countries that are not Party to CITES are South Sudan and East Timor. We selected live trade as here each unit represents one individual primate, and avoids double counting (e.g., when parts are exported to different countries or over multiple years), for the period 2015–2020 (data from 2022 were not yet available and the Covid-19 pandemic resulted in several export bans in 2021 possibly distorting the overall pattern). Trade is reported by both importers and exporters, and here we use data as reported by exporters. We excluded Extinct (EX) species from our analyses, leaving us with data relevant to 520 primate taxa.
We applied a Behrmann equal-area global grid with a spatial resolution of 100 km × 100 km (approximately 1° at the equator), overlapping with geographic range maps from each primate taxon to extract presence/absence using ArcGIS 10.1 (ESRI, 2011). We then excluded grid cells containing <50% of land surface and where species richness was effectively zero. As such, we analyzed a total of 4659 cells, each of which was assigned to one of four biogeographic regions (i.e., Americas, Africa, Madagascar, and Asia) as defined in previous macroecological studies (e.g., Carvalho et al., 2019; Estrada et al., 2017, 2022; Gouveia et al., 2014; Torres-Romero et al., 2020; Torres-Romero & Giordano, 2022).
IUCN species distribution maps are generated using a minimum convex polygon estimation procedure (IUCN, 2022). These maps represent the current known extent of occurrence of a species and are based on field guides, taxonomic reviews, and expert knowledge. While IUCN range map data are the most frequently used measure of species diversity in macroecological studies, including global terrestrial vertebrates (e.g., Ceballos et al., 2017, 2020), they are often used at a grid cell spatial resolution of 100 km2. This is a common method used in broad-scale analyses, and this spatial resolution is fine enough to capture details about diversity variations, yet coarse enough to not compromise the reliability of derived biodiversity metrics, such as species richness (Hortal, 2008). For example, several studies have been conducted on the relationship between environmental and/or human impacts and species richness for different taxonomic groups at this spatial resolution, including insects (Zhao et al., 2020), reptiles (Lewin et al., 2016), and terrestrial mammals (Gouveia et al., 2014; Torres-Romero & Olalla-Tárraga, 2015). We therefore felt confident that our grain size was not only sufficient to provide wide geographic coverage, but also to present a clear description of large-scale biodiversity gradients and their determinants.
2.2 Anthropogenic and landscape attributes
We considered four variables, that is, HFP (Venter et al., 2016), pasture lands (PAST; Ramankutty et al., 2008), croplands (CROP; Potapov et al., 2022), and road density (ROAD; Meijer et al., 2018), to evaluate anthropogenic effects on primate species richness (Table 1). All are considered major causes of habitat loss—whether due to degradation, fragmentation, or destruction—representing one of the primary threats to biodiversity and contributing to accelerating extinction rates (Ceballos et al., 2017, 2020; Torres-Romero et al., 2020). We also evaluated the effects of two landscape attributes, that is, PAs (UNEP–WCMC, 2022), and IPLs (Garnett et al., 2018), based on their relative importance as potential refuge habitats (Table 1). These habitat patches are relevant because they may represent critical areas for safeguarding biodiversity, where natural ecological and biological processes are maintained within a landscape. Specifically, we included these variables based on their relative importance to prior macroecological studies in defining the distribution of biodiversity-related patterns and processes, including species population declines and the general extinction crisis (Estrada et al., 2017, 2022; Garnett et al., 2018; Torres-Romero & Giordano, 2022). All predictor variables are further defined in Table 1 and were resampled based on 100 km × 100 km grid cells in ArcGIS 10.1 (ESRI, 2011) to be integrated into our analyses.
2.3 Statistical analyses
We initially used Pearson product–moment correlations (PPMCs) to explore associations between species richness and each predictor variable. To control for possible spatial autocorrelation in PPMC, we used modified t-tests (Dutilleul et al., 1993) to calculate unbiased estimates of significance for each correlation coefficient. Since none of the variables were highly correlated (|r| > .7; Dormann et al., 2013), all were included in the models. Next, we tested for potential collinearity between response and predictor variables using a variance inflation factor with a threshold equal to or less than 4 indicating collinearity was low and did not represent a major concern (Hair et al., 2014). We then used a path analysis based on structural equation modeling (SEMs), which are represented with path diagrams that evaluate the direct and indirect effects of hypothesized causal relationships (Shipley, 2016). Consequently, simultaneous autoregressive (SAR) models allowed us to examine the direct and indirect associations of anthropogenic and landscape attributes. The combination of both approaches is well-established and commonly used to study ecological systems that are driven by interconnected processes in a single network (e.g., Cerqueira et al., 2021; Ilsøe et al., 2017; Kissling et al., 2008). Direct effects are estimated by the standardized regression coefficient between a predictor variable and a response variable (i.e., the direct link), whereas indirect effects correspond to paths originating at the HFP variable and passing through other variables before reaching primate species richness (Shipley, 2016). We built SEMs for data at the global and regional scales (i.e., Americas, Africa, Madagascar, and Asia). SEMs were also constructed for species threatened and with declining populations following a general or global path (Figure 2). To minimize spatial autocorrelation on inference from SEMs (Legendre & Legendre, 1998), we used standardized regression coefficients using SAR models with species richness as the response variable (see Kissling et al., 2008), and for each SEMs, we used standardized regression coefficients to assess rank the importance of each predictor in SEMs. The use of SAR models reduces spatial autocorrelation under a variety of spatial pattern scenarios (Kissling & Carl, 2008), and thus allows us to control for these effects. All statistical analyses were conducted in R 3.4.0 (R Development Core Team, 2020), using the “spdep” (Bivand, 2015) and “semPlot” (Epskamp, 2019) packages.
In macroecological studies, different statistical analyses are employed in addition to SEMs, such as regression analysis, model selection, and multi-model inference, among others. We applied a common method that has been previously used in different macroecological studies, for example, on woody plant and bird diversity (Kissling et al., 2008), mammal diversity (Gouveia et al., 2014), and jaguar ecology (Cerqueira et al., 2021). While various statistical analyses are available, there is no a priori best analysis, thus we focused on a singular method to avoid confusion, as opposed to using multiple analyses.
3 RESULTS
3.1 Global primate species patterns
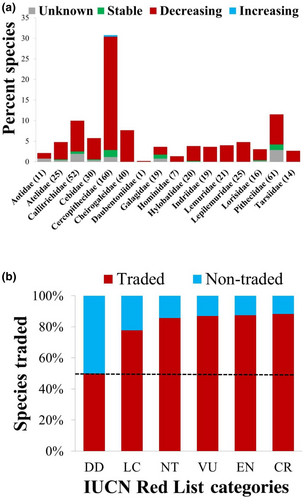
According to our compiled data, primate species richness was highest in the Americas (n = 178), followed by Asia (n = 129), Africa (n = 107), and Madagascar (n = 106) regions (Figure 1). When considering threatened species (i.e., CR, EN, and VU) and species with declining populations, the highest richness occurred in Asia, followed by Africa, Madagascar, and the Americas (Figure 1). This same pattern was also observed for trade and trafficking (Figure 1). Furthermore, our results indicated that 84% of primate species are affected by wildlife trade. In fact, primate species that are traded were listed in higher IUCN Red List threat categories and constitute more than half of all known primate taxa (Figure 2b).
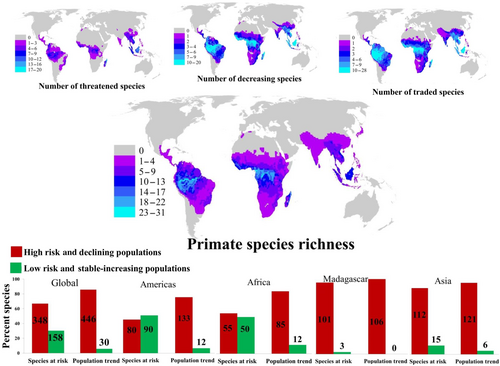
Of all primate taxa we examined (n = 520), 67% (n = 348) were listed by the IUCN as threatened (i.e., CR, EN, or VU), ~30% (n = 158) as non-threatened (i.e., LC and NT), and only ~3% (n = 14) of data are listed as Data Deficient. Approximately 86% (n = 446) of primate taxa have declining populations, while ~6% (n = 30) had stable and/or increasing populations, and ~8.5% (n = 44) are listed as unknown (Figure 1). We also found similar patterns in the Americas, Africa, Madagascar, and Asia, where the proportion of species threatened are greatest compared to non-threatened, as well as the primates with declining populations showed a proportion more pronounced versus those primates that exhibit stable or increasing populations (Figure 1).
Our dataset shows that primate population trends are heavily declining, but the percentage greatly varies across families, for example, Cercopithecidae (143 spp.), Cheirogaleidae (40 spp.), Callitrichidae (39 spp.), Pitheciidae (38 spp.), Cebidae (27 spp.), Lepilemuridae (25 spp.), and Atelidae (22 spp.) (Figure 2a). Furthermore, among 86% of primate taxa with declining populations, 77% were listed as threatened (i.e., CR, EN, or VU), 21% were non-threatened (i.e., LC and NT), and only 2% were classified as Data Deficient. For primate taxa with stable population trends (~5.5%), 50% were categorized as threatened (i.e., CR, EN, or VU) and 50% were non-threatened (i.e., LC and NT). Unfortunately, only about ~0.5% of the primates studied were estimated to have an increasing population trend, with 7% of these listed as threatened and 83% as non-threatened, while 8.5% were listed as unknown. Among those with unknown trends, 2% were listed as threatened, 85% as non-threatened, and 13% were classified as Data Deficient.
3.2 Path analysis models
Based on our SEMs analyses, we found that PAST, HFP, and ROAD were the most important factors explaining primate species richness patterns on a global scale; all three of these variables had a strong direct negative effect on primate richness (Figure 3). Similarly, HFP, PAST, and CROP had strong direct negative effects on both threatened and non-threatened species richness (Figure 3a,b). For primate species with decreasing population trends, the same variables (i.e., HFP, PAST, and CROP) exhibited direct negative effects, while PAST and CROP also showed a direct negative effect for species with non-decreasing populations (Figure 3c,d). In contrast, PAs emerged as important positive predictors for species that are threatened, and species with declining populations, but IPLs had a negative association for non-decreasing species (i.e., stable and increasing populations) (Figure 3a,c,d). Globally, this should be interpreted as both large and small patches having a disproportionately high value in protecting the world's primate fauna.
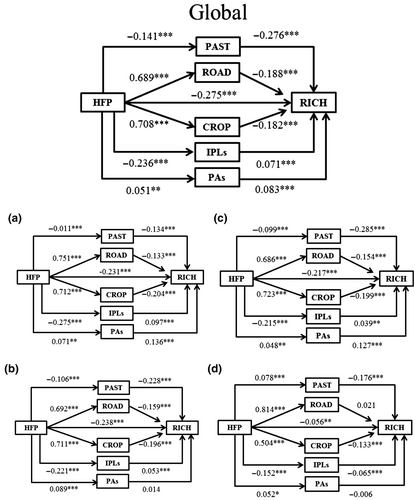
Across the Americas, we found similar patterns where the pressures of humans (i.e., roads, HFP, and CROP) had the most significant direct negative impact on species richness patterns (Figure 4). Again, for threatened and non-threatened species richness, as well as for primate species populations (both declining and stable/increasing), we also found the same pattern, where the expansion of human activities (i.e., roads, HFP, and PAST) showed direct negative effects (Figure 4a–d). However, we found that landscape areas considered to be IPLs had negative and positive associations on threatened and non-threatened species richness, respectively (Figure 4a,b). Specifically, this means that across the region, small IPLs tended to protect more threatened species than larger ones. Concerning primate species populations (both declining and stable/increasing), PAs coverage, had a direct positive impact (Figure 4c,d).
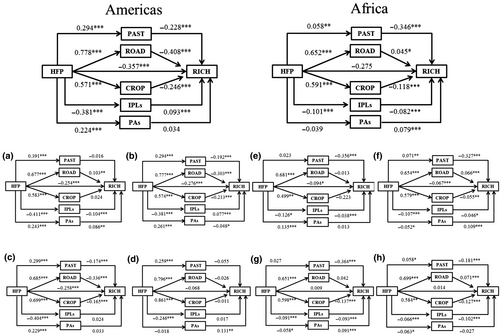
For Africa, PAST and CROP had the most direct negative effect on species richness patterns, whereas IPLs and PAs showed a negative and positive association, respectively (Figure 4). For threatened and non-threatened species, as well as for primate species populations (both declining and stable/increasing), human activities had direct negative effects on spatial patterns of these primate species (Figure 4e–h), whereas PAs emerged as an important predictor with s direct positive effect for non-threatened species (Figure 4f). In addition, IPLs had a direct negative effect on primate populations (both those decreasing and stable/increasing), however, PAs also emerged as an important predictor for both primate population categories (i.e., decreasing and stable/increasing) with positive and negative effects, respectively (Figure 4g,h).
For Madagascar, PAs emerged as the single strongest predictor with a direct positive effect on primate species richness (Figure 5). HFP, PAST, and ROAD infrastructure, followed in importance as negatively impacting species richness. It should be noted that there are no areas classified as IPLs in Madagascar (Figure 5). Furthermore, the path analysis included all Madagascar primate because 95% and 100% are threatened with extinction and with a “decreasing” population trend, respectively.
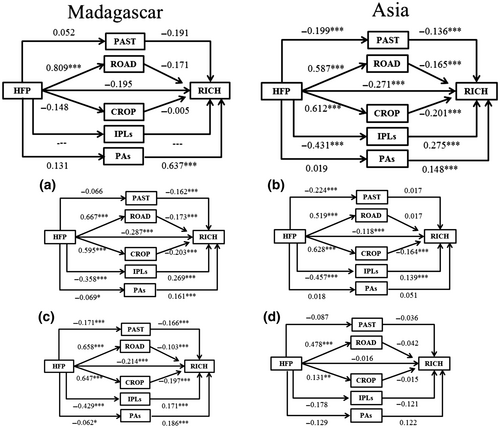
Within the Asia region, IPLs and PAs were the most important factor predicting higher primate species richness, as both ecological landscapes had direct positive effects; whereas human activities (i.e., HFP, CROP, and ROAD) exhibited negative direct effects on richness (Figure 5), with strong direct negative effects for threatened and non-threatened species, as well as for declining, stable, and increasing primate populations (Figure 5a–d). Indeed, IPLs and PAs emerged as the strongest predictor effects for all primate species categories and for declining, stable, and increasing primate populations, but IPLs had a negative association for stable and increasing primate populations (Figure 5a–d). This means that those small IPLs and large PAs tended to protect more stable and increasing (i.e., non-decreasing) species compared to larger IPLs and smaller PAs (Figure 5d).
4 DISCUSSION
Our results provide quantitative evidence for the various ways that human impacts and landscape conditions influence the global distribution patterns of primates' species richness. Regions experiencing high rates of land transformation through direct human interactions (e.g., development and expansion of various infrastructures, agriculture, etc.) showed pronounced negative effects on primate species richness patterns. In fact, our results showed that these negative effects were for both species with decreasing population trends and species with stable populations, revealing the critically dire situation for primates worldwide. Although recent modeling projections by Carvalho et al. (2019) suggested that approximately a quarter of Asian and African primates will experience extensive agricultural expansions within their ranges that lead to a 98% increase in disturbed habitats, our study indicates that the presence of small or large core areas can serve as potential refuges (i.e., IPLs or PAs) as these were directly associated with primate richness. Previous studies have demonstrated the importance of protected habitats which, for example, may buffer animal populations against the impact of anthropogenic pressures by providing essential resources, including food, suitable resting/sleeping locations, and breeding opportunities (Eppley et al., 2022; Estrada et al., 2018; Laurance, 2005). Although many protected forest lands are experiencing significant degradation due to human activity (Chapman & Peres, 2021; Laurance et al., 2012), global species richness patterns are shaped by the presence of IPLs, showing that they play an important role in determining the long-term persistence of primate species (Corrigan et al., 2018; Estrada et al., 2022), as well as threatened species versus non-threatened, and decreasing versus non-decreasing, both globally and regionally (Bruner et al., 2001; Griffiths et al., 2023).
In Africa and Madagascar, IPLs and PAs cover approximately 6.6 and 4.5 million km2, respectively (Estrada et al., 2022). However, our results show that overall; primate species are at risk of extinction from the rapid and relatively recent expansion of the HFP. This appears to be a response to not only local but also global economic demands, which are accelerating the expansion of agricultural and livestock activities. In turn, this results in deforestation and creates a potent economic impetus for constructing roads through forested areas, driving massive biodiversity loss (Ascensão et al., 2022; Estrada et al., 2018). Other studies have found that the expansion of land use changes frequently contributes to significant declines in many African mammal populations, including primates (Carvalho et al., 2019; Chapman et al., 2006; Di Marco et al., 2014; McKinney et al., 2023). Similarly, Morelli et al. (2020) reported on the severe effect of human activities on rainforest habitat losses, specifically, that the eastern rainforest habitat of Madagascar could be almost entirely lost before the year 2080. In fact, many lemur taxa are unable to cope with varying degrees of habitat fragmentation, so as viable habitat contracts; the resulting extirpation may be widespread (Eppley et al., 2020; Mittermeier et al., 2023; Ralimanana et al., 2022; Schwitzer et al., 2014).
Within the Americas, we found that increased land use is driven by the global need to feed and support a rapidly expanding human population, which negatively impacts primate species (Estrada et al., 2012, 2020). Thus, the expansion of pasture and cropland degrades and fragments forest habitat, causing significant primate range contractions and population declines. Furthermore, primate populations living in these relatively well-preserved habitats, for instance, the Amazon rainforest, will have additional challenges as anthropogenic pressures increase, such as accessing limited resources, exposure to novel zoonotic diseases, and predation (Estrada et al., 2012, 2018; Fernández et al., 2022; Han et al., 2016). Similar to other regions, large forested areas, including the Amazon, are important for primate diversity and have been well demonstrated (Gouveia et al., 2014).
Throughout the Americas, IPLs and PAs cover approximately 3.0 and 5.2 million km2, respectively (Estrada et al., 2022). We found that IPLs are critical to protecting higher numbers of threatened primates, despite the reality that these forests are increasingly the most vulnerable to climate change, agriculture conversion and development, and wildfire (Feng et al., 2021; Garnett et al., 2018; Zhang et al., 2019). In contrast, we did not find an effect of PAs on primate species richness, suggesting that in most cases, in the Americas current PA management and law enforcement are insufficient for effective wildlife protection, and/or that PAs have only limited overall with primate population distributions (Agostini et al., 2022).
Within Asia, IPLs and PAs formally manage approximately 4.4 and 1.0 million km2 respectively, and have generally been considered critical to the sustainability and protection of ecosystems, the conservation of global biodiversity, and climate change mitigation strategies (Estrada et al., 2022; Garnett et al., 2018; Torres-Romero et al., 2020; Zhang et al., 2021). Indeed, our results for Asia indicate that IPLs were positively associated with all primate species, including threatened and non-threatened primate richness, and both declining and non-declining species. Importantly, HFP had a strong direct negative effect on these same three primate groupings, except for non-declining species. However, the cumulative pressure on IPLs from land use change and encroachment (e.g., from roads, expansion of pasture and cropland, etc.) may further compromise what remains of these important landscapes and increase the extinction risk of primates (Carvalho et al., 2019; Kennedy et al., 2019; Lechner et al., 2018).
Overall, while we found positive effects of IPLs and PAs on primate conservation globally, the regional variation of efficacy highlights the need for evidence-driven, bottom-up approaches when gazetting land and developing management plans for PAs (Oldekop et al., 2016). According to Estrada et al. (2022), approximately 71% of primate taxa worldwide have distributions that overlap with IPLs. Thus, the early involvement of local communities in identifying areas to be protected, while integrating their use of natural resources into effective and sustainable management practices, not only provides positive effects on wildlife conservation but also ensures the long-term support of these communities (Estrada et al., 2022; Wali et al., 2017). It should be noted, however, that while our results revealed a positive effect of PAs on primate diversity, a recent global analysis showed that compared to unprotected areas, PAs were ineffective at reducing human land conversion pressures (Geldmann et al., 2019). In fact, the number of personnel employed by PAs globally, as well as their enforcement capacity, are insufficient for effectively safeguarding these areas and their biodiversity (Appleton et al., 2022). These trends coupled with additional climate change and land conversion projections (Carvalho et al., 2019) underscore the critical urgency with which mitigation measures for conserving primates need to be implemented.
Lastly, we found that trafficking and trade (e.g., in parts and live individuals) are important and unsustainable threats that have increased in recent years (Nijman et al., 2011; Norconk et al., 2020). Primates continue to be traded in large volumes but the effects on wild populations often remain unknown, and what species are traded and in what volumes change over time. Much of this trade is for domestic markets. Thus, in Indonesia, over a 25-year period, Nijman et al. (2017) reported on the trade in ~2500 live primates of 17 species for sale as pets in the animal markets with clear changes over time (e.g., fewer orangutans, more slow lorises). For Liberia, Covey and McGraw (2014) estimated that close to 10,000 primates were traded a year for wildmeat in one district in eastern Liberia, and Fa et al. (2006) estimated that ~150,000 primates were traded a year at 100 sites in Nigeria and Cameroon. Several primates are traded for medicinal purposes, for some species are clearly at unsustainable levels. Nijman et al. (2014) showed that in one market in Myanmar annually ~1000 Bengal slow lorises (Nycticebus bengalensis) were killed and traded for their parts to be used as medicine. While these reports are all from physical markets, the primate trade increasingly has moved online (Nijman et al., 2021; Siriwat et al., 2019), and here also, the effect this trade may have on wild populations (if any) remains unclear.
Primates are also traded internationally, some of them illegally. For example, ~4000 wild-caught night monkeys (Aotus nancymaae, A. vociferans, and A. nigriceps) from Brazil–Colombia–Peru tri-border area were illegally sold to a biomedical research company in 2007–2008 (Maldonado et al., 2009). Much of the international live primate trade involves captive-bred individuals that are mostly bred in countries to which they are not native (Hansen et al., 2022; Nijman et al., 2011).
5 CONCLUSION
Overall, our results show that human-altered landscapes, due to the expansion of road networks, urban areas, CROP, PAST, and human population densities, and the projected uncontrolled future growth of these aforementioned factors, are accelerating the global primate extinction crisis (Chapman & Peres, 2021; Estrada et al., 2017, 2019; Fernández et al., 2022). It is likely that if current deforestation and land conversion trends continue (FAO, 2016), primate species strongly associated with the integrity of forest wildlands may become locally extirpated or even extinct. Alarmingly, IPLs are also at risk due to urban expansion (Kennedy et al., 2022), but those that still persist are uniquely suited to preventing the extirpation of primate-rich areas (Estrada et al., 2022; Fa et al., 2020).
While seemingly dire, our findings provide a unique understanding of how human-altered landscape variables influence primate species richness across global anthromes. To curtail trends, we advocate for community-led PAs and IPLs that integrate the use that local human populations make and need of those habitats, creating sustainable livelihoods (e.g., Bersacola et al., 2023; Eppley et al., 2023), as well as stronger governance to better implement environmental policies on both PAs and unprotected areas, ensuring they provide long-lasting benefits to both, wildlife and people.
ACKNOWLEDGMENTS
We are grateful to the Editor, as well as an anonymous reviewer, for their useful and constructive comments on the manuscript. We are grateful to Wendy Erb for their useful suggestions on an earlier version of the manuscript. We also thank Stephen Garnett for providing the GIS layer for Indigenous Peoples' lands (IPLs). This study was supported by a postdoctoral fellowship from CONAHCyT (Mexico) to E.J.T-R.
CONFLICT OF INTEREST STATEMENT
The authors declare no conflict of interest.
Open Research
DATA AVAILABILITY STATEMENT
All the shapefiles utilized in this article are freely accessible through the IUCN Red List data (www.iucnredlist.org, refer to Section 2). The data that support the findings of this study are available from Dryad at https://doi.org/10.5061/dryad.r7sqv9sjj (Torres-Romero et al., 2023).


