Quantitative assessment of microbial necromass contribution to soil organic matter
Abstract
Soil carbon transformation and sequestration have received significant interest in recent years due to a growing need for quantitating its role in mitigating climate change. Even though our understanding of the nature of soil organic matter has recently been substantially revised, fundamental uncertainty remains about the quantitative importance of microbial necromass as part of persistent organic matter. Addressing this uncertainty has been hampered by the absence of quantitative assessments whether microbial matter makes up the majority of the persistent carbon in soil. Direct quantitation of microbial necromass in soil is very challenging because of an overlapping molecular signature with nonmicrobial organic carbon. Here, we use a comprehensive analysis of existing biomarker amino sugar data published between 1996 and 2018, combined with novel appropriation using an ecological systems approach, elemental carbon–nitrogen stoichiometry, and biomarker scaling, to demonstrate a suit of strategies for quantitating the contribution of microbe-derived carbon to the topsoil organic carbon reservoir in global temperate agricultural, grassland, and forest ecosystems. We show that microbial necromass can make up more than half of soil organic carbon. Hence, we suggest that next-generation field management requires promoting microbial biomass formation and necromass preservation to maintain healthy soils, ecosystems, and climate. Our analyses have important implications for improving current climate and carbon models, and helping develop management practices and policies.
1 INTRODUCTION
Studies of carbon transformation and sequestration in terrestrial ecosystems have received increased interest in recent years due to the growing need for understanding and predicting the global carbon cycle and its role in climate change (Lal, 2004; Lehmann & Kleber, 2015; Schmidt et al., 2011). Globally, soil organic matter (SOM) contains more carbon than that stored in vegetation and atmosphere combined (Ciais et al., 2013; Eswaran, Berg, & Reich, 1993). Hence, soil organic carbon (SOC) plays an important role in global carbon cycling in the Earth system since it serves as the primary conduit for the carbon flux from photosynthesis by plants through heterotrophic mineralization back to the atmosphere. Relatively small changes in global soil carbon storage will therefore have significant impacts on atmospheric CO2 concentration (Chabbi et al., 2017; Davidson & Janssens, 2006; Rustad, Huntington, & Boone, 2000). Because SOC storage is determined by the balance between microbial metabolic activities and carbon input by plant (Janzen, 2015), the mechanistic basis for understanding carbon dynamics in soil relies on understanding of microorganism-mediated processes (Liang, Schimel, & Jastrow, 2017; Schimel & Schaeffer, 2012).
Microorganisms are at the heart of two critical, contrasting mechanisms: not only reducing SOC stocks through mineralization to CO2 but also increasing SOC stocks through the formation of microbial biomass and stabilization of its residues associated with minerals, within soil structures, or by incrustation with, for example, Fe or Si precipitates (Kästner & Miltner, 2018; Lehmann, Kinyangi, & Solomon, 2007; Liang et al., 2017). By now, it is readily accepted that SOC storage is heavily influenced by anabolic activities of microorganisms, emphasizing that the most persistent organic carbon in soil may not be composed of plant litter or their residues but carbon that has first passed through microbial biomass (Benner, 2011; Cotrufo, Wallenstein, Boot, Denef, & Paul, 2013; Liang & Balser, 2011; Lützow et al., 2006; Miltner, Bombach, Schmidt-Brücken, & Kästner, 2012; Figure 1). This consideration is based on the fact that easily degradable and accessible molecules in SOM will be consumed by microorganisms and that even sorbed molecules can be degraded (Miltner et al., 2012; Schmidt et al., 2011). The molecules will then be partly mineralized for gaining energy (catabolism) and partly used for building microbial biomass (anabolism; Kästner & Miltner, 2018; Liang et al., 2017). After cell death and subsequent lysis and fragmentation, several organic cell compounds are still present and contribute, thus, to the pool of microbial necromass. Microbial necromass mainly encompasses particulate organic matter from cell envelope fragments as well as some colloidal former cytosolic matter such as enzymes, ribosomes, and small biopolymers that survived re-utilization by the next microbial generation. However, it is not yet clear to which degree and in what ways microbial necromass is then retained in comparison to plant debris. This apparent conundrum has led to a plethora of relevant research that provided pieces of an emergent understanding centered on microorganisms as actors of SOC stabilization, not only as actors of its mineralization to CO2. For example, calls have been made for the explicit consideration of direct incorporation of microbial remnants into slow-cycling soil carbon pools (Gougoulias, Clark, & Shaw, 2014; Liang et al., 2017; Miltner et al., 2012; Schaeffer, Nannipieri, Kästner, Schmidt, & Botterweck, 2015; Schimel & Schaeffer, 2012; Simpson, Simpson, Smith, & Kelleher, 2007), intriguing conceptual frameworks have been developed for organic carbon cycling in soil (Cotrufo et al., 2013; Fan & Liang, 2015; Liang, Cheng, Wixon, & Balser, 2011; Sokol, Sanderman, & Bradford, 2019; Wieder, Grandy, Kallenbach, & Bonan, 2014), and necessary supporting research and databases on microbial necromass dynamics are emerging (Bradford, Keiser, Davies, Mersmann, & Strickland, 2013; Ding, Liang, Zhang, Yuan, & Han, 2015; Kallenbach, Frey, & Grandy, 2016; Kallenbach, Grandy, Frey, & Diefendorf, 2015; Kindler, Miltner, Richnow, & Kastner, 2006; Kindler, Miltner, Thullner, Richnow, & Kastner, 2009; Liang et al., 2016; Ludwig et al., 2015; Ma et al., 2018; Miltner, Kindler, Knicker, Richnow, & Kastner, 2009; Schweigert, Herrmann, Miltner, Fester, & Kästner, 2015).
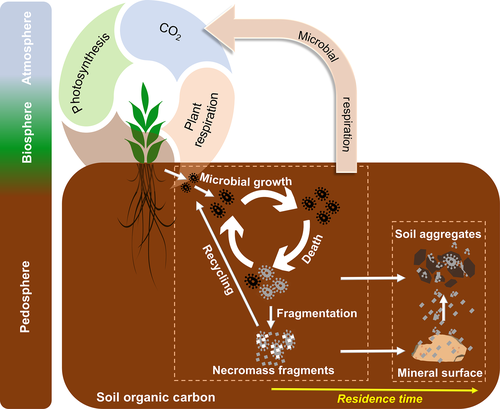
Despite the recognized importance that contributions of microbial necromass to long-lasting SOM may be disproportionately large relative to the living biomass, we are lacking a framework for computing the amount of necromass in SOM. Quantitating the proportion of the total SOC that is microbe derived has significant scientific implications as well as practical value, for example, it is the prerequisite to understanding and parameterizing soil processes in a global context, particularly for broad-scale calculations of global carbon model parameters, and to managing stabilization processes. Here, we focus on the quantitation of microbe-derived necromass in SOM based on available evidence and basic mass relations that hitherto had not been explored, and to compute the contribution for assessment of microbial necromass in global temperate agricultural, grassland, and forest ecosystems. We also develop a strategic framework for the quantitation of microbial necromass in soil that may advance our fundamental knowledge on SOC dynamics as needed to improve the predictive power of climate models and the development of land use policies.
2 PARADIGM SHIFT FOR SOM THEORY
Our understanding of SOM has made great strides over the last decade. Traditionally, the observed progressive decomposition of plant litter elicits the interpretation of SOC storage as residue of plant carbon after humification on its way to CO2. This notion clashes with the emerging evidence that carbon storage is provided by the delicate balance of microbially inaccessible to otherwise easily metabolizable carbon (Cotrufo et al., 2015; Kallenbach et al., 2016). We now recognize that those organic matter forms present in soil that provide the basis for carbon sequestration and fertility in soil, are not the classically defined “humic substances” with uncharacterized structural composition, but instead comprise a myriad of analytically definable structures (Lehmann et al., 2008), which persist in soils mainly because of their local environment and system properties (Kögel-Knabner, 2016; Lehmann & Kleber, 2015). Contrary to traditional views, much of this material may not be partly decomposed plant compounds, but rather compounds metabolized by microorganisms, stored and reprocessed within the microbial food web, and left as necromass (Liang et al., 2017). Most of those organic compounds may, therefore, be comprised of microbial residues and their biomolecular architecture dominated by cell envelopes of dead fungi and bacteria (Miltner et al., 2012); a large pool of dead microorganisms that unfortunately few scientists have attempted to quantitate in a meaningful way. In 2007, Simpson et al. (2007) first raised the question of whether we underestimate microbial biomass in soil and reported that >50% of the alkaline-extracted fraction from a soil may be composed of recognizable contents from microbial cells; however, we have made somewhat limited advances toward the quantitation of soil microbial necromass.
3 MODELING- AND EXPERIMENT-BASED QUANTITATION
Theoretical and empirical work both suggests that microorganisms significantly contribute to the persistent SOC pool through iterative processes of cell generation, population growth, death, decay, and necromass formation. The flow of carbon through microbial pathways in soil has been conceptually modeled to trace the carbon transition process among living microbial biomass, microbial necromass, and atmosphere (Liang et al., 2011), or to explore the extent of how microbial community biomass turnover changes the allocations of SOC that is microbe derived (Fan & Liang, 2015). Accordingly, model simulations showed that the contribution of microbe-derived carbon to SOC at equilibrium steady state may reach up to 82% based on assumed constant litter inputs and restricted literature data as selected for model parameters (Liang et al., 2011); it can range from 47% to 80% based on certain parameters including abundances of fungi and bacteria, turnover of microbial biomass and necromass, and microbial metabolic response to litterfall (synchronous or asynchronous; Fan & Liang, 2015). Thus, modeling studies indicate that microbe-derived carbon drives SOC sequestration, the extent of which can be ecosystem-specific and reflect environmental changes; hence, we urgently advocate for quantitative ecological systems approaches to be considered in future research.
Amino sugar biomarkers have been widely applied to trace the microbial origin of SOC (Amelung, Brodowski, Sandhage-Hofmann, & Bol, 2008; Joergensen, 2018). After the death of the microorganisms, their cell constituents survive their producers, remain, and accumulate. Different microbial groups produce different amino sugars. For example, fungi produce the majority of glucosamine in soil while bacteria produce muramic acid (Amelung et al., 2008; Guggenberger, Frey, Six, Paustian, & Elliott, 1999; Joergensen, 2018), with average conversion factors of 9 and 45, respectively, as suggested for converting glucosamine to fungal-derived carbon and muramic acid to bacterial-derived carbon (Appuhn & Joergensen, 2006). In a recent study assaying amino sugars to evaluate microbe-derived carbon accumulation in a sandy agricultural soil supplemented continuously with farmyard manure and mineral fertilizer (Sradnick, Oltmanns, Raupp, & Joergensen, 2014), the relative contribution of microbe-derived carbon to total SOC was reported to decrease from 68% at 0–0.25 m to 24% at 0.5–1.0 m by use of average conversion factors for converting amino sugars to microbe-derived carbon (Appuhn & Joergensen, 2006). However, such a conversion factor-based strategy for reprocessing existing soil data and assessing the quantitative potential with respect to the contribution of microbial necromass to SOC has not been conducted yet.
4 BASIC MASS RELATIONS IN MICROORGANISMS AND IN SOIL
The contribution of microbial necromass to SOC may also be inferred from elemental carbon–nitrogen stoichiometry based on the distributive pattern of organic nitrogen in microorganisms and in soil. Such an approach may be justified as microbes are reported to constrain their average carbon:nitrogen (C/N) ratio to a relatively narrow range (Cleveland & Liptzin, 2007; Mooshammer, Wanek, Zechmeister-Boltenstern, & Richter, 2014), although it may significantly vary among different ecosystems (Xu, Thornton, & Post, 2013). We thus use mass relations based on N-related measures to calculate the proportional relationship of microbial necromass to soil organic nitrogen, which provides an independent assessment of necromass. Prior studies showed that the total content of soil amino sugar-N in most instances significantly exceeded the total amount of soil microbial biomass-N (Appuhn & Joergensen, 2006; Joergensen, 2018; Joergensen, Mäder, & Fließbach, 2010). In a chronosequence of prolonged rice paddy management, the concentration of nitrogen in soil amino sugars exceeded the nitrogen content in living biomass by a factor of 2 in plots with continuous cultivation of over 190–2,000 years (Roth et al., 2011). The constancy of this factor over such a long period of time suggests that the amino sugar levels roughly mirror an apparent biologic steady state between production and degradation of microbe-derived materials. In general, microbial biomass-N of living microorganisms contributes, on average, about 3% to the total nitrogen pool (Moore, Klose, & Tabatabai, 2000; Wardle, 1992). Using the factor 2 estimating the nitrogen content in microbial residues, there should be 6% of the total nitrogen attributed to soil amino sugar-N at steady state, which is in good agreement with prior research (Kögel-Knabner & Amelung, 2014; Stevenson, 1982). Nevertheless, microbial cell amino sugar-N only constitutes a minor part of live microbial biomass-N, reported as 49 mg/g glucosamine in dry matter of fungal species, 13.9 mg/g muramic acid in gram-positive, and 3.7 mg/g in gram-negative bacterial species (Appuhn & Joergensen, 2006; Joergensen, 2018). The cell peptidoglycan is a polymer consisting of sugars and amino acids that forms a mesh-like layer outside the plasma membrane of most bacteria: in living gram-positive bacterial cells, it can contain six times as much N as cell amino sugar-N, with the peptidoglycan consisting of two units of amino sugar-N and nine units of amino acids among which one is usually lysine containing two N atoms; in contrast, the cell peptidoglycan in living gram-negative bacteria can contain three times as much nitrogen as cell amino sugar-N, with two units of amino sugar-N supplemented by four units of amino acid-N (Schleifer & Kandler, 1972). Furthermore, additional microbial nitrogen may be attached to peptidoglycan such as teichoic acids (Amelung, 2003) and embedded in proteins. Hence, a small fraction of amino sugars in living biomass is associated with much larger fractions of nonamino sugar-N (mainly protein and thus amino acid and nucleic acids) in microbial cells.
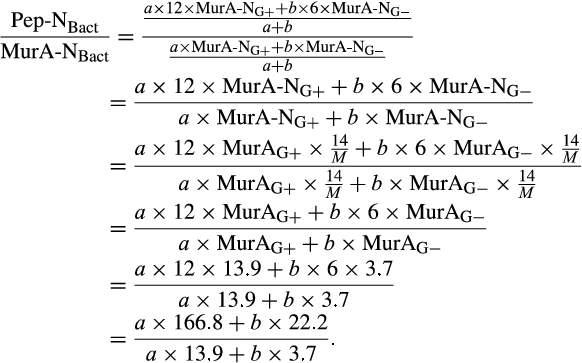
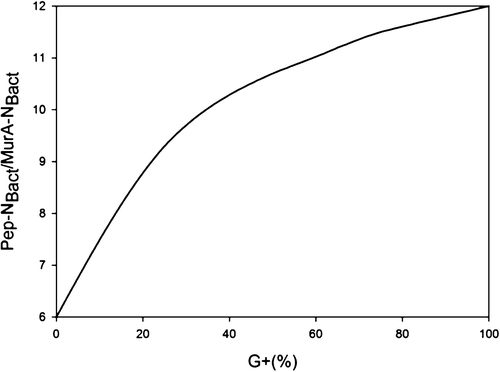
We acknowledge that the relationship of biomarker amino sugars with actual bacterial or fungal mass is variable since the conversion factors contain significant variations for different microorganisms (Appuhn & Joergensen, 2006; Joergensen & Wichern, 2008), yet constitute an appropriate simplification in order to explore a range of microbe-derived carbon to SOM. Using an average share of 65% gram-positive to 35% gram-negative bacteria in soil (Appuhn & Joergensen, 2006), the amount of soil nitrogen preserved in peptidoglycan is around 11.2 times that of muramic acid-N (Box 1). As muramic acid-N in soil samples usually comprises 0.2%–0.5% of total nitrogen (Amelung, Zhang, & Flach, 2006), between 2.2% and 5.6% of the soil nitrogen pool is contained in bacterial peptidoglycan. Since the amount stored in total bacterial residues in soil is much higher than bacterial biomass, by a factor of 4.85 following the conversion factor of 6.67 established for nitrogen (Box 2), approximately 11%–27% of soil nitrogen is bacterial necromass nitrogen. With regard to microbial cells in general, a portion of fungal nitrogen is still unaccounted for. Soils can contain about 5–90 times (Box 3) more nitrogen in glucosamine than in muramic acid (Liang & Balser, 2008; Turrión, Glaser, & Zech, 2002), while in living bacteria this ratio varies from 2 to 8. Taking the factor of 8 for the maximum ratio of glucosamine-N to muramic acid-N in bacteria (Joergensen, Scholle, & Wolters, 1995), as well as of 90 for the maximum ratio of glucosamine-N to muramic acid-N found in soil (Liang & Balser, 2008), the additional glucosamine must stem from fungi, which contain glucosamine as monomers within the chitin cell walls. Since common fungal:bacterial ratios in soil are in the range of 0.5–5 (Bailey, Smith, & Bolton, 2002; Fierer, Jackson, Vilgalys, & Jackson, 2005), and the maximum content of nitrogen in bacterial necromass is 27% (see above), the amount of nitrogen from fungal and bacterial residues, together, may reach between 40.5% and 100% of the soil organic nitrogen pool. If we extend this calculation by speculating that also the average C/N ratio of 6.7 in microbial cells (Jenkinson, 1988; also see Box 2) is sustained during soil necromass formation, and based on an average C/N ratio of soils at 11.5 (Kopittke, Dalal, Finn, & Menzies, 2017), this means that of total SOC the contribution stemming from microbial necromass may range from 23.6% to 58.3%. Alternatively, we may specify this calculation by taking into consideration that the C/N ratio varies between bacterial and fungal biomass. According to Paul and Clark (1996), the average C/N of bacteria is 4 (ranging between 3 and 5) while the average C/N ratio of fungi is 10 (ranging between 4.5 and 15). Following the strategy adopted by Appuhn and Joergensen (2006) and the outline in Box 2, the conversion factor for muramic acid to bacterial residue nitrogen would have to be adjusted from 6.67 to 11 (115/10.3). Following this line, and using again an average living biomass nitrogen in soil at 55 µg/g and an average muramic acid content of 40 µg/g-soil (Appuhn & Joergensen, 2006; Box 2), the average factor for assessing nitrogen in bacterial residues to that in bacterial biomass even rises to 8 (analogous to the calculation process shown in Box 2). In a similar calculation as in the paragraph outlined above, this would lead to a contribution of microbial residue nitrogen to soil organic nitrogen of 27%–100%. Accordingly, based on the average C/N ratio of soils (11.5) and the average C/N ratio of fungi (10) and bacteria (4), we estimate that 23% to 87% of total SOC may stem from fungal necromass, and 9% to 35% of total SOC from bacterial necromass.
BOX 1. Estimating the ratio of peptidoglycan-N to muramic acid-N in bacterial cells
- In gram-positive bacteria cells (G+), peptidoglycan (Pep) contains 12 times more N than muramic acid (MurA); while in gram-negative bacteria cells (G−), Pep contains six times more N than MurA
 therefore


- From Appuhn and Joergensen (2006):
 therefore,
 then,
then,


Then, we combine (1) and (2).



| a (G+) | b (G−) |

|
|---|---|---|
| 0 | 100 | 6.0 |
| 50 | 50 | 10.7 |
| 65 | 35 | 11.2 |
| 100 | 0 | 12.0 |
BOX 2. Estimating the conversion factor for nitrogen in bacterial residues to bacterial biomass in soil
- Assuming that the C/N ratio of the living soil microbial biomass is relatively constant at 6.7 (Jenkinson, 1988), and assuming further that both the bacterial and fungal biomasses contain approximately 46% organic carbon (Appuhn & Joergensen, 2006; Jenkinson, 1988), we calculate both bacterial biomass and fungal biomass to contain approximately 6.87% nitrogen (68.7 mg/g).
- Following the strategy adopted by Appuhn and Joergensen (2006) for the conversion value from amino sugar to microbial residue carbon, we calculate the conversion value from amino sugar to microbial residue nitrogen:
- o Since MurA/Bacteria = 10.3 mg/g, then the conversion value from muramic acid to bacterial residue nitrogen calculates as 68.7/10.3 = 6.67.
- o Since GluN/Fungi = 49 mg/g, then the conversion value from fungal glucosamine to fungal residue nitrogen calculates as 68.7/49 = 1.4.
- The average living microbial biomass nitrogen in soil is estimated at 55 µg/g-soil (table 1 in Appuhn & Joergensen, 2006).
- The average MurA in soil is estimated at 40 µg/g-soil (table 4 in Appuhn & Joergensen, 2006).
- By considering the conversion factor of 6.67 for MurA to bacterial residue nitrogen, the concentration of bacterial residue nitrogen in soil calculates as 40 × 6.67 = 266.8 µg/g-soil.
Therefore, the average factor for nitrogen in bacterial residue to that in bacterial biomass in soil can be calculated as 266.8/55 = 4.85.
BOX 3. Calculation of the ratio GluN-N/MurA-N based on GluN/MurA numbers in the literature


Therefore, the maximum of GluN-N/MurA-N is 91, and the minimum is 5.
5 CONTRIBUTION OF MICROBIAL NECROMASS TO CARBON STORAGE IN TEMPERATE SOIL
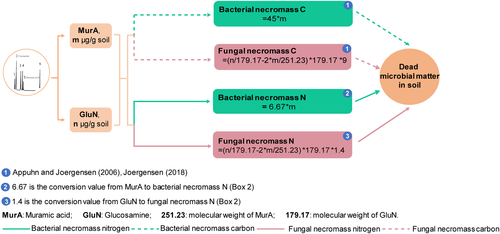
We compiled literature of global agricultural, grassland, and forest ecosystems in temperate zones through existing amino sugar data published between 1996 and 2018, and reprocessed them using the conversion factors of biomarker amino sugars to necromass carbon (Joergensen, 2018). Bacterial necromass carbon was calculated by directly multiplying the concentration of muramic acid by 45, assuming that the bacterial biomass contains 46% organic carbon (Jenkinson, 1988) and the muramic acid in bacteria tissue is 10.3 mg/g-dw based on the proportion of 65% gram-positive to 35% gram-negative bacteria (Appuhn & Joergensen, 2006). Fungal necromass carbon was calculated based on two steps (Appuhn & Joergensen, 2006; Joergensen, 2018): (a) estimating fungal glucosamine by subtracting bacterial glucosamine from total glucosamine, assuming that muramic acid and glucosamine on average occur at a 1-to-2 molar ratio in bacterial cells; and (b) multiplying the concentration of fungal glucosamine by 9. Microbial necromass carbon was approximated as the sum of fungal and bacterial necromass carbon.
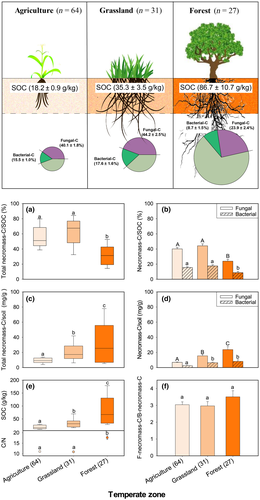
We demonstrate that the contribution of microbial necromass to topsoil organic carbon (<0.25 m) differs by ecotype associated with different vegetation and land use (Figure 2). On average, the contribution of microbial necromass accounts for more than 50% of total SOC for temperate agricultural (55.6%) and grassland soils (61.8%), while it accounts for about 30% in temperate forest soils. The lower contribution of microbial necromass to SOC in temperate forest soils can be explained by a lack of mixing through tillage and dilution effects from the incorporation of surface litter, suggested by significantly higher amounts of SOC in forest (86.7 g/kg) than grassland (35.3 g/kg) and agricultural soils (18.2 g/kg). In addition, the nitrogen limitation in forest soils associated with wide C/N ratios may impede decomposition of plant litters, turnover to microbial biomass, and production of microbial necromass, resulting in the decrease in the mineral-associated organic matter (Colin & Bonnie, 2018; Cotrufo et al., 2013). This demonstrates that the “ex vivo microbial modification pathway” of SOC formation (sensu Liang et al., 2017) with significant contribution by plant litter primarily occurs in temperate forest soils, highlighting the need to use a synthesized framework for understanding SOM cycling (Liang et al., 2017; Sokol et al., 2019). Furthermore, we found that fungal necromass carbon (>70% of total necromass) makes consistently higher contributions to SOC than bacterial necromass carbon (26%–28%) in all three studied ecotypes. The consistently greater proportion of fungi in necromass than of bacteria may point at a greater input of fungal necromass, and not necessarily only its persistence as previously assumed. Phospholipid fatty acid (PLFA) analyses of different ecosystems pointed to fungal:bacterial ratios in living biomass that frequently exceeded the value of one (Bailey et al., 2002). This may be explained by the greater carbon expenditure for biomass production through fungal hyphal growth (Ekblad et al., 2013). Noteworthy, the average ratio of fungal to bacterial contributions to SOC (fungal:bacterial necromass) was largest in the forest soils compared with other ecosystems, which is in line with the observation of Bailey et al. (2002) that SOC sequestration seems to be correlated with high fungal abundance; however, in contrast to that conclusion, the quantitative necromass estimations show that the fungi are not responsible for this, as the overall proportion of microbial necromass is lowest in forest ecosystem (Figure 2b), which highlights that the microbial necromass contribution is not always the most dominant pathway for SOC storage. Furthermore, our analysis shows that the lower amount of soil microbial necromass is associated with a wider average C/N ratio in temperate soils, suggesting substrate quality is a critical factor that affects microbial anabolic role in sequestering carbon belowground. In a N-limited soil with higher C/N ratios, microorganisms require additional nitrogen to meet their growth requirement (Chapin, Matson, & Vitousek, 2011), so a lower microbial growth efficiency and carbon use efficiency will reduce the efficacy for moving carbon derived from microbial anabolism into soil where it can be stabilized.
6 UNCERTAINTIES, CLARIFICATIONS, AND SUGGESTIONS
Direct quantitation of microbial necromass in soil is challenging since it is very difficult to reliably differentiate the carbon in microbial necromass from nonmicrobial organic carbon. A recent study reported the carbon turnover to be related to its molecular size, structure, and composition, determining the microbial contribution to SOC cycling and SOM formation (Malik et al., 2016). For reliable necromass inventory assessment, we currently rely on the use of proxies (e.g., characteristic biomarkers). Recent evidence of relic DNA in nonliving microorganisms indicated at least, on average, a ratio of dead to living organisms of 1:1 (Carini et al., 2016). However, these data show the actual ratio, whereas turnover time of “dead” DNA is required for reliably quantitating the ratio of living to dead biomass. One study found a ratio of 1 living cell per 10 total microbial cells based on protein residues (Nowak, Miltner, Gehre, Schäffer, & Kästner, 2011). Thus, compound-specific turnover data of biomarkers and DNA are needed for the cross validation of any assessment approach. While first data on the turnover of biomarkers have been compiled (Amelung et al., 2008; Schmidt et al., 2011), we still lack a database on turnover rates of both DNA and/or different biomarkers from living biomass in identical soil samples, impeding an effective cross validation.
Here, we provided calculations that indicate a considerable contribution of microbial necromass to SOC, which was reported to be at minimum one order of magnitude higher than the estimations of living microbial biomass (Glaser, Turrion, & Alef, 2004; Guggenberger et al., 1999). Nevertheless, the large variation of microbe-derived necromass based on calculations using the conversion factors for specific microbial biomarker remains challenging. There are three issues to be considered to justify the assumptions. First, there are few free amino sugars in soil, therefore, making hydrolysis/digestion necessary to break down amino sugar polymers for their detection (Amelung, 2001). This means that amino sugars exist in more or less intact cell wall remains. Evidence for this can also be obtained from the observation that the ratio of muramic acid to d-alanine, both present in bacterial peptidoglycan but at different positions, always occurred in a 1:1 ratio, that is, partial peptidoglycan degradation does not occur (Amelung, 2003; Amelung et al., 2008). Second, the molar 1:1 ratio of muramic acid and d-alanine additionally implies that the average composition of peptidoglycan in SOM is more or less constant, despite some potential variation in peptidoglycan types in different microorganisms (Appuhn & Joergensen, 2006; Joergensen & Wichern, 2008; Schleicher & Kandler, 1972), that is, also irrespectively of variations in the proportions of gram-positive and gram-negative bacteria. Hence, we do not consider potential variations in peptidoglycan composition as a main source of error in microbial necromass estimations. In this regard only amino sugar biomarkers and not PLFA, for instance, should be used for microbial necromass variations (the PLFA in turn, are the preferred markers for living microbes). Third, all data we know to convert these values are obtained from living microbes, and in this case this means culturable microorganisms under proper substrate supply. We do not know yet to what degree this conversion calculation may change for microbes under different starvation conditions. Perhaps even more critical, the fraction of soil microbes that are culturable is small compared to the amount identified by DNA analyses (Amman, Ludwig, & Schleifer, 1995). For the latter, conversion factors do not yet exist according to our knowledge. This also serves as an explanation for the large variation in microbe-derived necromass results based on calculations using average conversion factors for amino sugars.
For more appropriate calculations, we need to explore the relationship of biomarkers with total biomass and the turnover rates of these compound classes in various types of soils. Current estimates based on compound-specific isotope analyses suggest a mean residence time of amino sugars in the range of 2–8 years (Derrien & Amelung, 2011). Turnover rates should not be determined with pure compounds but instead in their native bioaggregate association, since the assessment with pure compounds results in severe underestimations of half-lives (Amelung et al., 2008; Carini et al., 2016; Hu, Zheng, Zhang, Noll, & Wanek, 2018) due to a much better availability to microbial degradation (Miltner et al., 2012). In addition, future research needs to further substantiate these calculations by focusing on the conversion of DNA data to microbial necromass contents. Spectroscopic data of various soils indicated that more than 90% of the organic nitrogen in SOM is present in amide bonds, which are presumably derived from protein residues (Knicker, 2011). Miltner et al. (2009) found a much higher persistence of microbial proteins (<90%) in comparison to the bulk microbial carbon (<50%). Thus, proteins may represent a better candidate for estimating microbial necromass than amino sugar and DNA, and future metaproteomic approaches may aid in obtaining the “hidden information” about the phylogenetic origin of protein residues, which may open opportunities for assessing biogenic contributions to SOM.
Although the reliability of the analytical methodology and its applications has been established and justified for some time (review by Amelung, 2001; Joergensen, 2018), we do acknowledge that a wide range of values is expected but will undoubtedly still be valuable. We used three different approaches to estimate microbial necromass in soil. In order to reach a first estimate, our calculations are conservative. When generalizing across different soils which contain different amounts of biomarkers, the range for a specific approach is expected to be large, for example, necromass carbon ranges from 47% to 80% based on modeling simulations and necromass nitrogen from 27% to 100% based on mass relations. It should be noted that despite all uncertainties this is a proportion that is 10–50 times larger than current estimates for living soil biomass. Thus, we cannot neglect that more than half of SOC is contained in microbial residues. This molecular makeup actually determines soil properties, the carbon use efficiency for delivering microbial biomass building blocks, and has a significant impact on soil management recommendations.
7 ACTIONS FOR FUTURE RESEARCH
For a broader community to understand and to be able to quantitate microbial necromass in soil, we streamlined a framework of how to develop quantitative assessments of microbial necromass from amino sugar data (Figure 3). We expect this analytical approach to serve as a thinking model for how to quantitate microbial necromass in soil. Quantitation of microbe-derived SOC has significant implications far beyond soil science: our quantitative analysis is fundamental to improving climate models and the development of land-use policies that maximize urgently needed atmospheric CO2 removal, such as the global 4p1000 initiative (Chabbi et al., 2017). For modeling, we suggest that it is essential to add microbial pathways into current climate and carbon models that may also provide an opportunity to include energy flux considerations. Currently, the most widely used models compatible with Earth System Models do not include microbial biomass amounts as a control on turnover of carbon, and even the emergent microbial models do not distinguish between different pathways of microbial carbon use or different microbial products generated through different microbial metabolism. Our analysis unequivocally demonstrates that microbe-derived carbon in temperate soil in many instances constitutes the majority of SOC storage. Utilizing those values will help correctly parameterize next-generation microbial models, which will aid in linking small-scale to large-scale calculations of carbon dynamics under global and climate change. For land-use policy, our analysis calls for a re-orientation toward microbial carbon management rather than plant inputs alone, which may redirect efforts to preserving microbial necromass carbon within the soil. This is of particular relevance against the backdrop of a future bioeconomy. Aiming at a maintenance of soil fertility for plant productivity, it may thus be inappropriate to simply rely on external organic inputs as commonly assumed. Instead, our data put a spotlight onto policy wisely managing soil microorganisms and their processes rather than only maximizing plant biomass production for soil carbon sequestration. This builds on current recommendations to reduced soil disturbance and preservation of aggregates that encrust this necromass (Figure 1), but will have to go beyond by tackling future water and multiple nutrient needs not only for plant growth (DeLucia et al., 2014; Fay et al., 2015) but also for optimizing microbial necromass formation and preservation. These challenges apply to both the topsoil as well as the subsoil that comprises SOM of much greater degree of decomposition, and thus contain much larger contributions of microbial necromass to total carbon storage than currently assessed for surface soils. Better region-specific estimates are also needed for microbial responses to climate change for making credible policy recommendations and reducing uncertainty. For example, it is likely that warming not only destabilizes microbial necromass causing its significant decline in California grasslands (Liang & Balser, 2012) but may also lead to enhanced necromass storage via stimulating microbial growth and necromass accumulation in high-elevation ecosystems (Ding et al., 2019). The unknown optimum for maximizing global carbon storage likely depends on soil order, proximal climate, the availability of other carbon and nutrient sources, management, and the velocity and efficiency of related C stabilization processes.
8 CONCLUSIONS
Soil ecologists now insist that we cannot afford for microorganisms to be out of mind, even if they are often out of sight. As Darwin (1881) said, the inability to sum up the effects of a continually recurrent cause has often retarded the progress of science. Accordingly, quantitative data are needed to describe the contribution of microbe-derived carbon to SOC storage in natural and managed ecosystems. We expect that the contribution of microbial necromass to SOC may possess a broad range, is ecosystem-specific, and may vary considerably in soils from different latitudes, but the reasons for those are elusive and not fully understood.
Additional studies on soil microbial necromass across all climate regions will be invaluable to enrich our understanding in assessing microbial control over carbon cycles from regional to national, continental, and global scale. We speculate that a relatively minor proportion of microbe-derived SOC may exist in tundra permafrost. In tundra soils, microbial metabolism is limited by harsh environments, such as low temperature or oxygen contents, and microorganisms lack capability to decompose and recycle soil organic materials. In contrast, at other climatic locations, we may encounter highly processed organic matter where SOM is predominantly composed of microbially synthesized materials. Future research should also focus on the persistence of such microbial necromass in various soil environments.
Understanding the very dynamic carbon cycle of living microorganisms in soil provides the basis for understanding the long-term persistence of its necromass with ramifications for controlling atmospheric CO2 and managing agricultural productivity. This is an area that urgently requires more research to improve relevant models and to help develop management practices and policies, especially under the current scenario when microbial processes are starting to be included in modeling (Blaser et al., 2016; Reid, 2012; Wieder, Bonan, & Allison, 2013). Thus, the present work is intended as a proactive call related to the important role of microbial necromass in soil carbon stabilization.
ACKNOWLEDGEMENTS
The work was supported by the National Natural Science Foundation of China (No. 31930070, 41977051) and the Strategic Priority Research Program of the Chinese Academy of Sciences (No. XDB15010303). This work was assisted by attendance as a short-term visitor (C. Liang) at the Helmholtz-Centre for Environmental Research-UFZ in Germany and at Cornell University in the United States. The grants or other support to C. Liang from the Alexander von Humboldt Foundation of Germany and the National Thousand Young Talents Program of China are also acknowledged with gratitude. We thank F. Deng and X. Zhu for compiling the literature and enhancing the visual quality of the figures. We also thank the reviewers for constructive comments that helped to improve the manuscript. Open access funding enabled and organized by Projekt DEAL. [Correction added on 20 November 2020, after first online publication: Projekt Deal funding statement has been added.]


