Network parameters quantify loss of assemblage structure in human-impacted lake ecosystems
Abstract
Lake biodiversity is an incomplete indicator of exogenous forcing insofar as it ignores underlying deformations of community structure. Here, we seek a proxy for deformation in a network of diatom assemblages comprising 452 species in 273 lakes across China. We test predictions from network theory that nodes of similar type will tend to self-organize in an unstressed system to a positively skewed frequency distribution of nodal degree. The empirical data reveal shifts in the frequency distributions of species associations across regions, from positive skew in lakes in west China with a history of low human impacts, to predominantly negative skew amongst lakes in highly disturbed regions in east China. Skew values relate strongly to nutrient loading from agricultural activity and urbanization, as measured by total phosphorus in lake water. Reconstructions through time show that positive skew reduces with temporal intensification of human impacts in the lake and surrounding catchments, and rises as lakes recover from disturbance. Our study illustrates how network parameters can track the loss of aquatic assemblage structure in lakes associated with human pressures.
1 INTRODUCTION
Human activities impact heavily on ecosystem dynamics by reducing species diversity, changing levels of connectivity between species and modifying feedback loops in and between the biotic and abiotic environments (Ives & Carpenter, 2007; Liu et al., 2007; Lyons et al., 2016; Steffen et al., 2011). The capacity for such reconfigurations to absorb exogenous stress while sustaining major functions defines the resilience of a community assemblage to external impact (Folke et al., 2004). Assemblages that face continuous impacts may progressively lose resilience to the point where they cease to sustain ecosystem functions (Scheffer et al., 2012). In real-world systems, information about the current state of system resilience should be central to designing appropriate management strategies, but such information is notoriously difficult to obtain in practice. This intractability raises the risk of ‘creeping normalcy’ where the severity of ecosystem degradation only becomes obvious when the system begins to change state (Scheffer et al., 2012). Much research effort has been expended in the search for early warning signals of declining resilience and tipping points as measured in the frequency domain, such as critical slowing down and flickering (Scheffer et al., 2012). However, these remain contentious (Bauch, Sigdel, Pharaon, & Anand, 2016; Ditlevsen & Johnsen, 2010; Hastings & Wysham, 2010; Kéfi, Dakos, Scheffer, Van Nes, & Rietkerk, 2013) and prove elusive in ecological records constrained by sparse temporal data, high data noise and low resolution (Wang et al., 2012). In contrast, few studies of changes in ecosystem structure have measured the network domain, even though theory predicts that losses of ecosystem resilience should always be associated with structural changes in species associations (Scheffer et al., 2012; Strogatz, 2001).
Network theory provides a framework for hypothesizing the expected structural changes within a stressed system (Griffith, Strutton, & Semmens, 2018; Kay et al., 2018). In general, system interactions between components are represented by self-organizing links amongst nodes of similar type (Dakos & Bascompte, 2014; Gao, Barzel, & Barabási, 2016; Montoya, Pimm, & Solé, 2006; Newman, 2010), for example, documents on the World Wide Web and humans on social media (Amaral, Scala, Barthelemy, & Stanley, 2000; Watts & Strogatz, 1998). For ecosystems, self-organizational mechanisms eventually produce a structure of species associations and links that impart functions and services with more permanence than the compositions of the species assemblages (Grönholm, & Annila, 2007; Mitzenmacher, 2004). The functions and services are maintained by negative feedback controls which together make the ecosystem resilient to exogenous stressors. Ecosystems that are no longer able to absorb stress will show modified structures of species associations and links.
Not all ecological systems present networks likely to have a coherent set of self-organizational rules. For example, food webs generally encompass diverse species functions, and empirical data invariably have uneven representation across trophic levels (Amaral et al., 2000; Jordano, Bascompte, & Olesen, 2003; Montoya & Solé, 2003). Within a single trophic level, nevertheless, the network of species comprising an ecological assemblage may have similar high-level functionality in the form of energy links to the environment and other trophic levels. For this type of system, network theory makes a general prediction applicable to a constant set of boundary conditions: that the system will self-organize to reach the high levels of heterogeneity and structural complexity (Amaral et al., 2000; Barabási & Albert, 1999; Caldarelli, 2007; Watts & Strogatz, 1998). Nodes tend to cluster weakly in terms of having a low-realized fraction of possible connections (Watts & Strogatz, 1998). The frequency distribution of connections consequently shows positive (right-hand) skew, with the majority of nodes having ‘low degree’ (few links to other nodes), and only a small minority of nodes having ‘high degree’ (many links). In some large data sets, such as the World Wide Web, the frequency distribution of the nodal degree may be scale free, as described by a power law, indicating the possibility of preferential attachment processes (Barabási & Albert, 1999). Ecological assemblages often show exponential or log-normal frequency distributions (Dunne, Williams, & Martinez, 2002; Montoya & Solé, 2003), with reduced positive skew, which may reflect viability and saturation effects caused by resource limitation (D'Souza, Borgs, Chayes, Berger, & Kleinberg, 2007). In contrast to ‘bottom-up’ self-organization, ‘top-down’ engineered mechanisms tend to replace weakly connected nodes with strongly connected nodes and the stronger clustering results in a frequency distribution of nodal degree that tends towards negative (left-hand) skew (Albert, Jeong, & Barabási, 2000).
In this study, we argue that human disturbance of aquatic ecosystems through pollution, aquaculture, introduction of new species and water level control usually forces top-down homogenization of ecosystem habitats. The clustering of species to the remaining microhabitats deforms the natural trophic-level network. This loss of structural integrity is a network-level expression of lost assemblage-level resilience to the disturbance. The deformation produces weakly positive or even negatively skewed frequency distributions of nodal degree in the more clustered and less heterogeneous assemblages of species, as found in model networks (Albert et al., 2000). It follows that comparative study of network parameters amongst impacted ecosystems across space and time may provide information about the drivers of structural change, the progressive loss of resilience and stability and the current condition of ecosystem health. Indirect support for this relationship comes from the models of omnivore food webs (Emmerson & Yearsley, 2004) in which weakly interacting species show positively skewed distributions indicative of system stability, and from analyses of community nestedness (Doncaster et al., 2016) revealing an increasing prevalence of strongly connected species under exogenous forcing. No direct empirical evidence has been sought to date, however, for network parameters as proxies for the structural stability and resilience of ecosystems.
We present the first systematic study of a real-world ecosystem to test the hypothesis that exogenous stressors modify the distribution of species associations in a logical and consistent manner. The species used in the study are diatoms, a type of algae with siliceous cells that occupy a single trophic level and respond sensitively to environmental changes, making them a suitable indicator for the status of the whole lake system (Battarbee et al., 2002). Lake diatoms sustain high species diversities, with assemblage compositions that differ between lakes according to subtle differences in their microhabitats defined by environmental gradients (e.g. light, nutrients), submerged macrophytes and substrates. The siliceous cells are well preserved in lake sediments, allowing the study of system structure over long timescales. We use a unique database of modern diatoms from a large set of lakes distributed across China from Tibet to the eastern coast, to measure lake-specific network parameters that describe the associations amongst species. We show how parameters that characterize the frequency distribution of species associations can be used as first-order approximations of the level of stress felt by each assemblage from nutrient loading, as measured by modern concentrations of lake water phosphorus. We test the diagnostic utility of these network parameters by studying temporal changes at five sites where recent cores of dated lake sediments contain fossil diatoms from the past 100–200 years.
2 MATERIALS AND METHODS
2.1 Network conceptualization
We conceptualize an ecological network as a biological assemblage living within an abiotic environment (Figure 1), in which the species and their microhabitats represent separate groups of nodes (Figure 1a). The hypothetical network comprises a large and diverse assemblage of species inhabiting a lake with multiple microhabitats. Species degree is defined for each species by the number of other species with which it shares a microhabitat (Figure 1b). Species are thus associated by virtue of their co-occurrences, which are assumed to issue from sharing microhabitats (Strogatz, 2001). We model a network of non-random associations amongst species that share different microhabitats within lakes.
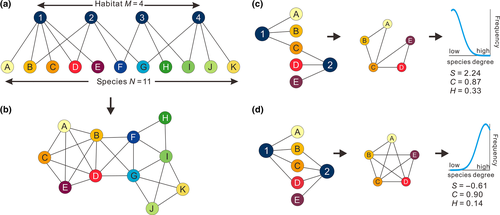
The basic model makes no assumptions about the existence of direct interactions between species, such as competition or facilitation, which are known to be poorly represented by association networks (Barner, Coblentz, Hacker, & Menge, 2018). Although species co-occurrence may be influenced by direct competition, mutualism or commensalism, most non-random co-occurrence in diatoms are likely to arise from co-dependency on environmental features (e.g. water depth) and habitat characteristics (e.g. presence/absence of macrophytes). Thus, diverse microhabitats support a heterogeneous assemblage (Figure 1c) and similar microhabitats support an assemblage occupying similar resource niches (Figure 1d). The network in a heterogeneous environment is characterized by an assemblage of weakly connected species (Figure 1c). A homogenous environment, in contrast, supports clustering of highly connected species (Figure 1d). A shift in boundary conditions caused by exogenous impacts, such as nutrient loading, drives the introduction of new mechanisms, such as positive feedback controls, which modify the clustering of species and consequently the pattern of their degree distribution.
2.2 Outline of methodology
We analyse spatio-temporal changes in the frequency distribution of species associations on a large database of 452 diatom species existing in the surface (modern) sediments of 273 lakes distributed across China. The lakes occupy the Lower Yangtze river basin, the Yunnan-Sichuan Province region and the Tibetan plateau. The strongest impact of human activities across these regions is cultural eutrophication driven by nutrient enrichment from aquaculture, agriculture, deforestation and sewage disposal. As a result, many lakes suffer algal blooms giving rise to turbid water and degraded food webs. For all 452 diatom species occurring in near-modern samples across all 273 lakes, we defined the set of ‘connected pairings’ as the set of most frequently co-occurring species pairs. For each diatom in an assemblage of a single lake, we calculated its species degree from the sum of its connected pairings found in the lake (Figure S1).
For each lake, we calculated three network parameters from its constituent diatoms. Skewness in species degree, S, is the asymmetry in the frequency distribution of co-occurrences between species (showing in Figure 1c,d between positive and negative skew). The heterogeneity index, H, measures the uniformity in the species degree (Gao et al., 2016; May, 2006). The clustering coefficient, C, is the realized fraction of all possible co-occurrences between species linked to a common network (Watts & Strogatz, 1998). The diatom networks for the calculation of these parameters are unweighted, meaning that they account only for the presence/absence of linkages and ignore linkage strength. In order to evaluate the impacts of species abundance on network properties, we also calculated the weighted clustering coefficient (WC) of a hypothetical weighted network. In the weighted network, it is assumed that the pairs of diatoms are directly linked because of species competition for resources. Thus, the linkage from one species to the other linked species is weighted by the species relative abundances. We also developed a null simulation model to test whether similar results are produced through random associations, as opposed to being driven by cultural eutrophication.
Additionally, for five lakes that have contrasting levels of contemporary and historical human impact (Table 1, Supporting Information Appendix – Lake details and Figure S2), we reconstructed the species degree for diatoms preserved in sediment cores covering the past 100–200 years. Across China, the strongest impacts occurred in the 20th century with increasing use of artificial fertilizer and to a lesser extent untreated sewage, associated with a doubling of human population density (Le et al., 2010). We examine the responses of network parameters and diatom richness to the intensity of human impact using: (a) modern population density data; (b) measured concentrations of total phosphorus (TP) in lakes; and (c) the known historical records of disturbance in the five focal lakes (Supporting Information Appendix – lake details).
| Lake | Altitude (m a.s.l.) | Depth (m) | Total phosphorus (mg/L) | Lake area (km2) | Macrophytes | Fishery | Reclamation | Land cover |
|---|---|---|---|---|---|---|---|---|
| Shade | 4,444 | 8.7 | 0.004 | 0.1 | Yes | No | No | Meadow, Shrub |
| Moon | 4,260 | 20 | <0.001 | 0.2 | Sparse | No | No | Meadow, Shrub |
| Erhai | 1,954 | 21 | 0.045 | 250.0 | Yes | Subsistence | No | Forest, Agriculture, Urban |
| Longgan | 15 | 4.6 | 0.051 | 316.0 | Yes | Subsistence | Yes | Urban, Agriculture |
| Taibai | 16 | 3.9 | 0.092 | 25.1 | No | Commercial | Yes | Urban, Agriculture |
2.3 Lake sampling and survey
The 273 investigated lakes represent a wide range of climate zones (humid subtropical, semi-arid and high alpine), altitude (>5,000 m to <50 m above sea level), land use (high mountains, extensive grazing, intensive agriculture), lake type and geomorphological setting (freshwater, brackish, tectonic, oxbow and glacial lakes with some reservoirs) across China. At each lake site, we defined the main catchment land use from field observations and systematic analyses of land-cover maps as urban, intensive grazing or agriculture. Catchments with no significant areas of these land use types were classified as ‘no observable human impact’. Of the 273 lake catchments, 116 had clear evidence of human impact in the catchment, in the form of urban areas, intensive grazing and/or agriculture. Water samples were collected from the surface of each lake for chemical analysis. TP was determined in the laboratory using standard techniques (Institute of Hydrogeography & Engineering Geology, 1990). Short sediment cores were collected from the deepest parts of each lake using a Kajak gravity corer (Supporting Information lake details, Renberg, 1991). The uppermost 0.5 cm of each sediment core was taken as representative of the contemporary diatom assemblages in each lake. Five cores from the selected lakes (Table 1) were sliced in the field at 0.5 or 1 cm intervals (details in Supporting Information) and stored at <4°C until further analysis in the laboratory. Data for samples from the Lower Yangtze basin and the Tibetan plateau are taken from Yang, Anderson, Dong, and Shen (2008), Wang, Yang, Langdon, and Zhang (2011) and Yao (2011). Samples from the Yunnan-Sichuan Province were collected during summers in the period 2007–2012.
2.4 Sediment dating
Sediment ages on older core samples were determined (Appleby, 2002) from the activities of 210Pb, 226Ra and 137Cs radioisotopes measured with gamma spectrometry, using a well-type coaxial low background intrinsic germanium detector (Ortec HP Ge GWL series). Supported 210Pb levels in each sample were assumed to be in equilibrium with the in situ 226Ra, and unsupported 210Pb (210Pbexc) was estimated by subtracting 226Ra activity from the total 210Pb activity. The onset of 137Cs activity (~1954) and peak values (1963) derived from atmospheric nuclear weapon testing were used to validate the 210Pb chronology. The dates of samples were calculated using the constant rate of supply model (Appleby, 2002).
2.5 Diatoms
All diatom sample preparations and identifications were made by authors from the State Key Laboratory of Lake Science and Environment, Nanjing Institute of Geography and Limnology, Chinese Academy of Sciences, using the same set of taxonomic references. Diatom sample preparations followed standard procedures (Battarbee et al., 2002). For surface samples, around 500 diatom valves were counted from each lake except for a few lakes with sparse diatom valves where the count was reduced to ~300 valves. For down-core fossil diatoms, at least 300 valves were counted from each sample. Nomenclature and taxonomy mainly followed Krammer and Lange-Bertalot (1988a, 1988b, 1991a, 1991b, 2000). Only diatoms identifiable to species level were counted, giving a total of 452 diatom species. All identified species, including rare species, were included in the network analyses.
2.6 Diatom network
 , for each pair of species i and species j is quantified by Cramér's V:
 (1)
(1)2.7 Network parameters
 is defined as the sum of its Q3 associations in the assemblage of that lake. For example, a species that shares a lake with three other species with which it frequently co-occurs in the national data set according to the Q3 criterion will have species degree x = 3. Each species in a sediment sample from a lake contributes a value of
  to the species degree vector for that lake. Network skewness is then calculated from the vector by the Fisher–Pearson coefficient (Joanes & Gill, 1998):
 (2)
(2) is degree of species i for Q3 connected pairings in a lake, and
  and n are the mean degree and species richness in the lake. Species with no links were excluded from the network skewness calculations.
Heterogeneity (H) is measured on the frequency distribution of species degree. For an undirected diatom network in a lake, H = σ/<s>, where σ is the standard deviation of the frequency distribution of species degree, and <s> is the average species degree in the network. The calculation of H is modified from Gao et al. (2016) by taking the square root of the numerator to avoid the effects of richness across lakes.
As with the local clustering coefficient (CLC) developed by Watts and Strogatz (1998), the clustering coefficient (C) measures how close each node (species) and its neighbours are to a complete subgraph (i.e. a group of species all of which are linked to each other.) For each species in a lake, the local CLC is the proportion of actual links between its neighbours divided by the number of links that could possibly exist between them. For a whole lake, C is the average of the local CLC of all the species.
The calculation of WC follows Barrat, Coblentz, Hacker and Menge (2004). Given a species A that links to species B, and the relative abundance of A is a% in a lake and the relative abundance of B is b% in the lake, we assume that the link strength from A to B is weighted by a%, and the link strength from B to A is weighted by b%. Thus, for a single lake, we can have a direct network with weighted links by species relative abundance.
2.8 Simulated null distribution
The distribution of associations could feasibly be the product of random processes or naturally occurring species distributions, instead of human impact and nutrient loading. Accordingly, we hypothesize that the distribution of species degree is determined only by the sizes of species pools in the three regions containing sampled lakes. To test the spatial pattern of skewness in the diatom network under this null hypothesis, we randomly assigned species to the same 273 sampled lakes, each retaining its empirical richness. Within each region, all of the lakes had incidence probability for any given species set by the size of its regional species pool as a fraction of the total pool of 452 species. We repeated the simulation 1,000 times and compared the mean of the replications with human population density around each lake.
3 RESULTS
3.1 Trends in network parameters with human impacts
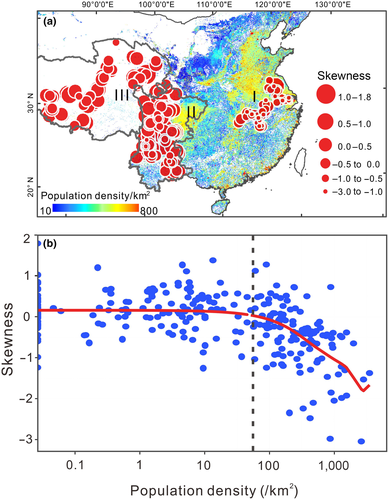
Skewness values of species associations for all lakes range from +1.8 to −3.0 (Table S1), with 53% of all lakes having positive S and 17% having S values ≥+0.5. Broadly, S shifts from positive in the west to negative in the east (Figure 2a). We found no correlation of S with gradients in altitude or temperature (Figure S3). Instead, S links strongly to population density (Figure 2b): being generally positive in sparsely populated regions of the Tibetan plateau and Yunnan-Sichuan Province, and negative in densely populated regions, especially in the Lower Yangtze basin. In a multiple linear regression model (Table S2), only population density influences S (p < .001), with no detectable effects of temperature, elevation or lake size. This result shows that for every 100 people/km2 rise in population size, there is a 0.05 decline in S values. Of the lakes with no observable human impact (no urban, intensive grazing or agriculture) in the catchment, 66% show positive S and 25% show S values above 0.5. Of the lakes with observable human impact in the catchment, in contrast, 25% show positive S and only 5% show S values above 0.5. The tendency for S values to reflect human impact is borne out by a clear negative trend of S with rising human population at densities above 50 people/km2 (Figure 2b).
The other network parameters, C and H, correlate strongly with S and each other, reflecting their measurement of the same overall network response (Figure S4). Skewness has a strong negative correlation with C and a strong positive correlation with heterogeneity H. Values for C and H mirror the spatial pattern of S, with low values for C and high values for H in the less impacted and low population density regions and high values for C and low values for H in the heavily impacted and high-density regions (Figure S5). To simplify presentation, we will focus principally on network skewness (S), and consider C and H as complementary network parameters.
3.2 Trends in network parameters with lake nutrient levels
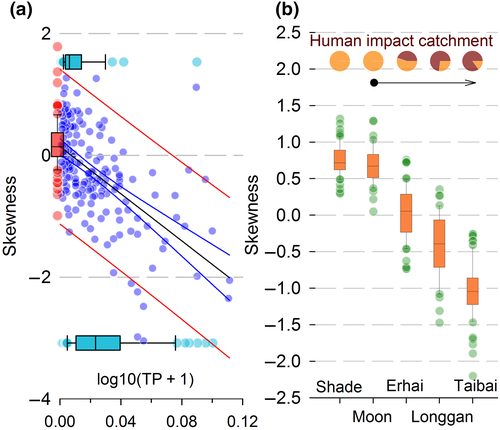
In lakes with observable human impact, S values respond strongly to TP values with positively skewed lakes mainly located below a concentration of 0.031 mg/L (Figure 3). This is consistent with an OECD classification (http://www.eulakes-model.eu/models/oecd.html) of >0.035 mg/L for eutrophic lakes. Even within the higher range of TP values from 0.048 to 0.090 mg/L, lakes with human impacts tend to show lower S values than lakes with no human impact (Figure S6), suggesting that cultural, rather than natural, eutrophication causes low S values. For the five lakes with temporal data covering the past 100+ years, S values become more negative and more variable with higher cumulative levels of human impact (Figure 3b), a pattern repeated for H and C (Figure S7). The network parameters thus reveal more than differences between lakes in levels of modern human impact; they also reflect the accumulation of human impacts on the network structure of a single lake.
3.3 Trends of species richness with human impacts
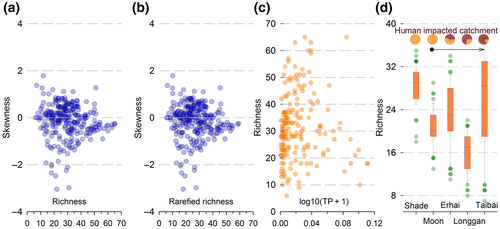
Species richness is easy to measure and its loss has often been used to indicate environment degradation (McCann, 2000). Since richness measures the number of nodes in a network, it may seem reasonable to consider it as an indicator of network structure. In this study, however, the variation between lakes in diatom species richness, from 6 to 65 species, with >15 species in 87% of lakes, shows no correlation with the magnitude or direction of S (Figure 4a,b). Species richness, moreover, has no clear trend with TP, except at very high concentrations (Figure 4c), nor with the gradient of human impact in the five lakes (Figure 4d).
3.4 Other network parameters
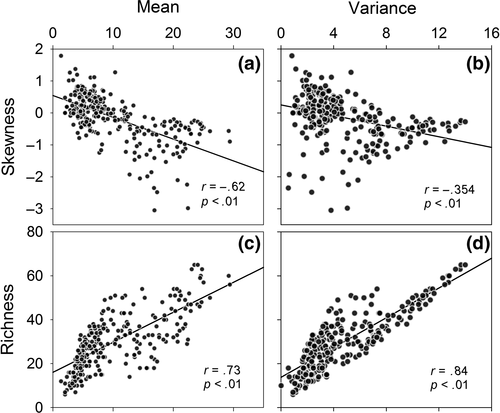
Although network structure depends on additional network parameters including the first two moments of species degree: the mean and variance, they are less informative as measures of human impacts than S, C or H. The mean species degree correlates negatively with network skewness (Figure 5a), making it a candidate as an alternative network parameter. However, both the mean and variance of species degree are strongly influenced by species richness (Figure 5c,d), which is a poor predictor of human impact in this study (Figure 4). Hence, we also expect the same poor predictive power of the mean and variance of species degree. We do not have the same a priori low expectation of the network parameters because they vary independently of richness (Figure 4a). Moreover, S, C and H link explicitly to environmental heterogeneity by definition.
It is possible that environmental forcing could affect the relative abundances of species in an assemblage, which then biases the calculation of network parameters based on species association. However, we reject this possibility after comparing species degree to species relative abundance in the national data set and in each lake. We found no detectable relationship in the national data set (Figure S8), and only 19 of 273 lakes have detectable linear correlations (at p < .05, of which only 3 at p < .01). The network S in an assemblage additionally shows no strong evidence for a relationship with species evenness (Figure S9). We also found that WC shows the same patterns as S and C across the spectrum of human activities given by spatial variation in population size and lake TP level (Figure S10). These results provide evidence for the independence of network parameters as metrics for change in assemblage structure under environmental forcing.
3.5 The effects of V+ criterion on network parameters
We tested whether the observed patterns depend on our choice of Q3 of V+ for defining the threshold for most highly associating species. Alternative thresholds of Q1 and Q2 pairings still show strong correlation between TP and S (Figure S11a,b). Thus, a less stringent criterion for highly associating pairings gives similar spatial patterns. Q1 to Q2 thresholds generate larger sets of connected pairings where some otherwise moderately associated species become classified as strongly associated species. Thus, a Q3 threshold maximizes the discrimination of strongly associated species from moderately and weakly associated species.
3.6 Simulated skewness in the national data set
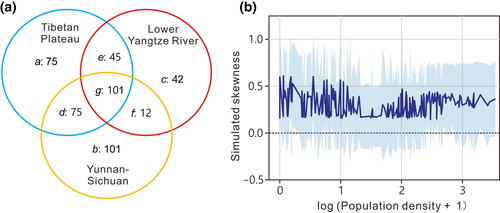
Compared to the empirical data set, the set of associations from the simulated null distributions gave a lower range of S values, from around +1.7 to −0.9, and a much less negative minimum value. Skewness in Q3 of V+ from this null model shows no positive correlation with the S decline observed in the empirical data set (Figure S11c). In contrast to the empirical data (Figure 2b), there was no trend from low population density area to high population density area (Figure 6b). We analysed the distribution of cosmopolitan and endemic species in each region, and found no detectable differences (Figure S12). We therefore find no evidence that the observed S pattern in diatoms across China was due to random species associations. Additionally, we recalculated S using regional, rather than national diatom data sets. For the Yunnan-Sichuan and Lower Yangtze River data sets, the negative relationship persists between S and TP (Figure S13). Taken together, these findings indicate that the network parameter patterns are neither random nor natural.
3.7 Network parameters changes over time
We can explore further the controls on the diatom network parameters by comparing the changes over time with known events in the catchments of the five lakes (Figure 7; Figure S14). Shade (Figure 7a) and Moon (Figure 7b) are isolated alpine lakes (Table 1; Figure S2) with consistently positive S values since the early 1900s (Figure S15a,b). For both lakes, the best-fitting model for the cumulative probability distribution of species degree is a truncated power law, rather than exponential or power law (Figure S16). Although the diatom assemblages may have been affected by distal human activities since the early 1900s, such as increased nitrogen deposition (Hu, Anderson, Yang, & McGowan, 2014), the catchments show no discernible human impacts (Supporting Information Appendix – Lake details). Both lakes had detectable species turnover since the 1800s (Figure S17), but with neither lake expressing a trend over time in network parameters (Figure S17), the changes in species composition appear not to have resulted in any substantial changes in functional composition sufficient to shift the assemblage structure.

In contrast, Lakes Longgan (Figure 7d) and Taibai (Figure 7e) have a long history of reclamation, fishing, polderization and intensive agriculture. Recent (2014) water analyses show Longgan having TP concentrations around 0.050–0.080 mg/L, and profuse macrophytes, while Taibai has higher TP at around 0.180–0.210 mg/L and few macrophytes. The partial recovery of Longgan since the mid-20th century is reflected in gains in low- and middle-degree species (<5) in the two most recent periods (Figure. S15d). The heavily impacted Taibai (Figure S15e) shows the most negatively skewed distributions overall, with fluctuations in negative S (Figure 7) caused by changes in relatively high- (>20) degree species rather than changes in lower degree species. These lakes have network parameters with considerably higher magnitudes, in negative S and two to three times larger values of C (Figure S14d,e), with strengthening trends in recent decades. The generally weaker values for Longgan than Taibai suggest that it might be the less impacted lake. This is borne out by its history of water regulation and protection measures since the 1940s, with no corresponding measures at Taibai (Supporting Information Appendix – Lake details). The higher human impacts in Taibai result in a homogenous diatom network (Figure S14j).
Lake Erhai bridges between the least and most impacted lake pairs (Figure 7c; Figure S14). Its skewness in the early 1900s took positive values commensurate with those of Shade and Moon lakes, and subsequently reduced to negative values similar to those of Longgan lake. The relatively low levels of low-degree (weakly connected) species throughout the 20th century suggests that the lake has been impacted throughout the whole period (Figure S15c). However, the sequence of frequency distributions (Figure S15c) suggests that increasing negative skewness was driven by losses of middle- and high- (>8) degree species, the latter especially after 2001, rather than progressive losses of low-degree species. Likewise, values of C increased through time, and since 2001 reached some of the largest values of any of the lakes. These changes reflect the intensification of human activities through the 20th century culminating in a critical transition from mesotrophic to eutrophic conditions in 2001 (Wang et al., 2012; see also Supporting Information Appendix – Lake details). Network parameters calculated on samples at nearly equal time intervals suggest that variable sediment accumulation rates (e.g. through compaction) do not bias these conclusions (Figure S18).
Network S has a strong negative correlation with C in the three heavily impacted lakes, and a much weaker correlation in the two pristine lakes (Figure S19). This strengthening of the negative correlation in highly impacted lakes is consistent with the general association across all 273 lakes of low and negative values of S with high values of C (Figure S3b). It is also consistent with the extremely high values of C in lake Erhai immediately following a regime shift (Figure S14c) caused by resilience loss (Wang et al., 2012).
4 DISCUSSION
Our principal finding is that the topology of the lake diatom network in China, as measured by network parameters of S, C and H in assemblage structure, responds sensitively to the intensity of human activities in the lake catchment system, both across space (Figure 2) and through time (Figure 7). Our findings concur with other fossil records showing that recent changes in the co-occurrence structure of plant and animal communities can be caused by human activity (Lyons et al., 2016). Additionally, our findings also agree with mathematical experiments on model networks that show structural changes following perturbation tending to shift the nodal degree distribution away from a power law or similar distribution (Albert et al., 2000), which is characterized by high positive S. The empirical deviations of species degree distribution from high positive S are consistent with assemblages being unable to adjust to external stresses without modifying system structure.
From the perspective of bipartite networks between species and biotic environments (Figure 1), these shifts in the network structure parameters are consistent with loss of resource niches and homogenization of microhabitats. Thus, S presents a direct and quantifiable metric for evaluating loss of structural integrity within system networks, and an indirect metric for the loss of resilience to exogenous stresses. High values of C and low values of H in lake ecosystems suggest that the diatom assemblages have low dissimilarity, and thus, are probably already strongly affected by human impacts. For systems such as lakes that readily undergo critical transitions, shifts in network clustering parameters within key assemblages indicate shifts in assemblage stability in response to the modifications of the system ‘architecture’ (Scheffer et al., 2012; Steffen et al., 2011). Future work could usefully evaluate relationships between network parameters and stress in order to develop novel metrics for system resilience to human impacts.
Although external perturbations to ecosystems generally result in a loss of biodiversity (Dudgeon et al., 2006), and high TP appeared to suppress species richness in our system, we could not detect a systematic change in species richness with skewness (Figure 4). The lack of correlation is consistent with previous work showing that diatom species richness can describe system stability only as a correlate of a second parameter that characterizes the network in terms of its compositional disorder (Doncaster et al., 2016). It is also consistent with the general observation that resilience links only weakly to species richness (Mace et al., 2014).
The change from positive to negative skewness in our study is consistent with an ordered sequence of species turnover as resource niches are lost. Nutrient enrichment affects resource niches through increasing diatom species turnover and numbers that, at least initially, engineer a reduction in the number of microhabitats particularly in littoral environments, including reduced light penetration affecting submerged plant macrophytes and the depth of the photic zone, and the more rapid accumulation of organic-rich sediments. In this respect, Hutchinson (1961) observed that it is probably the littoral niche diversity that controls lake niche diversity. Accordingly, one possible sequence of species turnover for which there is some evidence (Doncaster et al., 2016; Figure S15), starts with weakly connected species in a heterogeneous habitat being substituted, or supplemented, by middle-degree connected species competing for more homogeneous resource (Figure S15c). The stronger connections induced by their competitive interactions increase the rigidity of assemblage structure, expressed in a reduction of positive skewness value. As the external stress continues or grows, these ‘keystone’ species continue to accumulate and strengthen their interactions with the declining diversity of niches (Doncaster et al., 2016). Although we are unable to observe niche changes directly in all the Chinese lakes in response to external stressors, the postulate is consistent with ecological theory and with the observed and widespread losses of macrophyte structure during eutrophication.
The increasingly hierarchical connections can be modelled in terms of Lotka–Volterra dynamics of competition for increasingly homogeneous resource (Figure S20). The eventual loss of keystones marks an abrupt transition into eutrophic conditions, with the prevalence of generalist weedy species (Figure S15e) in conditions of reduced density dependence producing negative skewness values. Upon withdrawal of the external stressors, the system recovers greater niche heterogeneity, allowing gains in resource specialists and therefore more weakly connected species, expressed in more positive skew (Figure S15d).
Within the framework of regional safe operating spaces, ‘dangerous’ spaces are defined by a high vulnerability of the aquatic ecosystem to loss of structural integrity under nutrient fluxes (Dearing et al., 2014). On this metric (Table S1), the 22% of human-impacted lakes with positive skewness show relatively stable or ‘safe’ states. The 54% of human-impacted lakes with moderately negative skewness (0 to −1.0) require careful management. The 24% of human-impacted lakes with strongly negative skewness (<−1.0) are showing ‘dangerous’ states, dominated by highly connected species where recovery may present a challenge for management (Zhang, Dearing, Tong, & Hughes, 2016). In sum, over 70% of Chinese lakes merit site-specific plans for catchment management of nutrient fluxes. Although all Chinese lakes fall under local- or national-level protection, the large majority have management plans for regulating fisheries or nutrient inputs that are not directly linked to lake health. Network parameters provide a new quantitative tool suitable for a national-scale monitoring programme.
ACKNOWLEDGEMENTS
The work was supported by the National Key R&D Program of China (2017YFA0605203), the Strategic Priority Research Program of the Chinese Academy of Sciences (XDB31000000), the National Natural Science Foundation of China (NSFC, 41530753, 41621002, 41302277) and the UK Engineering and Physical Sciences Research Council (EP/K503575/1). R.W. acknowledges the financial support of the Youth Innovation Promotion Association of the Chinese Academy of Sciences (2017364). H.Y. acknowledges the support of the Youth Foundation of Anhui University of Technology (QZ201418). We are grateful for comments by T.H.G. Ezard on a previous version.
CONFLICT OF INTEREST
The authors declare no conflict of interest.
AUTHOR CONTRIBUTIONS
R.W., J.A.D., C.P.D., P.G.L., X.Y. and E.Z. designed the research; R.W., X.Y., E.Z., X.D., Z.H., J.S. and Y.Z. performed the fieldwork, R.W., J.A.D., C.P.D., H.Y. and M.X. performed statistical analysis and model simulation; R.W., J.A.D., C.P.D and P.G.L. wrote the paper.


