Legacies of more frequent drought in ponderosa pine across the western United States
Abstract
Despite widespread interest in drought legacies—multiyear impacts of drought on tree growth—the key implication of reported drought legacies remains unaddressed: as impaired growth and slow recovery associated with drought legacies are pervasive across forest ecosystems, what is the impact of more frequent drought conditions? We investigated the assumption that either multiple drought years occurring during a short period (multiyear droughts), or droughts occurring during the recovery period from previous drought (compounded droughts), are detrimental to subsequent growth. There is evidence that drought responses may vary among populations of widespread species, leading us to examine regional differences in responses of the conifer Pinus ponderosa to historic drought frequency in the western United States. More frequent drought conditions incurred additional growth declines and shifts in growth–climate sensitivities in the years following drought relative to single-drought events, with ‘triple-droughts' being worse than ‘double-droughts'. Notably, prediction skill was not strongly reduced when ignoring compounded droughts, a consequence of the temporally comprehensive formulation of our stochastic antecedent model that accounts for the climatic memory of tree growth. We argue that incorporating drought-induced temporal variability in tree growth sensitivities can aid inference gained from statistical models, where more simplistic models could overestimate the severity of drought legacies. We also found regional differences in response to repeated drought, and suggest plastic post-drought sensitivities and climatic memory may represent beneficial physiological adjustments in interior regions. Within-species variability may thus mediate forest responses to increasing drought frequency under future climate change, but experimental approaches using more species are necessary to improve our understanding of the mechanisms that underlie drought legacy effects on tree growth.
1 INTRODUCTION
Forests are key drivers of the terrestrial carbon cycle (Bonan, 2008), and dynamics in forest carbon uptake likely account for a large majority of the terrestrial carbon sink (Pan et al., 2011). The responses of forests to future climatic extremes, particularly drought and drought-related impacts associated with climate change (Marvel et al., 2019), will likely strongly influence the future states of forest carbon storage and fluxes (Reichstein et al., 2013). Particularly in the western United States, despite uncertainties in precipitation projections, drought frequency is expected to increase due to increases in atmospheric moisture demand with rising temperatures (Seager et al., 2007). Warming temperatures will also lead to a greater likelihood of so-called ‘global-change type droughts' (Overpeck, 2013). Mechanistic understanding of tree responses to drought via indirect and direct mechanisms—such as pest outbreaks, hydraulic dysfunction, carbon starvation, and phloem transport limitation (Anderegg, Hicke, et al., 2015; McDowell et al., 2016; Sevanto, McDowell, Dickman, Pangle, & Pockman, 2014; Wiley, Rogers, Hodgkinson, & Landhäusser, 2016)—has greatly improved. Yet, there are still fundamental uncertainties, particularly at regional scales, in how species or population responses to climatic stress may influence variability in forest growth, with evidence for significant variation in drought responses among tree populations (Bradley St Clair & Howe, 2007; Chen, Welsh, & Hamann, 2010; Young et al., 2017).
In particular, legacy effects of drought—multiyear recoveries of trees from drought, due to induced shifts in growth–climate sensitivities—have the potential to decrease the predictability of forest carbon fluxes worldwide (Anderegg, Schwalm, et al., 2015; Kolus et al., 2019; Peltier, Fell, & Ogle, 2016; Schwalm et al., 2017). This has spurred a growing body of research that aims to characterize drought legacies across the globe (Gao et al., 2018; Huang, Wang, Keenan, & Piao, 2018; Jiang et al., 2019; Kannenberg et al., 2018; O'Brien, Ong, & Reynolds, 2017; Serra-Maluquer, Mencuccini, & Martínez-Vilalta, 2018; Wu et al., 2018; Yin & Bauerle, 2017). Mechanisms underlying drought legacies include decreases in active xylem area, loss of root function, deep soil moisture depletion, needle shedding or canopy loss, and changes in the amounts or availability of stored nonstructural carbohydrates (NSC), among others (Adams et al., 2017; Barbaroux & Bréda, 2002; Brodersen & McElrone, 2013; Fritts, 1976; Galiano, Martínez-Vilalta, & Lloret, 2011; Hagedorn et al., 2016; Rempe & Dietrich, 2018; Resco et al., 2009; Sala, Piper, & Hoch, 2010; Sevanto et al., 2014).
Regardless of the ultimate mechanism(s), legacies in observed growth result from detectable changes in the sensitivity of tree growth to climate (e.g., precipitation and/or temperature), and there is evidence that growth–climate plasticity in certain populations is common. For example, conifer species in the southwestern United States rely more heavily on monsoonal precipitation in response to periodic climate variation associated with the El Niño Southern Oscillation (Peltier & Ogle, 2019). Thus, the assumption of many terrestrial ecosystem models that recovery is both immediate and complete (or that growth–climate sensitivities are constant through time) is probably invalid, at least at large scales (Kolus et al., 2019). Furthermore, induced changes in growth–climate sensitivities have been shown to vary across space within conifer species such as Pinus ponderosa, suggesting the need to consider variation among populations (Anderegg, Schwalm, et al., 2015; McCullough, Davis, & Williams, 2017; Peltier & Ogle, 2019). While tree rings cannot be used to estimate carbon fluxes directly due to both historic sampling design of available datasets focusing on climate sensitive trees (Klesse et al., 2018; Nehrbass-Ahles et al., 2014) and the complexity of terrestrial net ecosystem exchange (Babst et al., 2014), they can provide directional information on the major drivers of forest net primary productivity (Babst et al., 2019), with strong implications for overall fluxes.
One of the major uncertainties revealed by recent tree ring and eddy flux tower syntheses is the effect that more frequent drought conditions occurring over relatively short timespans may have on tree growth. Compounded disturbances may have unexpected results at the ecosystem scale (Paine, Tegner, & Johnson, 1998), and impacts are often negative for impacted ecological communities (Hughes et al., 2019). Droughts are extreme climate events, and as such are intrinsically rare, with compounded droughts being even rarer. Yet, under a warming climate, more frequent droughts are expected. That is, it is increasingly likely that droughts will occur for multiple consecutive years or, similarly, droughts will occur during the period from which an ecosystem or tree is recovering from a previous drought (Williams et al., 2013), with unknown (but presumably detrimental) impacts on tree growth (Anderegg, Schwalm, et al., 2015; Schwalm et al., 2017). In the western United States, forested ecosystems are now subject to unusually severe drought conditions, which can persist for multiple years (Griffin & Anchukaitis, 2014) and are likely to continue to become more common (Williams et al., 2013). More frequent drought conditions will likely increase mortality risk (Allen, Breshears, & McDowell, 2015; Allen et al., 2010), but what about the physiological impacts on surviving individuals? Findings of cavitation fatigue in certain angiosperms suggest trees still recovering from drought may experience increased levels of cavitation during a second drought (Sperry, Perry, & Sullivan, 1991), although it is unclear if this dynamic applies in gymnosperms. Low NSC concentrations following drought may limit trees' capacity for osmotic adjustment, a component of drought tolerance (Bartlett, Scoffoni, & Sack, 2012; Mencuccini, Hölttä, Sevanto, & Nikinmaa, 2013). Additional drought stress may also push NSC reserves closer to posited ‘critical' levels, further slowing recovery, limiting replenishment of functional xylem conducting area (Trugman et al., 2018), and increasing subsequent vulnerability to insect pests (Wiley et al., 2016). In short, the effect of repeated and/or longer droughts and shortening mean drought return intervals on growth in the coming years represents a major uncertainty in predictions of tree growth, forest productivity, and carbon cycling.
To quantify the legacies of more frequent drought conditions, as well as the variation in legacy effects across a species' range, we applied a stochastic antecedent model (SAM; Ogle et al., 2015; Peltier, Barber, & Ogle, 2018) to all available P. ponderosa (ponderosa) ring widths in the contiguous United States, obtained from the International Tree Ring Data Bank (ITRDB). The SAM framework is a statistical approach to describing the temporal complexity of tree growth responses to climate variability. In particular, the approach quantifies how past climate conditions continue to impact observed tree growth for multiple months or years after those conditions have passed (Peltier et al., 2018). As multiyear droughts and compounded droughts are uncommon extremes, the long-time series nature of the ITRDB tree-ring records represents a valuable data source from which to learn about impacts of such drought conditions on tree growth. For simplicity and brevity, we subsequently refer to both multiyear droughts and the case of multiple drought events occurring in a short period (say, separated by a wet year) as compounded drought, noting the difference is somewhat semantic, as both entail drought conditions occurring during the potential recovery period from a previous drought year. By selecting severe drought years in the last century and categorizing years in the record according to the number of drought years that have occurred during the past 4 years, we asked: (a) Compared to single droughts, what is the impact of compounded drought on tree growth, as expressed in tree-ring widths? (b) Compared to single droughts, are there additional legacy effects on climatic sensitivities of growth when two or three drought years have occurred in the last 5 years? Finally, (c) how does ignoring the impacts of compounded drought (on ring width and climate sensitivity) effect ring width (growth) predictions across the range of a widespread tree species in the western United States? Improved understanding of the impacts of repeated drought in short time periods, and how this may differ across space within a species could contribute to improved predictions of terrestrial carbon fluxes in the western United States under continuing climate change (Kolus et al., 2019).
2 MATERIALS AND METHODS
2.1 Data sources
All available ring-width data for P. ponderosa Dougl. Ex. Laws. from the ITRDB in the United States were downloaded in early 2016 (N ≅ 517,149 individual rings) for this analysis. Observations prior to 1898 were retained for use in detrending (see Section 2.2) but were discarded prior to analysis due to the lack of contemporaneous climate data. For each of the 219 ITRDB sites, monthly precipitation and mean temperature (4 km resolution) were obtained from the PRISM Climate Group at Oregon State University (http://prism.oregonstate.edu, 2017) via the ‘prism' package (Hart & Bell, 2017), matched by location in R (R Core Team, 2019). We also obtained self-calibrating Palmer Drought Severity Index (PDSI) from the West Wide Drought Tracker (Abatzoglou, McEvoy, & Redmond, 2017), a product derived from PRISM precipitation and temperature data at the same spatial resolution. This product has been successfully used in other tree-ring modeling applications (Peltier & Ogle, 2019). We use PDSI as a covariate in our model(s) for ring widths, and as PDSI is derived from the PRISM data, it is equivalent to an interaction between precipitation and (negative) temperature (see Section 2.4 for additional details and Peltier & Ogle, 2019). Independently derived PDSI data at coarser spatial resolution (Dai, Trenberth, & Qian, 2004) have previously been used to successfully model P. ponderosa ring widths in the southwestern United States (Peltier et al., 2018). We note inference regarding mortality risk in not possible with the ITRDB dataset given that individual trees survived the droughts in the record.
2.2 Detrending and chronology construction
To account for (or ‘remove') size and age trends in tree growth, and because it was computationally infeasible to directly use ring-level data in the model, we detrended for age prior to the analysis. We fit an age model (modified negative exponential or flat line) to each core via the R package dplR (Bunn, 2008), divided each ring width by the fitted function to produce an index, and averaged the index across rings within sites to produce site-level chronologies. All other trends are considered ‘ecological', or at least, unrelated to age. This is standard practice in dendrochronology (Fritts & Swetnam, 1989), and we have successfully used this approach before (Peltier & Ogle, 2019). This resulted in 221 site-level chronologies and 19,272 ring-width indices (‘RWI'). Chronologies were classified into three regions (Figure 1) corresponding to the geographic distribution of groups of P. ponderosa subspecies (Callaham, 2013; Little, 1971; Willyard et al., 2017), approximately corresponding to the Southwest (Arizona and New Mexico; ‘SW'; ssp. brachyptera and perhaps ssp. arizonica), Intermountain West (Utah, Colorado, Wyoming, Montana, Eastern Idaho, Dakotas; ‘IM'; ssp. scopulorum), and the Pacific Northwest and West Coast (northern California, Oregon, Washington, western Idaho; ‘NW'; ssp. ponderosa and ssp. benthamiana). The SW and IM regions fall within what is often referred to as the ‘interior' variety of P. ponderosa, while the NW region falls within the ‘western' variety (Norris, Jackson, & Betancourt, 2006).

2.3 Drought selection
For each site, we defined hydrologic years (October–September) having less than 5th percentile site-level mean annual PDSI as droughts. While we could have defined droughts as years with PDSI less than some threshold (e.g., −2), our approach avoids relying on regional scaling to characterize site-level extremes, because unusually dry conditions are estimated based on the historic PDSI conditions at each site. For each year in the record, we then tallied the number of drought events occurring in the 4 years previous to and including the water year of interest (window of 5 years). There were 5,420 site-years in the record with a single drought during the 5-year window, 1,873 with two (‘double-droughts'), and 883 with three (‘triple-droughts'). This information is presented graphically in black shading beneath each of Figure 4a–c. To evaluate consistency with a previous study (Anderegg, Schwalm, et al., 2015), we also estimated the response of P. ponderosa RWI to July PDSI (best single predictor according to R2) with a classical linear regression and calculated the average legacy effect (observed-predicted RWI) for the 4 years following each drought (hereafter, the ‘single-predictor model').
2.4 Model description
To investigate the potential impacts of compounded drought and changes in growth–climate sensitivities due to associated drought legacies, we constructed a novel model based upon the SAM framework (Ogle et al., 2015). This framework has been applied to a number of problems (Dal Bello, Rindi, & Benedetti-Cecchi, 2017; Guo & Ogle, 2019; Ogle et al., 2015; Ryan et al., 2017, 2015), including applications to tree-ring chronologies (Peltier et al., 2018; Peltier & Ogle, 2019). For a detailed description of the SAM model as applied to tree-ring data, see Peltier et al. (2018). The model implemented here is akin to a linear regression of tree-ring widths on climate variables. The climate variables are weighted averages of past, monthly climate values over a 5-year period, except the weights themselves are treated as unknown parameters. We then allow for different intercepts, climate effects, and weights for non-drought and drought years, enabling us to compare ring width responses to climate when different numbers of drought years have occurred during the preceding four years.
 (1)
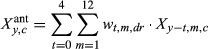
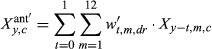
(1)Effects include the intercept and an autoregressive term for prior year RWI (RWIy−1,c) (α terms), and climate effects (β terms) that describe the sensitivities of RWI to antecedent climate covariates, including precipitation (Pant), temperature (Tant), and PDSI (Dant), and the two one-way interactions of Pant × Dant and Tant × Dant. Recall the PDSI data product used here (Abatzoglou et al., 2017) is somewhat equivalent to an interaction between precipitation and (negative) temperature; hence, we do not explicitly include a Pant × Tant interaction. During initial model development, we also found that incorporation of a Dant effect led to better MCMC behavior, including improved convergence of the MCMC chains (see Section 2.4.2, below), relative to models that included a Pant × Tant interaction. We suggest this could arise because PDSI is inherently lagged, and this helps prevent identifiability issues among antecedent importance weights (described below) for precipitation and temperature. We also note that incorporation of the Pant × Dant and Tant × Dant interactions allows evaluation of nonlinearity in the responses of tree-ring widths to precipitation and temperature (e.g., saturating effects), though in past applications, these effects have been small (Peltier et al., 2018; Peltier & Ogle, 2019).
 , is calculated as:
 (2)
(2)The wt,m,dr are constrained to sum to 1 across all t and m for a given dr, so they are interpreted as the relative importance of climate during a given month for a given climate covariate (P, T, or D; see Section 2.4.1). As in Peltier et al. (2018), the resolution of the weights declines with time into - the past; that is, while we estimate 24 unique weights for the most recent 2 years (24 months), we estimate only six unique weights for 2 years prior to ring formation (i.e., January and February weights are equal, etc.), and four unique weights in each of the third and fourth years prior to ring formation (i.e., January, February, and March weights are equal, etc.; Peltier et al., 2018). We also assume October, November, and December weights in the year of ring formation are equal to zero as this is after the conclusion of the growing season, and hence, climate conditions during this period are assumed to have no effect on growth during the corresponding year.
We also quantify the length of climatic memory as either the number of months back in time required to achieve 50% (M50) or 75% (M75) of the total, cumulative importance of climate for growth. That is, M50 and M75 are number of months into the past at which the cumulative weight first exceeds 0.5 or 0.75, respectively. The cumulative weights are obtained by summing the individual, monthly weights, wt,m,dr, from December of the current year of growth (y = 0) up to each month into the past, akin to a cumulative probability. For example, if the sum of the wt,m,dr (summed over all m) for the year of ring formation (y = 0) and the year prior to ring formation (y = 1) was 0.5, then M50 = 24 months for example. Since we estimated unique wt,m,dr for drought (dr = 1) and non-drought years (dr = 0), this also allowed us to compare the climatic memory between these two types of climatic conditions.
2.4.1 Prior specification
For each region, the model defined in Equations (1) and (2) was implemented in a hierarchical Bayesian framework. The site-level antecedent climate effects (β's) were given hierarchical normal priors that varied around region-level means with region-level variances, for each level of d representing the number of recent droughts. Each of these region-level means were also given hierarchical normal priors that varied around global means (i.e., across d), with diffuse normal priors assigned to the global means. The site-level intercept and autoregressive effect (α's) were modeled identically except that they did not vary with d (i.e., single intercept and autoregressive term for each site c). The antecedent importance weights (w's) were assigned relatively noninformative Dirichlet priors for each ‘group' of monthly weights (grouped by dr) such that the sum of all weights—across all months, m, and years, y, for each level of dr, for a given climate covariate—is exactly 1 (see Peltier et al., 2018 for more details). The model was applied separately for each region such that all parameters varied by region. The full model code is provided in Appendix S1.
2.4.2 Implementation
The model was fit in JAGS 4.0.0 (Plummer, 2003) via the R (R Core Team, 2019) package rjags (Plummer, 2013). The posterior parameter space was sampled via Markov chain Monte Carlo (MCMC) techniques, and three MCMC chains were run in parallel on a high performance super-computing cluster. All stochastic parameters were monitored until convergence was achieved (>100,000 iterations), at which point the model was updated for another 100,000 iterations per chain. This produced a posterior sample of ≥3,000 relatively independent samples after thinning the chains.
2.4.3 Prediction scenarios
To understand how differences in climate sensitivities associated with drought legacies may effect RWI predictions, we first evaluated model fit (as coefficients of determination, R2, obtained from a regression of replicated vs. observed RWI) of the full model (‘Full'), where the full model is described by Equations (1) and (2). We then used the posterior samples of all parameters to evaluate the fit of two additional ‘models' (prediction scenarios) that ignore either legacy effects (‘NoL'), or ignore compounded legacies (‘NoCL'; see Table 1). These models were not fit to the data, rather replicated RWI was predicted using incomplete sets of parameter values obtained from the full model's posterior distribution. This allowed us to evaluate the impact of ignoring certain parameters describing various types of drought legacies on predicted RWI. The NoL scenario used only the climate effects (β's) and importance weights (w's) estimated for periods defined by no recent droughts (d = dr = 0) to predict RWI across all site-years (Table 1). The NoCL scenario used only two groups of β's and w's, the ones representing no recent droughts (d = dr = 0), and those representing the ‘single-drought' scenario (d = dr = 1); the ‘single-drought' values were applied when any number of droughts had occurred in the previous 4 years (i.e., for d = 1, 2, or 3; Table 1). Recall we did not estimate unique weights (w's) for d = 1, 2, and 3, but only assumed a single set of ‘drought' w's (dr = 1) when d = 1, 2, or 3; thus, only the values of the β's differ between the Full and NoCL scenarios. All models use the same intercept and autoregressive parameters (α's) since these parameters do not differ by d or dr.
| Scenario | Equation | Description |
|---|---|---|
| Models fit to data | ||
| Full |
where |
As described in Equations 1 and 2 |
| Full2 |
where |
Same as Full model, but antecedent lag is only 24 months (t = 0 and 1, representing year of ring formation and year prior) |


| Scenario | Parameters used in scenarios | Description |
|---|---|---|
| Prediction scenarios | ||
| NoL |
αc,k; for k = 1, 2
|
Predict all years with ‘no-drought' parameters from Full model |
| NoCL |
αc,k; for k = 1, 2
|
Predict all years with either ‘no-drought' or ‘single-drought' parameters from Full model |
| NoL2 |
|
Predict all years with ‘no-drought' parameters (similar to NoL scenario), except with parameters from Full2 model |
 ; for k = 1, 2, …, 5, and where d* = 0 if d = 0, 1, 2, or 3
 ; where dr* = 0 if dr = 0 or 1
 ; for k = 1, 2, …, 5, and where d* = 0 if d = 0 or d* = 1 if d = 1, 2, or 3
 ; for k = 1, 2
 ; for k = 1, 2, …, 5, and where d* = 0 if d = 0, 1, 2, or 3
 ; where dr* = 0 if dr = 0 or 1
Finally, drought legacy effects may be partially explained by how tree growth responds to the cumulative effects of climate experienced over the past 4 years, as captured by the SAM definition of the antecedent climate variables (Peltier et al., 2018), regardless of whether or not a drought occurred during that period. Thus, to explore the effect of using the SAM model to learn about legacy effects, an additional model was fit to the data (‘Full2') that was identical to the aforementioned Full model (and new parameters were estimated), except the antecedent weights were only estimated for the previous 24 months (Table 1), representing the year of ring formation and the prior year. This approach is more similar to non-SAM modeling approaches that only consider the effects of climate during the year of ring formation and during the year prior to ring formation. Then, identically to above, we evaluated the fit of a no legacies model (prediction scenario) when antecedent climate was modeled for this shorter lag period of 2 years (‘NoL2').
3 RESULTS
Differences between observed and predicted growth from the single-predictor model following single droughts (Figure 2a, see Section 2.3) are comparable to those reported by Anderegg, Schwalm, et al. (2015) for both Pinaceae and sensitive sites across all species. Repeated droughts further reduced ring widths for all three regions (Figure 2b). Reductions tended to be greatest in the SW and similar in the IM and NW regions. Mean reductions from three recent droughts were 21% in the NW and 25% in the IM. Notably, mean reductions from three recent droughts in the SW were nearly 40%, but much larger reductions were possible under ‘triple-droughts' in this region (note standard deviations, Figure 2b).

The fit of the full model was fairly high, with region-specific coefficients of determination (R2) of 0.68 (SW), 0.56 (IM), and 0.70 (NW). Unexplained variability is likely due to unaccounted for variation in memory (e.g., antecedent climate weights are estimated at the regional level, not site level, representing regional averages in memory), particularly across the large area contained within the IM region (Figure S1). (Antecedent importance weights are reported in Figure S1.) Residual variation could also reflect relatively coarse (gridded) climate data that imperfectly capture site-level conditions. First-order autocorrelation (αc,2, Equation 1) was highest in the NW (0.65 ± 0.01; posterior mean ± SD), compared to the other two regions (IM: 0.39 ± 0.01 and SW: 0.46 ± 0.01), and the intercept was the lowest for the NW (NW: 0.35 ± 0.01, compared with IM: 0.62 ± 0.01 and SW: 0.58 ± 0.01).
Repeated droughts incur additional changes in climate response over single-drought events in all three regions, with convergent changes in precipitation sensitivity (Figure 3a), but divergent changes in temperature sensitivity (Figure 3b). When there have been no recent droughts (d = 0), all three regions respond positively to precipitation (Figure 3a), negatively to temperature and PDSI (Figure 3b,c), and negatively to the Pant × Dant interaction (though magnitudes may strongly differ, Figure 3d). A negative PDSI effect is consistent with our previous work that analyzed a subset of these climate and tree-ring datasets using a similar modeling framework (Peltier & Ogle, 2019). Since this covariate is analogous to a precipitation by (negative) temperature interaction, the negative PDSI effects simply reflect greater sensitivity of ring width to precipitation when it is warm (that is, when ‘negative temperature' is low) (Peltier & Ogle, 2019).

Different P. ponderosa regions, however, show different responses to compounded drought, with the NW responding differently than either the SW or IM. In the SW and IM, sensitivity to precipitation is reduced by drought, and the reduction is greatest with more (two or three) recent droughts, while temperature sensitivity is more negative and variable (Figure 3a,b). In the NW, precipitation sensitivity is less strongly influenced by drought in general, while temperature sensitivity changes from negative to not different from zero or even slightly positive under increased drought frequency (Figure 3a,b). The PDSI effect is similar across drought types in the SW and IM, but it becomes nonsignificant with more (two or three) recent droughts in the NW (Figure 3c). The Pant × Dant interactions are small, but relatively similar across numbers of recent droughts for the SW and IM, but in the NW changes sign from single (negative) to compound (positive) droughts (Figure 3d). The Tant × Dant interactions are also small, mostly not significant, and relatively similar across all regions, but of largest magnitude (negative) for single-drought years in the SW and NW (Figure 3e). These interactions suggest nonlinear responses to precipitation regardless of drought conditions, and a mostly linear response to temperature except following single droughts.
Prediction scenarios that ignore drought legacies (NoL and NoCL) agree with the full model (Full) and observed RWI during non-drought periods, but tend toward systematic prediction errors during drought periods. However, the direction (over- vs. underpredict) and magnitude of this error varies by region and scenario (Figure 4a–c and inset text). In certain years, mean predictions from the different prediction scenarios approach the limits of the 95% credible intervals of the full model predictions, typically during periods of widespread drought. In the SW and IM, on average, prediction scenarios ignoring drought legacies consistently underestimate RWI (Figure 4a,b; Figure S2), while in the NW, they tend to overestimate RWI (Figure 4c; Figure S2). Notably, the prediction scenario that ignores compounded drought legacies (NoCL) has only slightly diminished R2 (difference of ~0.015) compared to the full model across all regions (Figure 4d–f). Error in the NoL2 scenario was always in the same direction (under- vs. overpredict) as the NoL and NoCL scenarios in a given region, but performed worse than the NoL scenario in the SW (lower R2), comparatively in the IM, and better in the NW (higher R2, Figure 4).

Climatic memory was strongly influenced by drought in the SW and IM, with the largest shifts in the memory (particularly M75) of antecedent temperature and PDSI conditions (Table 2). Though, while the direction of change—shortening or lengthening of memory during drought periods—varied across subspecies, the magnitude of change somewhat aligned with regional differences in prediction error among prediction scenarios. In the SW, for example, precipitation and PDSI conditions experienced further into the past (M75 was 12 and 20 months, respectively, longer during drought periods) were more important during drought years (Table 2). In contrast, in the IM, drought conditions led to large shifts in importance to more recent temperature and PDSI conditions (M75 was 31 and 23 months, respectively, shorter during drought periods). Thus, in these two regions (SW and IM), there were shifts in the M75 of single climate covariates of up to nearly 2–3 years in response to drought(s). In the NW, as in the SW, less recent PDSI conditions were more important during drought years, but this shift was comparatively small (at most 9 months, Table 2).
| Covariate | SW | IM | NW | |||
|---|---|---|---|---|---|---|
| dr = 0/1 | δ | dr = 0/1 | δ | dr = 0/1 | δ | |
| P ant | ||||||
| M 50 | 13/13 | 0 | 14/14 | 0 | 17/16 | 1 |
| M 75 | 22/34 | −12 | 26/25 | 1 | 29/31 | −2 |
| T ant | ||||||
| M 50 | 16/15 | 1 | 39/15 | 24 | 20/20 | 0 |
| M 75 | 40/37 | 3 | 45/29 | 31 | 45/49 | −4 |
| D ant | ||||||
| M 50 | 10/13 | −3 | 27/15 | 12 | 17/26 | −7 |
| M 75 | 13/33 | −20 | 47/24 | 23 | 26/35 | −9 |
4 DISCUSSION
4.1 Impacts of compounded drought
Consistent with interpretation that drought legacies result from physiological impairment caused by drought-induced water stress (Anderegg, Schwalm, et al., 2015; Peltier et al., 2016), compounded drought resulted in additional decreases in average ring width and changes in growth–climate sensitivities in all three P. ponderosa regions (Figure 2b). Underlying causes of drought legacies are potentially numerous, but major mechanisms likely include induced hydraulic dysfunction (cavitation) and reduced NSC stores, which combine to limit post-drought growth due to slow recovery of water transport capacity and associated carbon gain (Trugman et al., 2018). Drought during the recovery period likely further reduces NSC stores if photosynthetic carbon gain is also impaired (West, Hultine, Jackson, & Ehleringer, 2007; Williams & Ehleringer, 2000), and may further reduce stem conductance if trees experience additional xylem cavitation or production of new sapwood is limited (Plaut et al., 2013; Resco et al., 2009); any of these mechanisms would lead to reduced post-drought growth and longer recovery times.
Consistent with hydraulic damage or NSC depletion, decreased precipitation sensitivity with more recent droughts in the SW and IM regions suggests trees are unable to effectively respond to favorable post-drought conditions (Figure 3a). Similarly, simultaneous increases in the magnitude of the temperature sensitivity of growth (i.e., more negative effects) suggest either a more conservative water-use strategy or greater hydraulic impairment under warmer drought in SW and IM populations of P. ponderosa (Figure 3). While angiosperms may experience cumulative cavitation fatigue (Anderegg et al., 2013), in conifers, decreased lumen diameter of tracheids following drought may reduce conducting capacity preceding dieback (Pellizzari, Camarero, Gazol, Sangüesa-Barreda, & Carrer, 2016), and hydraulic segmentation may limit the response of trees to moisture pulses following hydraulic impairment of organs with higher resistance (Plaut et al., 2013). Damaged needles following drought would also likely reduce post-drought growth and limit recovery in conifers with multiyear needle crops (Fritts, 1976; Galiano et al., 2011). If defoliation reduces canopy area to conductive sapwood area (‘hydraulic architecture'), this could improve water status in the short term, but reduce capacity to benefit from subsequent moisture (Magnani, Grace, & Borghetti, 2002). Further defoliation or needle damage with additional drought(s) would more significantly reduce growth potential. Similar dynamics could also result if reduced post-drought growth occurs in response to depletion of deep soil moisture. Notably, trees from the NW population appear to respond differently than IM and SW trees, with smaller decreases in precipitation sensitivities (only to single droughts, Figure 3a) and a loss of sensitivity to both temperature (Figure 3b) and PDSI with increasing drought frequency (Figure 3c). Thus, the degree to which the above mechanisms apply to trees in the NW region is unclear.
Drought stress can also reduce sink strength (i.e., growth) independently of photosynthesis (e.g., Lempereur et al., 2015), and this may account for part of the reduced ring widths observed across species. However, there is no evidence for lagged (multiyear) effects of compounded or repeated droughts on sink limitation. On the contrary, these effects are likely more relevant on weekly to seasonal timescales, and it has been suggested that sink limitation could lead to greater than expected post-drought growth (higher sensitivity of growth than photosynthesis to mild drought would lead to NSC accumulation; McDowell, 2011), which is not consistent with the mean responses observed for P. ponderosa over the past century (Figure 2b). Regardless of the relative importance of active or passive components of NSC dynamics, in the context of more frequent drought, NSC is likely to eventually become limiting. This is consistent with recent work in some deciduous species showing allocation to canopy and leaf-level photosynthesis is upregulated in the year after drought (Kannenberg et al., 2019), suggesting prioritization of carbon uptake following drought. Thus, on the timescales of interest here (multiple years), depletion (Adams et al., 2017) or loss of access to (Sala & Hoch, 2009) to NSC pools is likely most relevant to how NSC dynamics contribute to drought legacies, though sink limitation may play a minor role in NW trees (see below). More studies are necessary to determine the interacting roles of NSC depletion and sink limitations in lagged effects of climate across multiple years.
4.2 Distinct regional responses to compounded drought
Variation in drought tolerance among populations will likely play a major role in the persistence of slowly migrating tree species under increasing drought associated with global climate change (Chen et al., 2010; Iverson & Prasad, 1998). Here, we find convergent responses to precipitation and divergent responses to temperature and PDSI under compounded droughts among SW/IM trees and NW trees (Figure 3a–c). While many different P. ponderosa subspecies have been proposed, the delineation between western and interior varieties is widely recognized (e.g., Conkle & Critchfield, 1988; Norris et al., 2006). Rapid range expansion northward from a probable origin in northern Mexico along the eastern and western sides of the Great Basin produced two distinct populations during the past 14,000 years (but see Potter, Hipkins, Mahalovich, & Means, 2013), with only limited gene flow occurring more recently through a hybrid zone in western Montana (Latta & Mitton, 1999). Here, SW and IM P. ponderosa represent the interior variety, while the NW region is part of the western variety (Figure 1). These results suggest consideration of the evolutionary history of a species when studying or predicting responses of trees and forests to more frequent drought is important.
Elevation, regional differences in drought frequency and intensity, or simply climatically insensitive trees in the NW could also explain population differences, among other factors. In Arizona, New Mexico, Colorado, and Utah, P. ponderosa is found near or above 2,100 m, but is commonly found down to ~450 m in the Pacific NW (Fryer, 2018). The degree of synchrony between drought or drought-related fire behavior and regional atmospheric teleconnections may also be different, where interannual moisture variability in the SW is closely tied to La Niña-related precipitation extremes and the North American Monsoon (e.g., Cole, Overpeck, & Cook, 2002; Westerling & Swetnam, 2003). In the Pacific NW, relatively slow variability in the Pacific Decadal Oscillation may more strongly drive regional drought (Hessl, McKenzie, & Schellhaas, 2004), and correlations with tree growth appear weaker or more spatially variable (Kipfmueller, Larson, & St George, 2012; Schoennagel, Veblen, Romme, Sibold, & Cook, 2005) compared to relationships with ENSO in the SW and IM (Peltier & Ogle, 2019). Finally, NW trees in this dataset are generally less sensitive to climate (Figure 3): their ring widths show higher autocorrelation (see Section 3) and wider mean raw ring widths (before detrending, ring width averages (1895–2011) are NW: 1.4 ± 2.7 mm, IM: 0.64 ± 0.56 mm, and SW: 0.76 ± 0.67 mm), indicative of generally less variable and more mesic conditions (Douglass, 1941). As a result, competition and biotic interactions may play a larger role in observed drought responses in these higher density forests (Young et al., 2017).
4.3 Implications of regional differences in prediction error
Scenarios that ignored legacy effects of drought (NoL, NoCL, and NoL2 prediction scenarios) systematically underpredicted growth in interior P. ponderosa populations (SW and IM). This suggests adaptive adjustments (plasticity) in growth–climate sensitivities in response to droughts in these populations. In particular, during widespread drought, drought-related changes in growth–climate sensitivities in interior populations (SW and IM, Figure 3) result in greater growth than predicted if trees did not adjust their sensitivities (Figure 4a,b). Interior P. ponderosa, particularly in the SW region, experience strong interannual variability in both cold- and warm-season precipitation, and another study indicates P. ponderosa and other conifer species show plasticity in precipitation responses at subannual timescales following drought (Peltier & Ogle, 2019). Sensitivity to climate in general is highest in interior varieties, potentially due to local adaptation to highly variable climate (McCullough et al., 2017).
We suggest that interior trees (SW and IM) may be more plastic in their response to climate variability in general. This is consistent with large changes in the climatic memory of SW trees: precipitation and PDSI conditions experienced further into the past are more important for growth following drought (Table 2). This suggests the potential for a greater reliance on stored NSC from previous growing seasons. However, IM trees show a different response, whereby droughts lead to much shorter climatic memory, suggesting greater inhibition by more recent (by more than 2 years) warm temperature conditions during drought periods (Table 2, recall temperature effects are negative). A recent study showed P. ponderosa stores more NSCs when growing under drier a climate, either as an active (upregulated; e.g., Dietze et al., 2014) or passive (sink-limited; e.g., Hagedorn et al., 2016; McDowell et al., 2008) response to drought limitation on photosynthesis (Piper, Fajardo, & Hoch, 2017). This could suggest trees at more arid sites have relatively more NSC available during droughts or when drought stress is released, but similar starch concentrations and higher sugar concentrations across tissues at the dry site (Piper et al., 2017), suggests regulation of osmotic potential under higher moisture stress (Huang et al., 2019). A shift toward more negative effects of more recent temperature during and following drought could also reflect sink limitation if IM trees are less adapted to high temperatures than SW populations.
Conversely, scenarios that ignored the legacy effects of drought generally overpredicted growth in Pacific NW populations of P. ponderosa (Figure 4c). Shifts in climatic memory associated with drought were also comparatively small (Table 2). This suggests that growth–climate sensitivities in this region also are influenced by repeated droughts, but in a manner more consistent with induced physiological damage following drought events (Anderegg, Schwalm, et al., 2015), or lower NSC stores, which would result in limited buffering capacity during droughts. There is limited evidence for lower NSC storage in P. ponderosa growing under more mesic climate conditions (Piper et al., 2017). Interior trees may experience greater cavitation during drought than NW populations, as arid-region conifers show the strongest legacies (Anderegg, Schwalm, et al., 2015) and the greatest reduction in precipitation sensitivities (Figure 3a). But it is also possible they are better adapted to rely on NSC stores during periods of widespread regional drought (Figure 3). As discussed above, the characteristics and intensity of drought may strongly differ between the SW/IM and NW regions, which may also underlie differences in tree growth responses. A shift toward insensitivity or slight positive sensitivity to temperature with drought in the NW (Figure 3b) could suggest sink (growth) limitation under milder drought conditions in that region, though this dynamic has primarily been shown in angiosperms (Delpierre, Berveiller, Granda, & Dufrêne, 2016). Manipulative experiments are likely necessary to fully understand these regional differences.
4.4 Compounded drought legacies are partially explained by SAM
Widely cited syntheses of legacy effects of drought in tree and ecosystem productivity draw the obvious conclusion that more frequent drought under climate change will have large negative consequences for carbon fluxes (Anderegg, Schwalm, et al., 2015; Schwalm et al., 2017). And yet, while we do find that compounded drought further reduces tree growth and alters growth–climate sensitivities (Figures 2b and 3), ignoring compounded legacy effects in our prediction scenarios does not strongly reduce prediction skill (compare full vs. NoCL scenarios, Figure 4d–f). This result arises partly due to the construction of our SAM model, given the use of drought-period-specific importance weights (wt,m,dr) that capture tree responses to antecedent climate, where the drought period weights are still applied in the NoCL prediction scenario (Table 1; also see Figure S2). Anderegg, Schwalm, et al. (2015) found that drought continued to influence tree growth for up to 4 years after a drought event; this type of legacy effect is captured by our model(s) in two ways: (a) via the antecedent importance weights, which suggest that climate up to 60 months ago is important for understanding tree growth, and (b) via the effects parameters, which are allowed to change under different drought conditions (non-drought, one recent drought, and compounded droughts). Prediction error in the NoCL scenarios, which ignore compounded drought (multiple droughts over the past 4–5 years), is relatively small (Figure 4) compared to other scenarios because the SAM model already accounts for the drought-specific effects of antecedent climate over this time period (via the importance weights wt,m,1) such that past droughts affect the values of the antecedent variables that are used to predict tree growth. The differences in drought year responses are thus captured by shifts in climate memory (Table 2). This suggests models accounting for differing antecedent climate responses during drought periods, or at least multiple years of antecedent climate, could still predict tree growth reasonably well under compounded drought. Incorporating antecedent climate covariates into models of tree growth in this way more accurately captures the plasticity in tree growth responses to climate via the physiological processes, such as NSC storage and hydraulic conductance, that make prediction of tree growth under variable climate so challenging (Trugman et al., 2018).
We showed that compounded drought events, or more frequent or repeated drought conditions, further reduce growth and alter growth responses to climate, with significant variation across a single species' range. Systematic error in growth predicted by scenarios ignoring legacy effects demonstrates that drought-induced changes in growth–climate sensitivities drive meaningful variation in tree growth. However, variation in prediction error suggests regional variation in resilience of plasticity in response to drought. Scenarios ignoring the legacy effects of drought systematically underestimate growth during regional drought in interior P. ponderosa, suggesting changes in growth–climate sensitivities and climatic memory in these trees could represent beneficial physiological adjustments, while overestimates in the NW regions in combination with only small changes in memory and climate response suggest growth sensitivities in these trees are less plastic in response to drought. While more frequent drought may induce larger growth suppressions, our results suggest genetic or population variation within species, local adaptation, or climatically driven variation in NSC storage dynamics may complicate regional predictions of compounded drought impacts under global climate change. Of course, we are inherently limited in our ability to interpret the physiological mechanisms underlying observed responses to drought at such large spatial scales, but we hope our discussion of the potential physiological factors underlying growth responses to compounded drought may motivate future experiments.
Not captured in these results are any increases in mortality risk from compounded drought, as tree-ring records are biased by design toward trees that survived drought events (Klesse et al., 2018; Peltier et al., 2016). For example, repeated drought would likely increase the risk of mortality from beetle infestation, as decreased NSC reserves could limit the amount and effectiveness of resin defenses (Manion, 1991; McDowell, Allen, & Marshall, 2010). While some experiments have focused on physiological processes underlying drought recovery like hydraulic conductance (e.g., Savi et al., 2016; Yoshimura et al., 2016), multiyear experiments verifying changes in growth–climate sensitivity and physiology such as multiyear declines in hydraulic function or NSC supply (Trugman et al., 2018) are necessary to synthesize a predictive understanding of these processes. In the interim, if we are interested in using statistical models to explore the mechanisms that underlie observed growth variability, consideration of the temporal complexity and plasticity of growth–climate responses is essential.
ACKNOWLEDGEMENTS
This work was funded by a National Science Foundation Advances in Biological Informatics award (ABI#1458867). The authors thank Bill Anderegg for permission to reproduce results in Figure 2. The authors thank the Ogle lab for comments on early versions. We also thank the ITRDB and authors who contribute tree-ring data to this extremely valuable resource.
AUTHOR CONTRIBUTION
DP conceived the study. DP and KO wrote and implemented the model, and analyzed the output. DP wrote the first draft of the manuscript, and KO contributed substantially to revisions.
Open Research
DATA ACCESSIBILITY
All data are publicly available either through the ITRDB (https://www.ncdc.noaa.gov/data-access/paleoclimatology-data/datasets/tree-ring), PRISM (http://prism.oregonstate.edu/), or WestWideDroughtTracker (wrcc.dri.edu).