Barren-ground caribou (Rangifer tarandus groenlandicus) behaviour after recent fire events; integrating caribou telemetry data with Landsat fire detection techniques
Abstract
Fire regimes are changing throughout the North American boreal forest in complex ways. Fire is also a major factor governing access to high-quality forage such as terricholous lichens for barren-ground caribou (Rangifer tarandus groenlandicus). Additionally, fire alters forest structure which can affect barren-ground caribou's ability to navigate in a landscape. Here, we characterize how the size and severity of fires are changing across five barren-ground caribou herd ranges in the Northwest Territories and Nunavut, Canada. Additionally, we demonstrate how time since fire, fire severity, and season result in complex changes in caribou behavioural metrics estimated using telemetry data. Fire disturbances were identified using novel gap-free Landsat surface reflectance composites from 1985 to 2011 across all herd ranges. Burn severity was estimated using the differenced normalized burn ratio. Annual area burned and burn severity were assessed through time for each herd and related to two behavioural metrics: velocity and relative turning angle. Neither annual area burned nor burn severity displayed any temporal trend within the study period. However, certain herds, such as the Ahiak/Beverly, have more exposure to fire than other herds (i.e. Cape Bathurst had a maximum forested area burned of less than 4 km2). Time since fire and burn severity both significantly affected velocity and relative turning angles. During fall, winter, and spring, fire virtually eliminated foraging-focused behaviour for all 26 years of analysis while more severe fires resulted in a marked increase in movement-focused behaviour compared to unburnt patches. Between seasons, caribou used burned areas as early as 1-year postfire, demonstrating complex, nonlinear reactions to time since fire, fire severity, and season. In all cases, increases in movement-focused behaviour were detected postfire. We conclude that changes in caribou behaviour immediately postfire are primarily driven by changes in forest structure rather than changes in terricholous lichen availability.
Introduction
Disturbance regimes in Canada's north are changing in a more rapid fashion than estimated historical rates of change (Chapin et al., 2000; Serreze et al., 2000). Boreal fire regimes in particular are changing with fire seasons becoming longer and having higher temperatures leading to more severe fires and more area burned annually (Joly et al., 2010; Kelly et al., 2013). In the western North American boreal forest, the area burned by wildfire has doubled from the 1960/1970s to the 1980/1990s (Kasischke & Turetsky, 2006) and this pattern is projected to continue in the future (de Groot et al., 2013). Increasing fire intensity in the boreal has been linked to melting permafrost (Johnstone et al., 2010a), reductions in organic layers, and conversions of spruce-dominated stands to deciduous-dominated stands (Johnstone et al., 2010b). Historical information regarding fire regimes across the North American tundra is less well documented; however, some evidence suggests that tundra fires were more widespread than previously thought (Jones et al., 2013).
The effects of changing fire regimes in the boreal forest and tundra are widespread (McGuire et al., 2006). Animals that utilize these environments are influenced by changes in burn severity and frequency. Barren-ground caribou (Rangifer tarandus groenlandicus) are the most numerous large mammal in the Canadian arctic (Bergerud, 2000; Festa-Bianchet et al., 2011) and are critical to northern ecosystems and cultures (Gordon, 2003; Parlee & Manseau, 2005). Currently, the majority of barren-ground caribou herds worldwide are in decline, with some herds having lost more than an order of magnitude of their population sizes in less than 30 years (Vors & Boyce, 2009). Barren-ground caribou have been shown to react negatively to fire in the forested areas of their range (Joly et al., 2010). Fire removes important food species such as terricholous lichens and cotton grass leading to a reduction in forage for caribou (Jandt et al., 2008). Fire can also remove cover which serves to offer concealment from predation. Recovery times for caribou forage can vary from three to 4 years for tussock cotton grass (Bret-Harte et al., 2013) to more than a century for lichens (Zouaoui et al., 2014) leading to uncertainty regarding how rapidly caribou habitat recovers postfire.
Currently, the majority of analyses examining the effects of fire on caribou foraging ecology compare used locations vs. random locations (Joly et al., 2010), because true negatives (i.e. areas that are not utilized by caribou) are difficult to identify reliably for herds that commonly have tens of thousands of members. Moreover, there are a number of shortcomings with a random location approach. Random locations will undoubtedly result in false negatives, adding noise to habitat use models. Additionally, estimating habitat use as a binary use/nonuse metric oversimplifies the complex ways in which caribou interact with their environment. It is conceivable that caribou would avoid foraging in a recently burned area while still using the area for travel. Traditional knowledge is divided on this subject, with some elders predicting caribou will completely avoid recent burns and others arguing that some movement will still occur immediately postfire (Kendrick & Lyver, 2005). Incorporating caribou behaviour into analyses regarding habitat use postfire would help address the multiple ways in which caribou interact with their habitat. Additionally, habitat use is not uniform throughout the year, with parts of the year more dedicated to foraging (i.e. increasing fat stores) and other parts more dedicated to movement (e.g. travelling to calving grounds in spring) (Bergerud, 2000).
As foragers, caribou diets vary throughout the year depending on forage availability and nutritional needs (Jandt et al., 2008); however, terricholous lichen mats (primarily Cladonia type lichens) form a portion of caribou diet throughout the year (Bergerud, 2000) and represent the majority of caribou forage in winter months (Joly et al., 2010). Terricholous lichens are high in digestible energy, making them excellent (and highly available) winter forage when energy demands are high (Jandt et al., 2008; Joly et al., 2010). Terricholous lichens are also readily destroyed by fire owing to their low moisture content and location on the ground (Jandt et al., 2008). Conversely, when animals, especially cows during spring and summer, are gaining fat, lichens are less desirable owing to their low protein and fat content (Cebrian et al., 2008; Joly et al., 2010).
Predicting the impacts of future fire on caribou habitat has, to this point, employed successional ecosystem forecasting incorporating global emission scenarios and global circulations models with stochastic fire events (see Joly et al., 2012; Gustine et al., 2014). Habitat gain/loss is examined at the end of the model run as the amount of habitat remaining that is defined as being favourable for caribou, such as spruce-lichen-dominated communities which have long estimated rates of recovery (more than 55 years; Joly et al., 2012; Gustine et al., 2014), vs. initial habitat availability. The effects of recent burns (i.e. immediately postfire and in the following years) on caribou behaviour, however, has not been tested directly and remains unknown.
Considering the lack of integration of behaviour into postfire-caribou analyses and uncertainty regarding caribou reactions to recent fire events, we present two key analyses. Firstly, we assess how the size and severity of fires have changed over the past 26 years across five barren-ground caribou herd ranges. Secondly, we examine how the behavioural metrics of individual barren-ground caribou change during the 26-year time period in burned locations. To provide context for our interpretations, we expect the burned area to have increased over the past 26 years in concert with recent findings (Kasischke & Turetsky, 2006; Kelly et al., 2013). We expect fire to result in a complete elimination of foraging-focused behaviour (Joly et al., 2010); however, we expect some movement-focused behaviour to remain (Kendrick & Lyver, 2005; Anderson & Johnson, 2014). We expect behaviour to shift from movement-focused behaviour towards foraging-focused behaviour as time since fire increases and as fire severity decreases.
Materials and methods
Study area
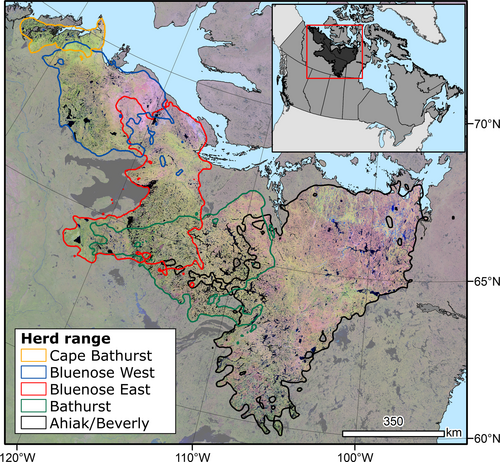
We examined the herd ranges of five herds occurring in the Northwest Territories and Nunavut, Canada (Fig. 1), encompassing over 700 000 km2 of boreal and tundra habitats. The winter range of each herd is primarily located in boreal forest habitat, with spring and fall ranges occurring near the treeline (Bergerud, 2000). Summer range is generally north of the treeline on the tundra while the calving grounds are located near the Arctic Ocean at the northern extent of each herd's range. From west to east, these herds are known as: the Cape Bathurst, Bluenose West, Bluenose East, Bathurst, and Ahiak/Beverly (Fig. 1).
Caribou telemetry data
Telemetry data (Telonics Inc., Mesa, AZ, USA; models TGW-4670-3; TGW-4680-3) have been collected since 2006, 2007, or 2008 until 2011, depending on the herd. GPS telemetry data provide latitude/longitude relocations (relocations referring to each time a GPS fix is recorded by the GPS unit) as well as a time stamp for each relocation. GPS error in Canada's north is typically <20 m (less than one 30 × 30 m Landsat pixel). Relocation data were only included in our analyses for individual animals with at least one complete year of tracking and a minimum of three GPS relocations per day, resulting in a maximum time step of eight hours (some individuals were tracked at five-hour time steps). In total, 258 animals (223 cows and 35 bulls) have been tracked across all five herds resulting in 325 388 GPS fixes, 107 500 of which fall within forested, that is fire prone, locations. The Bluenose West herd had the most collared animals (66) included in the relocation data set while the Ahiak/Beverly herd the least (30). However, only relocation data points occurring in previously burnt areas were used in this study, resulting 1369 relocations from 146 animals: 270 in fall, 850 in winter, 249 in spring, and 0 in summer when the animals are north of the treeline.
Animal behaviour has been described using proxy measures derived from animal tracking data (Zollner & Lima, 1999; Dodge et al., 2008; Calenge et al., 2009; Ciuti et al., 2012). When foraging animals such as barren-ground caribou are searching for food, they tend to move in a slow fashion and turn at large angles between subsequent GPS relocations (Zollner & Lima, 1999). When they are focused on movement, they tend to move in more rapid fashion and in more linear segments. It is important to note that there are numerous other factors affecting movement patterns for caribou (see Hebblewhite & Haydon, 2010 for a general summary of GPS collar limitations), including but not limited to predator and insect avoidance, rutting, and landscape features such as impassable terrain and water. Despite these challenges, mean movement velocities in foraging animals tend to be lower and mean turning angles higher during foraging-focused activity, while the reverse is true for movement-focused activity (Morales et al., 2004). By relating velocity (used here due to the use of two different length time steps (5- and 8-h); Dodge et al., 2008; Calenge et al., 2009) and the relative turning angle (i.e. the angle of deflection from the previous linear segment of a GPS trajectory; Marsh & Jones, 1988; Calenge et al., 2009) to time since fire and fire severity, we can link movement metrics describing behaviour to disturbance characteristics.
To quantify how caribou move in the absence of fire, velocities and relative turning angles of GPS relocations were also calculated for nonburnt areas. These values are presented simultaneously with the burnt values in the Results section to compare expected movement in the absence of fire with movement values in burnt areas. To avoid including GPS relocations which fell in areas with fires occurring prior to the Landsat time series used here (which begins in 1985; see Methods – Fire Detection), the fire record was extended prior to 1985 using the Canadian National Fire Database (Stocks et al., 2002; Canadian Forest Service, 2015) which provides spatial polygons of fires dating back to 1966 in this study area. However, the reliability of the data set deeper in the time series is unknown and likely contains false negatives.
Fire detection
Remotely sensed optical imagery has been used for fire detection for decades (Hame & Rauste, 1995; Hall et al., 2008; Roder et al., 2008); however, gaps in data archives, image perturbations (cloud, shadow, haze), and coarse spatial resolution, among other issues, have hampered documenting fires at high latitudes at a scale that relate to individual animals. Recently, White et al. (2014) developed a processing algorithm that creates pixel-based image composites from Landsat data using a best-available-pixel scoring (BAP) algorithm, which selects the best observation for a given pixel within a specified date range (August 1 ± 30 days) based on factors including acquisition date, presence of clouds, sensor, and atmospheric pixel quality. Hermosilla et al. (2015a) furthered this approach by creating seamless image composites by infilling data gaps resulting from no data or noise with proxy values using the temporal analysis of pixels’ spectral trajectories and trend detection (Fig. 1). The result is a Canada-wide Landsat composite surface reflectance product with no data gaps at 30 × 30 m resolution which allows for the identification of forest disturbances in the temporal trajectories of the spectral data. RandomForest (Liaw & Wiener, 2002) is used to classify change events based on spectral, temporal, geometrical data into an agent of change: fire, harvest, road, and nonstand replacing changes (e.g. vegetation stress) (Hermosilla et al., 2015b). This product is built using an augmentation of Canadian Landsat archive data (White & Wulder, 2013) with that of the United States Geological Survey where analysis ready image products are available on a free and open basis (Wulder et al., 2012). The resultant Landsat image composites provide a temporally dense and spatially detailed source of data for comprehensive (most recent) fire detection across caribou habitat from 1985 to present (Fig. 2a, b) at a spatial resolution that is appropriate for use with highly spatially accurate GPS telemetry data.
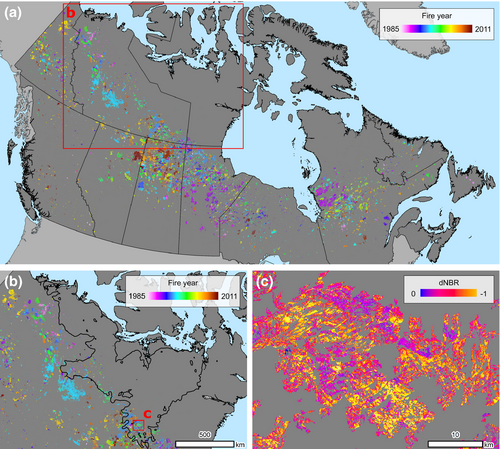
Landsat data have been used extensively to assess fire disturbances through time (e.g. Vogelmann et al., 2011). Most commonly, Landsat data are used to measure time since fire and estimate burn severity (Lentile et al., 2006; Eidenshink et al., 2007); however, a single universal measurement of burn severity has yet to be defined and usually depends on ecological conditions as well as project objectives (Lentile et al., 2006; Hall et al., 2008). The difference in pre- and postfire normalized burn ratio, dNBR (Key & Benson, 2006; Fig. 2c), is now the most often used Landsat index to estimate burn severity and is the index we used to estimate burn severity [NBR = (Band 4 − Band 7)/(Band 4 + Band 7)]. dNBR values range from 0 dNBR to −2 dNBR, depending on amount of removal of plant biomass; −2 dNBR is the maximum possible estimate of burn severity although values below −1 are rare. Positive dNBR values, that is 2–0, do not represent a disturbance and are therefore not included here (Brewer et al., 2005; Lentile et al., 2006; Roy et al., 2006; Eidenshink et al., 2007; French et al., 2008). Hall et al. (2008) detected a strong association between dNBR and burn severity; however, it is not a perfect estimate as time since fire, ecosystem characteristics, and the definition of burn severity used can all affect how well dNBR describes burn severity in any one location (Epting et al., 2005; Wulder et al., 2009).
Analysis approach


All models included Gaussian spatial autocorrelation structures to account for potential spatial dependence issues. This model procedure was carried out for an overall model (all seasons, although summer was not included owing to the lack of summer GPS fixes occurring in burnt areas) as well as for fall (September to November), winter (December to March), and spring (April and May) to examine how associations change with time of year. Seasons were defined using a generalized version of Nagy's (2011) analysis of differing movement rates of barren-ground caribou throughout the year. An alpha value of 0.05 was used for all significance tests. All statistical analyses were carried out in the r software package (R Core Team, 2015).
Results
Area burned and burn severity through time
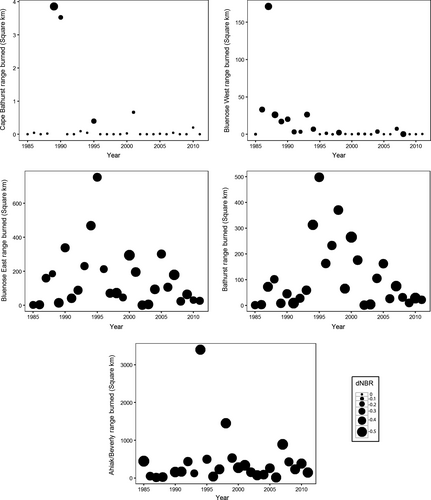
Neither area burned nor mean burn severity showed significant trends through time, save for the Bluenose West herd that had a significant decrease in both area burned (P = 0.002) and burn severity (P = 0.02) from 1985 to 2011 (Fig. 3). However, both relationships were driven by one exceptional fire year in 1987 that was almost equivalent to the sum of area burned in all other years for this herd. In general, area burned was driven more by extreme fire years rather than a moderate progression through time.
Caribou behaviour
All seasons
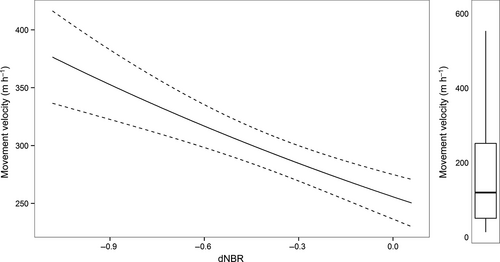
The final overall movement velocity model had no interaction term (two-variable no interaction model AIC = 4479.7; two-variable interaction model AIC = 4481.1; interaction term F = 2.32, P = 0.07) and included only burn severity as a significant predictor of movement velocity (F = 6.90, P = 0.009) (Fig. 4). The result was a slightly nonlinear relationship between movement velocity and burn severity with increasing burn severity resulting in larger mean velocities. Mean predicted overall velocities exceeded the median overall velocity (119.6) in nonburnt areas across the entire range of dNBR values.
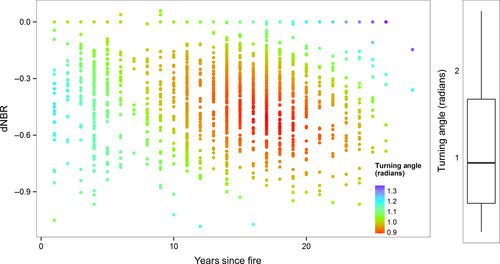
The final overall turning angle model incorporated both time since fire and burn severity along with an interaction term (two-variable interaction model AIC = 3732.8; two-variable no interaction model AIC = 3736.2; interaction term F = 2.317, P = 0.03). Turning angles were largest in <5-year-old high-severity fires and >20-year-old low-severity fires (Fig. 5). The lowest predicted turning angles were in previously burnt areas aged 10–20 years and with moderate levels of burn severity. Similarly, mean predicted overall turning angles were higher than the median overall turning angle (0.94) in the absence of fire except in moderate severity fires aged 10–20 years.
Fall
The fall movement velocity model did not include an interaction term (two variable with no interaction model AIC = 794.0; two variable with interaction model AIC = 797.2; interaction term F = 1.15, P = 0.33) nor was any relationship detected between turning angle and time since fire (F = 0.90, P = 0.34) or burn severity (F = 1.08, P = 0.30).
The fall turning angle model did not include an interaction term (two-variable no interaction model AIC = 806.8; two-variable interaction model AIC = 807.7; interaction term F = 2.03, P = 0.06) and only contained time since fire as a predictor of turning angle (F = 5.23, P = 0.01). This resulted in a nonlinear relationship between turning angle and time since fire with a minimum predicted turning angle occurring at 18 years postfire (Fig. 6). Mean predicted turning angles in fall were higher than the median turning angle (0.90) in the absence of fire until approximately 10 years since fire and then again beyond 22 years.

Winter
The final winter movement velocity model contained both time since fire (F = 3.28, P = 0.01) and burn severity (F = 4.92, P = 0.027) with no interaction term (two-variable no interaction model AIC = 2559.7; two variable with interaction model AIC = 2565.7; interaction term F = 2.16, P = 0.06). The result was a nonlinear relationship between predicted movement velocity and time since fire with a peak in movement velocity at 8 years and a negative relationship between movement velocity and burn severity (Fig. 7). Mean predicted winter velocities exceeded the median winter velocity (72.4) in nonburnt areas across the entire range of time since fire and dNBR values.

The winter turning angle model did not include an interaction term (two variable with no interaction model AIC = 1660.6; two variable with interaction model AIC = 1661.3; interaction term F = 1.10, P = 0.41) nor was any relationship detected between turning angle and time since fire (F = 0.55, P = 0.46) or burn severity (F = 0.13, P = 0.72).
Spring
The spring movement velocity model did not include an interaction term (two variable with no interaction model AIC = 711.2; two variable with interaction model AIC = 714.9; interaction term F = 1.15, P = 0.33) nor was any relationship detected between turning angle and time since fire (F = 0.76, P = 0.39) or burn severity (F = 0.58, P = 0.45).
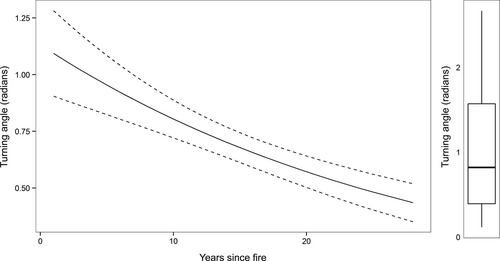
The spring turning angle model did not include an interaction term (two-variable no interaction model AIC = 721.7; two-variable interaction model AIC =722.4; interaction term F = 1.47, P = 0.17) contained only time since fire as a predictor of turning angle (F = 8.91, P = 0.003). The result was a slightly nonlinear negative relationship between movement velocity and time since fire (Fig. 8). Mean predicted spring turning angles were higher than the median spring turning angle (0.82) in the absence of fire until approximately 10 years since fire.
Discussion
No increase in annual area burned was detected for any of the herds (except the Bluenose West, where the observed decrease in area burned was the result of one large fire year early in the time series). Multiple analyses of boreal fire regimes have demonstrated that area burned is increasing across the boreal (Joly et al., 2010; Kelly et al., 2013), especially in the western portion of the Canadian boreal where some of these herds are located (Kasischke & Turetsky, 2006; de Groot et al., 2013). Whereas these studies examined much larger areas and/or longer time frames, our study encompasses only a small portion of the northern extent of the western Canadian boreal forest. Across each herd range, what was evident is that annual area burned is highly variable, primarily as a result of extreme fire years, rather than the result of a consistent increase in annual area burned. Despite this, our results are useful for herd managers concerned with how influential fire may be for the five herds examined here. The Cape Bathurst herd's largest area burned from 1985 to 2011 was less than 4 km2 indicating that, at present, fire is likely not a major concern for this herd. Alternatively, the Ahiak/Beverly herd range experienced one fire year (1994) where over 3000 km2 of habitat burned; fire may be a major concern for this herd at present and moving forward. In general, fires remain somewhat uncommon across the northern extent of the boreal forest and the intersection of tracked caribou in recently burned locations is a relatively infrequent occurrence.
However, the large amount of data obtained through multiple years of caribou tracking and analysed here has demonstrated that caribou respond to recent fires in different ways depending on the time since fire, fire severity, and season. When considering all seasons, caribou moved more slowly through burned areas with lower estimated burn severity. At no point, however, did the predicted mean overall velocities drop below the median overall velocity in unburnt areas, indicating that even after 26 years, caribou were selecting these areas as movement habitat rather than foraging habitat. This result supports our initial hypothesis predicting an earlier return of foraging type behaviour after less severe fires, as movement rates slowed significantly in less severely burned areas. As such, we posit that low-severity fires should result in a faster recovery of foraging in spite of how much time has passed since the fire occurred. Conversely, predicted overall turning angles were larger than median turn angles in new (aged ten or less years) high-severity burned areas and low-severity burned areas aged >20 years since fire, indicating some level of foraging-focused behaviour may occur in certain circumstances. The result seen in newly burned areas may be due to initial encounters of individuals moving into burned areas and then reversing course (Thomas et al., 1998), while the low-severity burned areas aged >20 years may have retained some lichen and/or allowed for some recovery of high-quality forage.
Jandt et al. (2008) found that terricholous lichens burned even during low-severity fires; therefore, burn severity may be less important to caribou forage than time since fire. Multiple studies have documented slow recovery of lichens postfire (Hart & Chen, 2006; Bret-Harte et al., 2013; Zouaoui et al., 2014) and it is unlikely much recovery of lichen communities occurred during the 26-year time frame examined here. Zouaoui et al. (2014) documented a highly nonlinear recovery rate for lichens that increased rapidly at approximately 100 years postfire. If lichen recovery rates are minimal immediately following fire, then behaviour is likely being influenced by other factors such as vegetation recovery rates or changes in forest structure. Hart & Chen (2006) documented rapid recovery rates of understory vegetation species in the boreal forest, specifically fire-adapted species and deciduous species, neither of which forms a major portion of caribou diet (although some selective foraging on deciduous shrubs does occur). An increase in nonforage or less preferred forage species at the expense of premium forage species may be driving this decline in caribou foraging activity postfire.
Time since fire and fire severity's effects on caribou behaviour differed according to season. Caribou reaction to time since fire in fall was similar to that detected in the overall model, with mean predicted turn angles falling below the median fall turning angle between 10 and 22 years postfire. This age range may result in forested communities with particularly poor forage conditions for caribou or a forest structure which is particularly difficult for travel (see Bolton et al., 2015), resulting in the use of established trails (Thomas et al., 1998). In winter, movement velocity peaked around 8 years postfire and then returned to mean levels by approximately 15 years postfire.
In winter, again we see a statistically significant decline in foraging behaviour and then a slow increase towards the end of our study period, although it occurred slightly earlier (from 5 to 15 years) than the overall and fall models. Winter movement velocity displayed a nearly linear negative relationship with burn severity indicating more foraging occurred in less severely burned areas regardless of time since fire. In all cases, predicted winter movement velocities remained greater than the median winter movement velocity indicating that during these months, burned areas were primarily used for movement. Anderson & Johnson (2014) also detected limited use by barren-ground caribou in early seral forests across their winter range, supporting the findings described here.
In spring, we found that caribou displayed a nearly linear negative relationship between turning angle and time since fire, with increasing time since fire resulting in more linear, movement behaviour regardless of burn severity. Similar to fall, mean predicted spring turning angles were lower than the median turning angle in the absence of fire at 10 years; however, no recovery was documented and caribou continued to move more linearly through burned areas in spring as time since fire increased. Spring is one of the more movement-focused times of year for barren-ground caribou (Bergerud, 2000); however, it is also a time for gaining fat, primarily through access to nutritious young forage such as tussock cotton grass (which can make up 70% of caribou diets in spring; Cebrian et al., 2008). Tussock cotton grass can recover quickly postfire (in some cases within 4 years postfire, although this was measured in a tundra ecosystem; Bret-Harte et al., 2013). The rapid recovery of an important spring forage species supports our findings of large turning angles in the first years following fire; however, the trend of increasingly linear movements postfire is unexpected.
Bolton et al. (2015) recently assessed postfire boreal forest structure using light detection and ranging data (LiDAR) within Landsat-detected burned areas finding that a substantial amount of residual biomass is left immediately following fire. In addition, Johnstone et al. (2004) found that tree establishment in Alaskan and Yukon boreal forests took three to 7 years. The retention of residual biomass and delay in tree requirement results in canopy height being lowest and forest structure being most homogenous approximately 10–15 years postfire, with height and structural complexity slowly increasing after this time. Considering the location of Bolton et al. (2015)'s study (the Canadian Boreal Shield) is substantially further south than the study area examined here, it is likely the structural recovery rates of the forests examined here are at the low end of their findings (i.e. closer to 15 years). The marked increase detected in movement-type behaviour across multiple seasons at a similar time postfire could be driven by a lack of cover owing to the loss of residual biomass which occurs at this 10–15-year interval or increasingly impassable terrain resulting in certain established trails being used for movement.
It is important to note several limitations of this study. First, we did not evaluate the impact of fire on the probability of use; rather, we assessed behaviour postfire given use. It is still likely that overall caribou avoidance of burnt areas did transpire, as we had 1369 GPS relocations occurring within burnt areas, of the more than 100 000 GPS relocations in forested areas. Additionally, 26 years of fire data is clearly an insufficient temporal record with which to document the full recovery of boreal barren-ground caribou habitat (Bartels et al., 2016); however, herein we document complex behavioural changes even within the first 26 years postfire. As remote sensing data sets increase in temporal length and as caribou telemetry data are accumulated, our ability to refine our understanding of caribou behavioural responses to fire will continue to improve. Additionally, the ability of remote sensing data to not only identify fires but also estimate the magnitude of disturbance was shown to be a useful predictor of caribou behavioural metrics. Thus, we propose that the analysis approach applied in this study provides a robust framework for moving forward with similar investigations in the future.
In conclusion, no change in area burned nor fire severity was detected across the 26-year study period. While unexpected, this result is not overly surprising considering fires remain relatively rare at the northern edge of the boreal forest, as well as the limited time frame which was examined. In all cases examined in this study, caribou demonstrated complex, nonlinear reactions to both time since fire and fire severity, suggesting that if fire regimes are changing (i.e. area burned is increasing despite our area burned results), we can expect complex changes in caribou behaviour to occur in those areas affected by fire. While the ultimate causes of these reactions are unknown and beyond the scope of this analysis, we have shown that estimating the effects of fire on caribou is nuanced and warrants more in-depth studies. Binary use/nonuse models (see Joly et al., 2010) that represent caribou habitat postfire may oversimplify the multiple ways in which caribou utilize habitats. We demonstrate here that generally fire results in an elimination of foraging behaviour, although there may be seasonal exceptions, especially immediately following fire in spring and fall. Finally, we suggest caribou behaviour is likely more influenced by changes in forest structure immediately following fires (and the concomitant impact this has on movement) rather than change in forage quality, such as reductions in terricholous lichens.
Acknowledgements
This work was funded by the National Science and Engineering Council of Canada (award number: PGS M – 427425-2012) and NCC (RGPIN 311926-13) and the Government of the Northwest Territories. Data used in this study are an outcome of the ‘National Terrestrial Ecosystem Monitoring System (NTEMS): Timely and detailed national cross-sector monitoring for Canada’ project jointly funded by the Canadian Space Agency, Government Related Initiatives Program, and the Canadian Forest Service of Natural Resources Canada.


