
Quantifying the direct and indirect effects of flow-related disturbance on stream fish assemblages
Summary
- Flood-related disturbances are predicted to be seriously altered by climate change effects, and this will have strong implications for stream communities. Predicting how and why community structure responds to changes in disturbance regimes will require measures of disturbance that are closely linked to community variability. A range of disturbance measures have been tested for their ability to explain patterns in stream periphyton and invertebrate assemblages, but assessments of fish have largely focussed on flow measures as predictors. Consequently, the mechanisms driving fish assemblage responses to disturbance are poorly known.
- Stream disturbance was quantified using seven measures, three based on disturbance of the streambed (assessed using painted tracer particles), three associated with variation in stream discharge and one from a subjective measure of stream channel stability. Twenty streams were sampled on five occasions to evaluate which disturbance measure explained the most variation in fish assemblages and also to quantify the influence of disturbance on spatial and temporal assemblage variability. To determine whether disturbance affected fish directly or via its effect on benthic food supply (i.e. stream invertebrates), a one-off survey of 52 streams was conducted.
- Path analysis on data from the 20 streams indicated that fish biomass responded most strongly to flow-mediated bed movement, not flow variability. Consequently, bed-movement measures were better predictors of spatial and temporal variability in fish biomass and assemblage structure than purely hydrological measures. Furthermore, variations in fish biomass and assemblage structure were higher in more disturbed streams. A second path analysis conducted on data from the 52 stream survey compared the effects of physical habitat and food-related components of bed disturbance on fish biomass. It indicated that both had a similar influence on disturbance-related reductions in fish biomass.
- These results indicate that variation in fish assemblages can best be understood by measuring or predicting bed movement, because bed disturbance is likely to encompass more effectively major factors that influence stream fish, such as habitat availability and food supply. A shift in disturbance regime is likely to change the biomass of fish a habitat can support and fish assemblage structure.
Introduction
Natural disturbances (defined as ‘any relatively discrete event in time that removes organisms and opens up space that can be colonised by individuals of the same or different species’; Townsend, 1989) are a strong structuring force in terrestrial, marine and freshwater communities (Sousa, 1984; Pickett & White, 1985; Parker & Huryn, 2006; Lepori & Malmqvist, 2009). In freshwater ecosystems, disturbance regimes are predicted to be seriously altered by climate change effects, such as reduced precipitation and temperature-induced increases in evapotranspiration (Xenopoulos & Lodge, 2006; IPCC, 2007). Disturbance regimes will be altered by climate change not only directly, because of climate-driven changes to flow regimes, but also indirectly by increasing demand for water abstraction or storage (Oki & Kanae, 2006). Currently, our ability to predict the influence of such changes on communities is hindered by a poor understanding of the mechanistic pathways contributing to disturbance-driven spatial and temporal variation in communities (Fraterrigo & Rusak, 2008). To forecast and respond to climate change effects, a greater understanding of the influence of disturbance on communities is required. Moreover, climate warming is predicted to disproportionately impact higher trophic levels (Daufresne, Lengfellner & Sommer, 2009) because their risk of extinction is increased due to traits such as long life histories and high-energy demands. To enhance the understanding of the effects of disturbance on higher trophic levels, we investigated how stream fish assemblages varied across a gradient of natural flood-related disturbance.
Disturbance gradients are strong determinants of communities because they affect species abundance, biomass and diversity, but the ultimate outcome will depend on the mechanisms driving those effects (Fisher et al., 1982; Pickett & White, 1985; Death & Winterbourn, 1994, 1995; Lake, 2000). Some theory suggests that in benign, predictable environments, biotic interactions are likely to be important in structuring communities, but as environments become more disturbed, communities will be increasingly influenced by stochastic processes (Menge & Sutherland, 1987; Ives et al., 2003). Effectively, community structure is expected to be less predictable as environments become increasingly disturbed (Fisher et al., 1982; Death & Winterbourn, 1994; but see Lepori & Malmqvist, 2007 for an exception). These ideas have been tested using mainly periphyton and invertebrates in stream ecosystems (e.g. Cobb, Galloway & Flannagan, 1992; Death & Winterbourn, 1994, 1995; Clausen & Biggs, 1997; Townsend, Scarsbrook & Doledec, 1997), where species traits and richness often vary with disturbance resulting in changes to the biomass and structure of communities. However, much less is known about how stream fish respond to changes in disturbance, although reductions in biomass and changes in assemblage structure might be expected as disturbance increases, because disturbance is likely to have important influences on habitat availability and food supply (Meffe & Minckley, 1987; Sircom & Walde, 2009).
The uncertainty surrounding the effects of disturbance on fish assemblages may be due in part to how disturbance effects on fishes are measured and defined. For lower trophic levels, such as periphyton and invertebrates, a range of disturbance measures have been evaluated (e.g. shear stress, particle movement, discharge) to assess which measure best explains community change (e.g. Clausen & Biggs, 1997; Townsend et al., 1997; Schwendel et al., 2011). Comparisons of both bed-movement and flow-related disturbance measures have generally concluded that bed-movement (i.e. the movement of substratum particles of various sizes during high discharge events) measures explain more variation in community composition through time than hydrological measures (i.e. those describing hydrological regimes in terms of flow variability, flood magnitude or flood frequency) (e.g. Death & Winterbourn, 1994; Townsend et al., 1997). This may be because periphyton and invertebrate assemblages are intimately associated with the streambed, so when the substratum is mobilised, these organisms are strongly influenced. Thus, streambed movement may have a more direct effect on assemblages, whereas the hydrological regime may have a more indirect influence. This is because the hydrological regime interacts with slope (Leopold & Wolman, 1957), channel confinement (Fotherby, 2009), sediment supply (Dietrich et al., 1989) and sediment state (Laronne & Carson, 1976) to influence bed movement, and it is these movements that cause physical disturbances that remove organisms and open up space for colonisation. Therefore, differences in sediment conditions or hydrological–hydraulic relationships mean that the same hydrological regime will not result in the same physical disturbance regime across sites with different landscape settings. Hydrological regimes may also influence communities through mechanisms other than physical disturbance, such as nutrient spiralling (Doyle, 2005) or altered temperature regimes (Chinnayakanahalli et al., 2011).
Whilst periphyton and invertebrates are predominantly benthic organisms, fish may occupy benthic and/or pelagic habitats, so determining a disturbance measure useful for predicting changes in fish assemblages has been less straightforward. Almost by default, the effects of disturbance on fish have been described using hydrological measures, as observed flow time-series may be readily available for many streams (e.g. Poff & Allan, 1995) or predicted hydrological measures may be available across entire landscapes (Crow, Booker & Snelder, 2013). Hydrologically-derived measures can explain observed patterns in stream community structure (e.g. food chain length; Sabo et al., 2010), but there are likely to be better measures such as those linked to bed movement (e.g. Townsend et al., 1997). Numerous studies have shown that substratum grain size is an important determinant of diversity and abundance for fish and lower trophic levels (e.g. Power, 1992; Death & Winterbourn, 1995; Jowett & Richardson, 1995), so explaining variation in fish communities using only hydrological measures may marginalise the importance of abiotic factors and biotic interactions (between fish and invertebrates), even though both strongly influence fish assemblages (e.g. Power, Matthews & Stewart, 1985; Jowett & Richardson, 1995; Nyström, McIntosh & Winterbourn, 2003). Shifting the focus onto more mechanistic drivers that influence changes at lower trophic levels (e.g. bed movement) should lead to increased predictive power at the fish assemblage level.
Invertebrate community responses may be more tightly coupled to changes in bed disturbance rather than hydrological regimes, due to shifts in species traits (Death & Winterbourn, 1994; Townsend et al., 1997; McHugh, McIntosh & Jellyman, 2010). Traits that confer resistance to biotic interactions under more benign conditions (e.g. protective cases or shells) usually increase the susceptibility of a ‘protected’ species to bed disturbance (Wellborn, Skelly & Werner, 1996; Wootton, Parker & Power, 1996) because their case or shell limits mobility leading to high rates of crushing mortality when the substratum moves (Otto & Svensson, 1980). Similarly, fish may actually respond to bed movement mediated by flow, rather than flow per se (similar to stream periphyton and invertebrates). This is because bed movement may better reflect changes in habitat and food availability for fish than flow-related measures. Thus, the most useful disturbance measure for fish communities may need to reflect variation in habitat and food (i.e. invertebrates) availability because these are two major factors known to limit fish abundance (Schlosser, 1985; Power, 1992).
To assess the effects of flow-related disturbance on stream fish assemblages and to determine which measure(s) of disturbance best explained variation in fish biomass and assemblage structure, repeat fish surveys were conducted for 15 months at each of 20 sites. Compared with other abiotic factors (e.g. habitat size, water temperature), disturbance was expected to exert the greatest influence over assemblages (H1) due to the unpredictable flooding regime in the study area. Disturbance measures that incorporated some element of bed movement (i.e. tracer particle observations, river disturbance index) were expected to be better predictors of fish assemblage variation than hydrological measures (H2), because bed-movement observations may better reflect variation in fish habitat availability and changes to lower trophic levels (that affect fish food supply) than hydrologic variability. Fish biomass and assemblage structure were expected to be more variable at sites that experienced more disturbance (H3) due to species extinction and recolonisation. Finally, we hypothesised that the effect of disturbance on the availability of food (i.e. an indirect effect of disturbance) would be as important as direct disturbance-related effects on fish habitat (H4).
Methods
Study sites
Fish were sampled once at a total of 52 sites in Canterbury, South Island, New Zealand from 2005 to 2009, and a subset of 20 sites was repeatedly sampled over a 15-month period (Fig. 1). Sites were mainly located in high-country catchments that drained into either the Rakaia or Waimakariri Rivers (altitude 480–900 m), although five sites were also surveyed on Banks Peninsula (altitude < 50 m). A combination of grey sandstone and dark mudstone (commonly called greywacke) dominated high-country catchments that were located on the eastern side of the Southern Alps. Variable rainfall in the alpine headwaters of these streams (e.g. 1000–5000 mm year−1; Greenland, 1977) means that unpredictable and sudden increases in discharge can occur. In contrast, Banks Peninsula was formed by two overlapping volcanic cones (c. 6 million years ago), which have now been heavily eroded to produce short, steep catchments. Rainfall on Banks Peninsula rarely exceeds 1500 mm year−1, and there is less variation in stream water temperature because sites are close to the coast and at a much lower altitude than those in high-country catchments. The dominant catchment vegetation in the high country is a mixture of beech forest (Nothofagus spp.) and tussock grasslands, whereas on Banks Peninsula, tussock and exotic grasses are interspersed with pockets of scrub and regenerating podocarp forest. Most study sites were grassland streams with surrounding vegetation subject to low-intensity grazing.
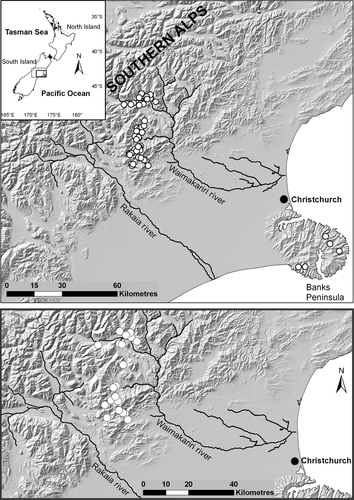
Study sites were selected within these catchments to span a gradient of flood disturbance (achieved by having sites with contrasting flow regimes, e.g. springs, mountain-fed rivers), encompass a range in stream size (width: 0.8–13.9 m, stream order: 2–5) and vary in median substratum particle size (d50 range: 45–225 mm; Table 1). At each site, a single-channel 50-m survey reach was selected, which was wadeable and <15 m wide (so it could be fished quantitatively with a backpack electrofisher). Within each reach, there needed to be a 25-m section containing at least one pool, run and riffle habitat for electrofishing. Sites were excluded if they did not meet these criteria, were fishless, had pH values that may prohibit some species from being present (<6 or >8.5) or had high conductivity (>150 μS cm−1; indicative of potential water pollution).
| Site | Altitude (m a.s.l) | Distance to sea (km) | Catchment size (km²) | Habitat size (m²) | Width (m) | Max depth (m) | Substratesize (d50) | Water temp (°C) | Airtemp (°C) | pH | Conductivity (μS25 cm−1) | Dissolved oxygen (mg L−1) | Canopy cover (%) |
|---|---|---|---|---|---|---|---|---|---|---|---|---|---|
| Acheron river | 823 | 110.2 | 10.5 | 0.56 | 2.35 | 0.46 | 45 | 6.8 | 6.9 | 7.1 | 61 | 11.2 | 10 |
| Binser streama | 536 | 131.3 | 4.2 | 0.30 | 2.31 | 0.33 | 100 | 6.4 | 6.8 | 7.4 | 72 | 12.6 | 20 |
| Bradley streama | 682 | 116.7 | 2.3 | 0.31 | 2.15 | 0.4 | 130 | 7.9 | 7.1 | 8.1 | 141 | 11.9 | 5 |
| Broken river | 659 | 116.4 | 31.8 | 1.26 | 4.90 | 0.57 | 57 | 7.0 | 7.1 | 7.5 | 66 | 13.0 | 0 |
| Bruce stream | 627 | 147.5 | 28.5 | 1.50 | 7.08 | 0.45 | 80 | 6.6 | 7.4 | 7.4 | 95 | 12.3 | 0 |
| Cass river | 576 | 136.5 | 41.3 | 0.89 | 4.44 | 0.41 | 80 | 7.3 | 7.4 | 7.3 | 60 | 11.8 | 0 |
| Coach stream-lower | 625 | 96.1 | 7.0 | 0.37 | 2.62 | 0.31 | 78 | 6.9 | 7.6 | 7.3 | 68 | 11.3 | 20 |
| Coach stream-upper | 692 | 97.3 | 3.0 | 0.24 | 1.41 | 0.43 | 65 | 7.6 | 8.1 | 7.4 | 103 | 11.2 | 10 |
| Dry stream | 758 | 121.2 | 6.1 | 0.16 | 1.80 | 0.31 | 50 | 7.7 | 7.2 | 7.8 | 55 | 12.0 | 0 |
| Grasmere stream | 570 | 136.0 | 28.5 | 1.06 | 2.89 | 0.76 | 70 | 8.9 | 8.2 | 7.1 | 90 | 10.7 | 5 |
| Hawdon river | 576 | 138.2 | 79.8 | 2.19 | 9.76 | 0.51 | 60 | 6.4 | 7.8 | 7.4 | 75 | 11.3 | 0 |
| Kowai river | 573 | 93.7 | 36.1 | 0.93 | 5.04 | 0.48 | 140 | 8.5 | 8.9 | 7.4 | 66 | 11.4 | 0 |
| Lower farm stream | 547 | 131.6 | 5.9 | 0.50 | 2.82 | 0.37 | 53 | 6.9 | 8.7 | 7.4 | 68 | 12.5 | 0 |
| Manson creek | 739 | 117.6 | 4.8 | 0.39 | 2.25 | 0.39 | 80 | 6.1 | 6.5 | 7.3 | 49 | 13.0 | 30 |
| McNulty streama | 899 | 126.9 | 3.2 | 0.33 | 2.21 | 0.33 | 119 | 4.7 | 5.0 | 7.5 | 50 | 12.0 | 0 |
| Pass streama | 865 | 116.3 | 2.8 | 0.29 | 2.64 | 0.34 | 68 | 7.0 | 6.6 | 7.3 | 51 | 11.5 | 20 |
| Peacock streama | 562 | 133.1 | 2.3 | 0.16 | 1.28 | 0.34 | 85 | 6.4 | 6.4 | 7.5 | 74 | 12.0 | 90 |
| Slip springa | 746 | 120.2 | 8.7 | 0.62 | 3.54 | 0.33 | 71 | 8.1 | 7.6 | 7.3 | 68 | 10.8 | 5 |
| Waimak springa | 480 | 127.9 | 1.4 | 0.72 | 5.23 | 0.34 | 51 | 8.6 | 8.8 | 6.8 | 68 | 10.7 | 0 |
| Whitewater stream | 723 | 119.3 | 22.4 | 0.99 | 4.48 | 0.45 | 225 | 7.1 | 7.3 | 7.4 | 56 | 11.4 | 0 |
- a Unofficial name.
Disturbance measures
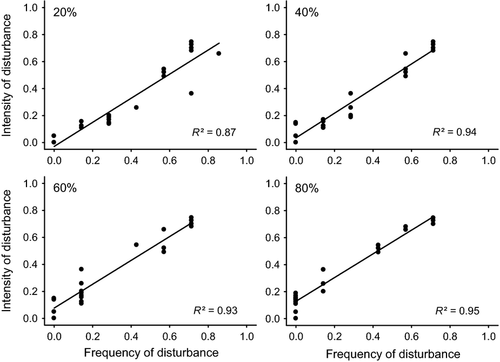
Stream disturbance was assessed with a range of channel stability and hydrological measures to evaluate which measure or combination of measures explained the most variance in fish assemblage metrics. The disturbance measures were comparable to the seven used by Townsend et al. (1997) to quantify disturbance effects on stream invertebrates and included three bed-movement measures, three hydrological measures and a subjectively derived disturbance assessment score. Streambed movement was measured in response to high flow events following the protocol of Townsend et al. (1997). Tracer particles from the stream, which corresponded to the 50, 75 and 90th percentiles of the substratum particle size distribution, were painted and arranged in five rows (spaced 2 m apart) with one particle from each size class randomly assigned to each row. The movement of these particles was monitored on seven occasions (c. bi-monthly) from May 2008 to July 2009, and on each occasion, particles that had moved were reset/replaced. A particle was designated as having ‘moved’ if it was more than 0.3 m downstream of its row; the distance a particle moved was not recorded. Tracer particle movement was used to calculate three disturbance measures: (i) disturbance intensity – the average proportion of painted particles that had moved during the seven monitoring occasions; (ii) disturbance frequency – the proportion of the seven monitoring occasions when disturbances greater than a certain magnitude had occurred [the same four categories were used that had been arbitrarily selected by Townsend et al. (1997): 20, 40, 60 and 80% of painted particles that had moved]. To select a bed-movement disturbance frequency threshold for use in analyses, disturbance intensity was plotted against four bed-movement disturbance frequency thresholds. These thresholds were based on the proportion of the seven sampling periods where a particular disturbance intensity (20, 40, 60 or 80% of tracer particles moved) was exceeded. However, there were significant relationships between disturbance intensity and frequency, irrespective of the threshold used to calculate disturbance (Fig. 2). As there was very little variation between the 40 and 80% disturbance frequency regressions, frequency data based on the 40% bed-movement threshold were used in analyses because data points were most evenly distributed across the frequency gradient for that threshold (Fig. 2); and (iii) maximum disturbance intensity – the greatest proportion of painted particles that had moved that occurred during the monitoring. This tracer particle approach does involve adding new substrata to the streambed, which may bias estimates of natural disturbance and may also produce estimates of mean bed disturbance with large standard errors (Downes et al., 1998). However, it also has advantages over other methods (e.g. the critical-tractive force approach) because it is site specific and produces a direct measure of bed movement, rather than one that is calculated from equations developed for particular substratum grain sizes under uniform flow conditions (Townsend et al., 1997), and it is logistically feasible to carry out over a large number of streams.
At least six discharge gaugings were performed at each site, which were combined with data from a water height logger to produce rating curves that enabled a 15-month flow record with hourly temporal resolution to be calculated. Discharge was calculated using the velocity–area method with velocity measurements taken using a Marsh-McBirney current meter (Flo-Mate Model 2000, Frederick, MD, U.S.A). Discharge estimates were taken across a broad range of flows, although extreme high flow events could not be gauged at some sites. In these instances, calculated TopNet flow data were used to estimate peak flows (an explanation of how TopNet calculates flow data is given in the next section). We selected three further flow-related disturbance measures from these data for further evaluation: (iv) mean discharge (calculated from hourly discharge values over 15 months); (v) coefficient of variation of discharge (discharge CV); (vi) flood frequency (FRE3) – the average number of events per year that exceed three times the median flow (calculated over 15 months), after having discounted events that begin within 5 days of the end of the previous event. FRE3 has been shown to be an ecologically relevant flow measure for determining variation in benthic biota (Clausen & Biggs, 1997).
The final disturbance measure (vii) was the river disturbance index (hereafter abbreviated to RDI) – this is often referred to as Pfankuch's index (Pfankuch, 1975). The index estimates disturbance based on 15 categories that evaluate landscape, riparian and stream characteristics (e.g. landform slope, vegetative bank protection, channel capacity, amount of deposition). An observer visually grades each category, and the scores are summed to give an overall index score (RDI range: 38–152). Small numbers indicate the waterway is stable, whereas a larger number signifies the waterway is physically unstable/highly disturbed. This index (or just its bottom subcomponent) has previously been used as an effective measure of bed stability across many studies (e.g. Death & Winterbourn, 1995; Townsend et al., 1997; McIntosh, 2000; McHugh et al., 2010; Schwendel et al., 2011).
Repeat surveys assessing fish assemblage responses to disturbance
Sampling of environmental variables
Repeat surveys were conducted quarterly from July 2008 (i.e. 3 months after disturbance monitoring began) to July 2009 at 20 sites to investigate the relative importance of disturbance in comparison with other abiotic factors (H1) and also how much variation in fish assemblage metrics was explained, across space and time, by the different disturbance measures (H2 and H3). The 20 sites had no upstream dams and unmodified flow regimes (with the exception of one site with a small, seasonal ‘take’ for livestock drinking water). Each site was sampled five times, although some habitat variables were only measured during the first survey (e.g. altitude), whilst other variables were measured during each survey (e.g. conductivity, canopy cover; see Table 1 for a summary of the major variables). One hundred randomly collected substratum particles were measured to the nearest mm (principal axis), and median substratum particle size (d50) was calculated. For each survey, five width/depth cross sections and water chemistry parameters (dissolved oxygen, pH and conductivity) were measured to assess any temporal changes. Air and water temperature (accuracy ± 0·5 °C) and stage height (accuracy ± 1 mm) were measured every hour for 15 months from May 2008 to July 2009 using TruTrack® WT-HR 1000 or 1500 (Christchurch, New Zealand) data loggers at all study sites. Loggers were secured to steel y-posts that were set into the streambed, or at highly disturbed sites, loggers were bolted into bedrock or, in two instances, attached to a bridge. Whilst most loggers remained in place during the 15 months, some were damaged or lost during large floods. It usually took c. 10–15 days to get a replacement logger installed, leaving some periods of missing flow data. Estimated daily flows (m³ s−1) for these periods were extracted from an uncalibrated rainfall–run-off model (TopNet) of New Zealand. TopNet is a spatially distributed, time-stepping hydrological model and is described in detail in Clark et al. (2008). TopNet has been run at an hourly time step over the period 1972–2010 using Strahler-3 subcatchments from the New Zealand river environment classification (Snelder & Biggs, 2002). Where TopNet flow data were used, they were first calibrated against available flow data at a site by regressing observed values against TopNet-calculated values. TopNet-calculated flows were also compared with observed flows from nearby gauging stations, as well as a catchment rainfall gauge (a gauge not used as input to the TopNet model) to cross-validate predicted flow data. Missing temperature data were predicted by calibrating the affected temperature logger with a nearby functioning logger(s).
Fish surveys
On each occasion at each of 20 sites, a 25-m reach was quantitatively (three-pass) electrofished using a Kainga EFM 300 (300–600 V pulsed DC) backpack electrofishing machine (NIWA Instrument Systems, Christchurch, New Zealand) with stop nets in place. The operator moved in a downstream direction towards a 1-m-wide push net (mesh size 3 × 2 mm ellipse) because electrofishing in a downstream direction is the most efficient method for capturing fish species in these streams (Jellyman & McIntosh, 2010). The native species captured were Anguilla dieffenbachii, Galaxias brevipinnis, G. vulgaris, G. paucispondylus and Gobiomorphus breviceps, whilst the introduced species were Oncorhynchus mykiss, O. tshawytscha and Salmo trutta. All captured fishes were anaesthetised with 2-phenoxyethanol, measured [to the nearest 1 mm; fork length (FL) for salmonids and total length (TL) for other species], weighed and released. Fish density was calculated using maximum-likelihood equations for multiple-pass depletion sampling (Cowx, 1983).
Synoptic stream community survey
To investigate the relationship between disturbance, invertebrates and fish assemblages (H4), 52 sites were sampled on one occasion between April 2005 and May 2009 (Fig. 1). At each site, both invertebrates and fish were sampled in the reach and a disturbance assessment conducted (measured using the RDI; index range for sites: 50–141). Fish were sampled using the methods described previously but, in addition to the eight species captured during repeat surveys, another five native species were caught in the synoptic surveys (Anguilla australis, Cheimarrichthys fosteri, Galaxias fasciatus, Gobiomorphus hubbsi and G. huttoni). To sample invertebrates, five Surber samples (0.0625 m², mesh size 250 μm) were taken within the reach to determine invertebrate biomass. One sample was taken every 10 m in an upstream direction in riffle or run habitat. The lateral position across the width of the stream where each sample was taken was randomised. Invertebrates were preserved in 90% ethanol, sorted and then identified in the laboratory at a magnification of ×10. Aquatic invertebrates were identified to either genus or species (except Chironomidae, which were identified to subfamily) using the keys of Winterbourn, Gregson & Dolphin (2000). Ash-free dry mass (AFDM) of each group was calculated by air drying for at least 48 h at 50 °C, followed by ashing at 550 °C for 4 h. At each stage of the drying and ashing process, samples were weighed to the nearest 0.1 mg on a Mettler Toledo AB204-S balance (Küsnacht, Switzerland).
Data analysis
Repeat surveys
The effect of disturbance, habitat size, substratum grain size, water temperature and canopy cover on fish biomass was evaluated using a multi-model inference approach (Burnham & Anderson, 2002) to identify which abiotic factor had the greatest explanatory power (to test H1). The least-squares analogue of Akaike's Information Criterion (AIC; Akaike, 1973), corrected for small sample size (AICc), was used in model selection, and the degree of support for each model i in the candidate set was assessed based on Δi (i.e. Δi = AICci – min[AICc]). Akaike weights, wi (i.e. wi = e(−0.5Δi)/Σe(−0.5Δi)), were also computed and used to generate evidence ratios (i.e. wi / wj) for ij model pairs.
Relationships between disturbance measures were compared using Pearson correlation coefficients (r). To select the disturbance measure for use in the above-mentioned (and additional) analysis, linear regressions were conducted using the seven disturbance measures as predictors and the four fish assemblage metrics as response variables to determine the best predictor(s) of disturbance for fish assemblages (to test H2). These four fish assemblage metrics were as follows: (i) biomass – calculated as mean biomass at each site from the five repeat fish surveys (this was considered the main response metric since it is indicative of both changes in species composition and abundance within the overall assemblage); (ii) biomass variability – temporal variability in fish biomass was assessed by calculating the coefficient of variation (CV) for biomass at each site over the five surveys; (iii) assemblage structure – calculated as the mean of the NMDS axis scores for each site from the five repeat surveys; and (iv) assemblage variability – the average dispersion distance in ordination space between the five survey sampling points (further explanation is provided below about how the assemblage structure and variability metrics were calculated). Fish assemblage responses to individual disturbance measures were ranked (based on R² coefficients across all four metrics) to find the disturbance measure that explained the most variation in fish assemblages.
A structural equation model (i.e. path analysis) was used to assess whether the effect of disturbance on the fish assemblage (as measured using biomass) was due to flow variability (i.e. a direct effect) or bed movement mediated by flow variability (i.e. an indirect effect). This analysis allowed the direct, indirect and total effects of disturbance on fish biomass to be disentangled by comparing the relative strengths of direct versus indirect pathways. Path analysis has advantages over ordinary least-squares methods (i.e. regression or correlation) because it can quantify direct effects on a response variable caused by variation in a predictor variable whilst removing effects of other predictor variables (Mitchell, 2001; Yee & Juliano, 2007). The fitted model produces standardised path coefficients for all paths (i.e. direct and indirect effects) that range between 0 and ± 1. These path coefficients are equivalent to standardised regression coefficients since larger absolute path coefficients indicate a stronger relationship but have the advantage of specifying whether the relationship between the predictor and response variable has a positive or negative slope. In the analysis, direct and total indirect (e.g. the product of flow variability–bed movement and bed movement–fish biomass coefficients) path strengths, as well as their difference, were estimated; 95% confidence intervals were generated for each estimate by bootstrapping (n = 1000 iterations). Bootstrapped confidence intervals that include zero within their range indicate a non-significant path. All response and predictor variables, except bed movement, were log10- or loge-transformed to meet the assumptions of maximum-likelihood estimation and multivariate normality. Analyses were completed using the SEM package in R (R Development Core Team, 2012).
The effect of disturbance on fish assemblages was evaluated by assessing temporal changes in species biomass (log-transformed to downweight species with a large body size) at each stream for the five repeat sampling occasions (H3). Mixed-effects models (Pinheiro & Bates, 2000), also known as linear multilevel models (Snijders & Bosker, 1999), were applied to deal correctly with pseudoreplication. In this context, the results take the form of fixed effects and random effects (i.e. site and time). Fixed effects were specified to model the overall response of biomass in relation to disturbance. A full model was formulated in which random effects were specified to model between-site variation around the intercept and slope of the relationship between biomass and disturbance using the ‘nlme’ package in R (R Development Core Team, 2012). This model was compared with several reduced models by removing various random effects. The formulation of the random effects was assessed by comparing AIC values (Akaike, 1973; Burnham & Anderson, 2002) calculated for each model. In addition, P-values for Wald tests on individual parameters were examined.
Both predictability and variability in assemblage structure (H3) were assessed using a Bray–Curtis dissimilarity (resemblance) matrix, which was then subjected to ordination using non-metric multidimensional scaling (NMDS) in PRIMER, version 6 (two data points were excluded because no fish were recorded during these surveys). The NMDS was given 25 random starts in both two and three dimensions. To simplify later analysis, only two dimensions were retained, as the third dimension resulted in only a minor reduction in the ordination stress value (0.14 versus 0.09). For each site, the mean NMDS score for axis one and mean score for axis two were calculated. Mean NMDS axis scores were then used in regression analysis to assess whether the structure of fish assemblages responded predictably to changes in disturbance. Variation in assemblage structure between sites was analysed using PERMDISP, which tests for heterogeneity in the average dissimilarities of points from the central location (i.e. centroid) of their group (Anderson, 2004). Significance was tested (P < 0.05) after 999 permutations. To assess whether variation in fish assemblage structure was influenced by disturbance, an index of multivariate dispersion (IMD) was calculated for each site from the NMDS, to use in a regression analysis. The IMD was calculated by averaging the dispersion distance, for each of the five repeat surveys, from its site centroid. Once between-site variability in fish assemblages had been calculated, a one-way analysis of variance (anova) was conducted to evaluate whether there was a difference in fish biomass at sites that had less variable fish assemblages (i.e. those with RDI < 80) compared with sites with more variable assemblages (RDI > 80).
Synoptic surveys
The influence of invertebrate biomass (i.e. food availability) on fish biomass was assessed over several years using an anova with year as a random blocking factor. Following this analysis, the relative importance of disturbance-related changes to physical habitat and food availability for fish biomass was determined. A path analysis was used to separate the effect of disturbance on fish food supply (i.e. indirect disturbance effect) from the direct physical effect of disturbance, so that the relative importance of the two components on fish biomass could be compared (H4).
Results
Model selection indicated that, of the five abiotic factors evaluated (i.e. disturbance – RDI, habitat size, water temperature, substratum particle size and canopy cover), disturbance explained the most variation in fish assemblages. Across the five models (one per factor), the disturbance model garnered over 99% of all model weight. Based on evidence ratios, the disturbance model was >10 000 times more likely than the next best model (as predicted in H1). Thus, analyses focussed on quantifying disturbance and understanding how it influenced fish assemblages.
Disturbance measures and their relationship with fish assemblage responses
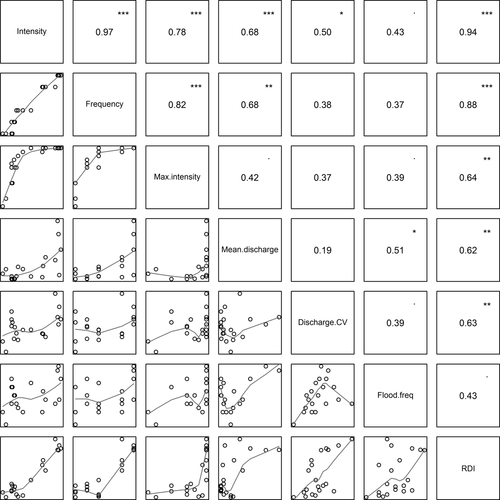
Three disturbance measures based on bed movement were highly intercorrelated (r = 0.78–0.97) (Fig. 3). Bed-movement measures were also partially correlated with hydrological measures (r = 0.37–0.68), and these flow-based measures were intercorrelated (r = 0.19–0.51) but to a lesser extent than bed-movement measures (Fig. 3). The RDI correlated more strongly with bed-movement measures (r = 0.64–0.94) than with hydrological measures (r = 0.43–0.63). Across the range of mean RDI values observed at each site, 57–140, RDI and disturbance intensity (i.e. mean proportion of painted particles moved during the study) were the most highly correlated disturbance measures (r = 0.94). There were no significant relationships between substratum particle size (d50) and any of the disturbance measures (all R² < 0.08, P > 0.05).
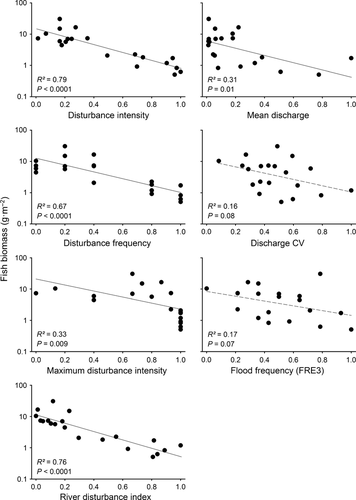
For the four fish assemblage metrics calculated using data from the repeat surveys, disturbance measures that incorporated some element of bed movement (e.g. RDI or painted tracer particles) were better predictors of variation than hydrological measures (Table 2) (as predicted in H2). Only one of the three hydrological measures had a significant relationship with fish biomass, whereas the RDI and bed-movement measures were all significant (P < 0.05) predictors of fish biomass (Fig. 4). The RDI was consistently in the top two measures for all fish assemblage responses and was subsequently ranked as the top disturbance measure to be used in later analyses (Table 2). Disturbance intensity was the top predictor of fish biomass, but ranked second when averaged across all fish assemblage responses (Table 2). The hydrological measure that explained the most variation in fish communities was discharge CV, although it was not ranked in the top two measures for any of the four fish assemblage metrics.
| Disturbance measure | Biomass | Biomass variability (CV) | Assemblage structure (NMDS axis 2) | Assemblage variability (IMD) | Average (rank) |
|---|---|---|---|---|---|
| Disturbance intensity | 0.79 | 0.45 | 0.47 | 0.64 | 0.59 (2nd) |
| Disturbance frequency | 0.67 | 0.40 | 0.33 | 0.56 | 0.49 (3rd) |
| Max. disturbance intensity | 0.33 | 0.22 | 0.15 | 0.24 | 0.24 (5th) |
| Mean discharge | 0.31 | 0.11 | 0.36 | 0.12 | 0.23 (6th) |
| Discharge CV | 0.16 | 0.44 | 0.24 | 0.27 | 0.28 (4th) |
| Flood frequency (FRE3) | 0.17 | 0.01 | 0.28 | 0.02 | 0.12 (7th) |
| River disturbance index | 0.76 | 0.57 | 0.49 | 0.71 | 0.63 (1st) |
- CV, coefficient of variation; IMD, index of multivariate dispersion.
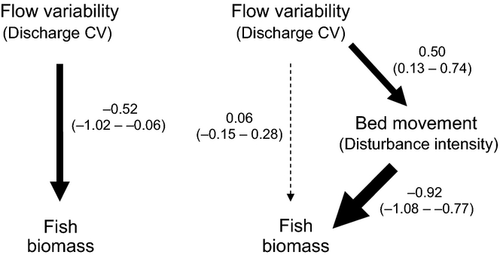
Disturbance measures with a strong bed-movement focus were clearly better predictors of fish assemblage responses, so a path analysis was used to determine why bed-movement relationships were stronger than those associated with hydrologic variability. Path analysis of the repeat survey data showed there was a significant total effect of flow variability on fish biomass, which was dominated by the significant indirect path linking flow variability to fish biomass via bed movement (Fig. 5). For the indirect path, the path coefficient for the link between flow variability and bed movement was significant and positive, whereas the link from bed movement to fish biomass was significant and negative. The direct path between flow variability and fish biomass was not significant, and this path accounted for <12% of the total effect. In contrast, the indirect path was significant and comprised >88% of the total effect of flow variability on fish biomass, indicating that the effect of disturbance on fish biomass was largely due to flow-mediated bed movement rather than flow variability per se.
The influence of disturbance on spatial and temporal variation in fish communities
Mixed-effects models were used to investigate the relationships between biomass and disturbance whilst taking into account between-site variability in this relationship. Comparison of AIC values for models with different specification of random effects indicated that the full model, in which random effects were specified to model between-site variation around both the intercept and slope of disturbance on biomass, had the best goodness of fit. The full model had an AIC value of −0.45 in comparison with 11.33 when the random effect on slope was removed and 4.31 when all random effects were removed. This indicated that there were between-site differences in the relationship between biomass and disturbance. The full mixed-effects model showed that variation in fish biomass was strongly associated with changes in disturbance even after accounting for site-specific differences (Wald test: F1,79 = 38.46, P < 0.001).
To illustrate the influence of disturbance on fish communities, linear regression analysis was conducted. This clearly showed that, as disturbance increased, fish biomass declined and temporal variability in fish biomass increased (Fig. 6a,b). Thus, despite disturbed streams having relatively low biomass, these sites experienced large fluctuations in fish biomass over the course of the study, whereas fish biomass in less disturbed streams was generally higher and less temporally variable.
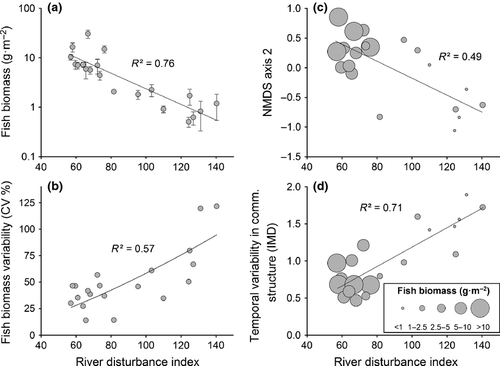
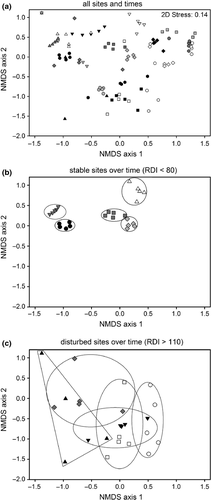
A total of eight fish species were captured during the repeat surveys, and site was clearly an important factor influencing variation in fish assemblage structure (Fig. 7a). NMDS axis 1 was correlated with compositional changes in fish species biomass, particularly trout biomass (Table 3), whereas NMDS axis 2 was positively correlated with total fish biomass and negatively correlated with disturbance (Table 3, Fig. 6c). The significant negative correlation between NMDS axis 2 and disturbance indicated that fish assemblage structure changed predictably along the disturbance gradient. Stable assemblages were dominated by A. dieffenbachii (longfin eels) and disturbed assemblages by G. paucispondylus (alpine galaxias) (Table 3).
| NMDS axis 1 | NMDS axis 2 | |
|---|---|---|
| Fish biomass | ||
| Total | +0.39 | +0.76*** |
| Longfin eel | +0.23 | +0.55* |
| Brown trout | +0.79*** | +0.38 |
| Rainbow trout | −0.72*** | +0.34 |
| Canterbury galaxias | +0.05 | −0.23 |
| Alpine galaxias | −0.23 | −0.45* |
| Upland bully | +0.23 | −0.04 |
- Significance values are: * = P < 0.05, ** = P < 0.01, *** = P < 0.001.
There were large between-site differences in assemblage structure, but an analysis of multivariate dispersion distances (IMD) using the NMDS ordination showed that samples from disturbed sites (i.e. those with RDI > 110) were significantly more dispersed in ordination space than those from more stable sites (i.e. those with RDI < 80) (PERMDISP analysis: F19,99 = 6.05, P = 0.001). Thus, although there was high overlap in assemblages from stable and disturbed sites, biomass and species composition within disturbed sites was much more variable than within stable sites (e.g. Fig. 7b,c). This was also evident in a regression of IMD against disturbance (Fig. 6d) because, as disturbance increased, fish assemblage structure was significantly more variable (R² = 0.62, P < 0.0001). Sites that were stable with less variable assemblage structure also had significantly higher fish biomass than more disturbed sites (one-way anova: F1,19 = 66.27, P < 0.0001, Fig. 6c,d). Overall, these results provide evidence to support H3 because disturbance strongly affected both the predictability and temporal variability of fish assemblage structure.
Were fish communities influenced by food- or habitat-related factors?
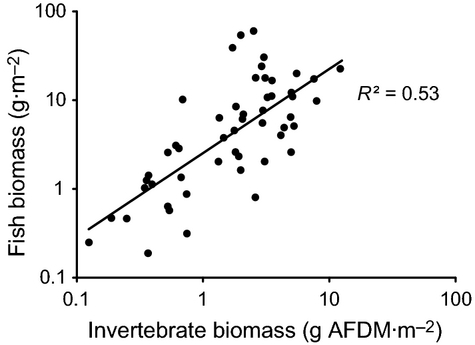
Synoptic survey results indicated that as the biomass of aquatic invertebrates increased, so did the biomass of stream fish at the 52 sites sampled (randomised block anova: F1,49 = 10.26, R² = 0.58, P < 0.0001). The positive slope and y-intercept of this fitted relationship (y = 2.28x0.96) indicated that, across our invertebrate biomass gradient, a 1-g increase in invertebrate biomass (g AFDM m−2) corresponded to c. 2 g of extra fish biomass (g wet mass m−2) being supported (Fig. 8).
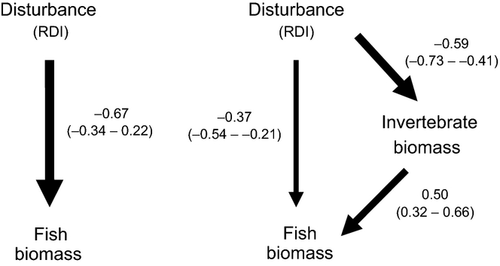
The path analysis described previously (Fig. 5) linked bed disturbance and fish biomass. Results from the synoptic survey were used to further elucidate the food- and physical habitat-related components of the bed disturbance effect. The second path analysis evaluated the relative importance of the direct physical habitat path from bed disturbance to fish biomass compared with the indirect pathway involving food availability for fish (disturbance→invertebrates→fish). The total effect of disturbance on fish biomass was significant and negative, and fish biomass responded similarly to both direct and indirect paths (Fig. 9). Both paths significantly affected fish biomass, with the direct and indirect paths comprising 55 and 45% of the total effect, respectively. Thus, this is evidence to support H4 because both physical disturbance of the bed by itself and the deleterious effects of bed disturbance on fish food supplies were involved in disturbance-related reductions in fish biomass.
Discussion
The responses of stream biota to variation in disturbance
Fish assemblages vary in their response to disturbance, but they should be more persistent in stable sites compared with those subject to unpredictable floods (Grossman, Moyle & Whitaker, 1982). In this study, fish biomass and assemblage structure were much less temporally variable at stable sites than at disturbed streams, which is consistent with findings from North American fish communities (Matthews, Cashner & Gelwick, 1988). Temporal variability in fish biomass and assemblage structure was expected to increase as streams became more disturbed, because fish are usually slow to recolonise once lost. This increased fish assemblage variability is probably linked to the successional processes that occur following a disturbance (i.e. algal growth and invertebrate recolonisation) before significant fish populations can re-establish (Fisher et al., 1982; Taylor & Warren, 2001), demographic effects associated with a particular fish density (e.g. assemblages with low fish density are less buffered against the effects of disturbance) and the traits of fish species associated with tolerance of particular environmental conditions (e.g. short life history and small body size for fish in disturbed streams).
Variation in species traits can strongly shape assemblage structure across natural disturbance gradients because predatory species are adapted to exploit a particular set of conditions (i.e. habitat types and prey species) across this gradient (Wellborn et al., 1996). Flood-related disturbance events can result in severe fish mortality, especially in smaller species (Hayes, Olsen & Hay, 2010; Jellyman & McIntosh, 2010), although the response of fish abundance to flooding is often species specific (Jowett, Richardson & Bonnett, 2005). Traits such as large body size may confer a competitive advantage for species in stable habitats but may disadvantage the same species in more disturbed environments, where conditions generally favour species with smaller, slender body shapes. The NMDS indicated that an assemblage shift occurred across the disturbance gradient with larger-bodied species, such as longfin eel, strongly associated with stable habitats, whereas much smaller fish (e.g. alpine galaxias) were more common at more disturbed sites. This implies that disturbance selects for fish traits which may also partially explain why variation in fish biomass and assemblage structure was predictable both spatially and temporally. Thus, even though the intensity and frequency of disturbance events in these New Zealand catchments are generally unpredictable at short timescales, due to storm events occurring at any time of the year (Winterbourn, Rounick & Cowie, 1981), stochastic environmental factors can result in highly predictable fish communities. Lepori & Malmqvist (2007) similarly found that changes in invertebrate community structure were predictable across the disturbance gradient, concluding that disturbance effects on basal resources partially explained the predictability of community structure. Disturbance of species low in the food web is likely to be a key mechanism at play in both studies, with the predictable structuring of fish assemblages probably a consequence of both the disturbance gradient and a predictable change in invertebrate assemblage composition across the disturbance gradient (Death, 1995; P. Jellyman, unpubl. data).
Aquatic invertebrates are the main food of many temperate stream fish, so it is not surprising that strong predatory interactions have been reported between invertebrates and fish in these stream systems (e.g. Power et al., 1985; Huryn, 1998; Nyström et al., 2003). Despite this, the supposed importance of bottom-up effects in structuring fish assemblages has been minimised by the many studies reporting significant effects of flow variability on fishes (e.g. Jowett, 1990; Poff & Allan, 1995; Freeman et al., 2001). Such research has often focussed strongly on physical habitat changes due to disturbance, with much less attention on the consequences of alterations for fish food supplies. Our second path analysis showed that both the deleterious effects of bed disturbance on fish food supply and physical disturbance of the bed itself were responsible for disturbance-related reductions in fish biomass, not flow variation per se. Whilst both physical habitat and food-related disturbance effects probably contribute to fish leaving a stream reach, this analysis indicated that changes in food availability accounted for almost half of the observed variation in fish biomass. Research into the role of disturbance on stream fish has often ignored the importance of food availability, with the underlying assumption that, by quantifying changes in fish physical habitat, variation in fish food supply will be incorporated. However, our results suggest that changes to both components (i.e. physical habitat and food supply) need to be quantified to fully understand how fish assemblages respond to flood disturbance.
Disturbance measures as predictors of fish communities
Many researchers have attempted to determine the most appropriate measure of disturbance in stream habitats for correlation with ecological communities, concluding that measures need to characterise disturbance events by encapsulating spatial and temporal variability in flow regimes (e.g. Resh et al., 1988; Poff & Ward, 1989; Sabo & Post, 2008). However, studies that have compared hydrological and bed-movement disturbance effects on benthic invertebrates (e.g. Death & Winterbourn, 1994; Townsend et al., 1997) have found that bed-movement measures, including the RDI that has a major bed stability component, were better predictors of invertebrate community responses to disturbance than hydrological measures (Schwendel et al., 2011). In stream fish assemblages, variation in disturbance has been inferred from measures derived mainly from hydrological time-series, with the use of bed-movement measures to predict changes in fish assemblage structure receiving little attention. Our results suggest that, even though hydrological regime and bed movement are strongly correlated, fish communities are more likely to respond to changes in bed movement (mediated by hydrological regime), rather than directly to flow. These results do not contradict the numerous studies that have found important effects of hydrological regime on fish assemblages (e.g. Grossman et al., 1982; Jowett, 1990; Poff & Allan, 1995), nor do they deny the importance of hydrological effects on fish communities, since hydrological measures were still a significant predictor of fish responses in many analyses. However, they do suggest that current approaches to estimating disturbance effects on fish could be improved. This research showed that measuring disturbance due to bed movement significantly improved the accuracy of fish assemblage analyses, and below we suggest how this finding can be applied to advance our understanding of stream community responses to disturbance.
Whilst disturbance-induced variation in bed movement may be more biologically meaningful for fish communities than a disturbance measure derived from flow variation, disturbance measures need to be able to be applied to existing and future data sets if they are to be of practical use. Directly measuring bed movement (i.e. using painted tracer particles) is time intensive, requires regular field visits and represents only a discrete time period, which are major disadvantages compared with hydrological measures. In contrast, flow time-series data can readily be modelled once flow recorders are installed and calibrated (although site visits are still required to check rating curves). As an alternative to intensive bed-movement measures, the RDI can give a quick, reach-scale assessment of channel stability providing a disturbance measure that is strongly correlated with flow regime, but particularly with direct measures of bed movement. The RDI has been criticised for being subjective and prone to observer bias (Duncan, Suren & Brown, 1999), although the streambed component of the index and the full index are closely related to other flood disturbance measures (Death & Winterbourn, 1994; Townsend et al., 1997; McIntosh, 2000). Moreover, the full RDI was the best overall predictor of disturbance-induced changes in fish assemblages across a range of response variables in this study, so the RDI can be used as a surrogate for direct bed-movement measures, offering trained researchers a pragmatic method for predicting the disturbance regime experienced by a particular stream fish assemblage. Furthermore, the RDI is useful for predicting a range of stream community responses to disturbance (e.g. food chain length; McHugh et al., 2010).
As the frequency and intensity of climatic events causing disturbance are predicted to increase in coming years (IPCC, 2007), research that addresses how communities respond to variation in disturbance will be increasingly required. Flood-related disturbance events can have direct and indirect effects on communities, so understanding which pathway(s) is actually influencing species assemblages is often complex. Unravelling this complexity requires disturbance measures that reflect the mechanisms driving community change. We suggest that such measures should be based on bed movement not hydrological variability, because bed movement determines not only the community structure of lower trophic levels (e.g. Death & Winterbourn, 1994; Townsend et al., 1997) but also that of fish assemblages via many of the same mechanisms. Furthermore, since invertebrate biomass is a major determinant of fish abundance, we would argue that a greater recognition of the importance of prey availability in structuring fish assemblages is required to advance our understanding of disturbance effects.
Acknowledgments
We thank Brendan Coffey, Christa Jellyman, Don Jellyman, Matthew Langley and Simon Howard for assistance in the field and Colin Townsend, Colden Baxter, Mike Winterbourn and two anonymous referees for comments on earlier versions of the manuscript. Pete McHugh assisted with path analyses, and we are grateful to the Department of Conservation and the managers of Castle Hill and Brooksdale Stations who granted access to sites. Surveys were conducted with the approval of the University of Canterbury Animal Ethics committee. The research was funded by the University of Canterbury and the Brian Mason Scientific and Technical Trust, and funding to PGJ and DJB by NIWA under Freshwater and Estuaries Programme 2, Sustainable Water Allocation (2012/13 SCI), assisted with manuscript preparation.


