Metacommunity structure of aquatic gastropods in a river floodplain: the role of niche breadth and drift propensity
Summary
-
Metacommunity ecology predicts the relative importance of environmental and spatial processes in the structure of species assemblages. Such processes may act differentially on subsets of the community characterised by specific traits. To gain a deeper insight into these mechanisms, we supplemented a common method of studying metacommunities with an analysis of individual species and their traits.
-
River floodplains are challenging environments for metacommunity analysis due to their spatial heterogeneity, temporal stochasticity and configurations of the networks of waterbodies.
-
An analysis of aquatic gastropods showed that both environmental and spatial factors had significant influence. Within the spatial variables tested, the configuration of the floodplain network upstream of a sampling site was particularly important. An analysis of individual species revealed that traits related to niche breadth and drift propensity were significant for structuring the assemblages: species with a broad niche width (i.e. generalist, or neutral species) and a high drift propensity were governed more by the spatial configuration, whereas environmental conditions mainly determined the distribution of specialists having traits that prevented drift.
-
These results can be interpreted as a trade-off between habitat specialisation and colonisation ability: specialists succeed locally due to competitiveness and a strategy of reducing risks by preventing drift, whereas generalists may succeed regionally due to a strategy of spreading risks, by high levels of reproductive output, dispersal rates and adaptability.
-
Our findings have implications for schemes to restore river floodplains that affect the aquatic network, with subsequent effects on community assembly and thus on biodiversity.
Introduction
One of the important advances in ecology in recent decades has been the recognition that local communities are products of processes at both local (niche assembly) and regional (dispersal assembly) scales (Ricklefs, 1987). The relative importance and interactions of these processes are addressed by metacommunity ecology (Tokeshi, 1990; Leibold & Miller, 2004; Leibold et al., 2004; Driscoll, 2008). Within this framework, the structure of natural communities is explained through ‘niche-based’ mechanisms, assuming that ecological traits differ among species, and ‘neutral’ theories based on the premise that species are ecologically equivalent, emphasising the importance of dispersal (Hubbell, 2001; McGill, 2003; Chave, 2004; Leibold et al., 2004). Leibold et al. (2004) synthesised empirical and theoretical knowledge and formulated four paradigms that predict patterns in natural communities and that may explain the generation and maintenance of diversity. The models are known as neutral, patch dynamics, species sorting and mass effect. The last three consider differences among species, and the last two additionally consider environmental differences. Logue et al. (2011) and Winegardner et al. (2012) suggest that metacommunity ecology should move on from seperating four discrete paradigms to testing the underlying mechanisms and relative importance of spatial and local processes.
Recent studies have shown that the predominant species traits of the community studied, such as mechanism or speed of dispersal and niche breadth, predicted part of the detected variation in the structure of metacommunities (Van de Meutter, De Meester & Stoks, 2007; Pandit, Kolasa & Cottenie, 2009; Brown & Swan, 2010; Altermatt et al., 2011). To gain a deeper insight into these processes, the characteristics of the individual species should thus be included in analyses; in other words, the metacommunity approach should be supplemented by an analysis of individual species and their traits (Driscoll & Lindenmayer, 2009).
This study focuses on river-floodplain systems, which are especially challenging from a metacommunity point of view. Beside the spatial heterogeneity and the high and often stochastic temporal variability of environmental conditions, they are characterised by the network configuration of their waterbodies and dispersal directionality. These challenges can also be seen as opportunities to expand the field of metacommunity ecology and establish a broader framework that contributes to floodplain ecology (cf. Logue et al., 2011). Recent studies have shown that spatially constrained network connectivity is a key factor for community composition and population persistence (Carrara et al., 2012) as well as biodiversity (Muneepeerakul et al., 2008) and diversity in local communities is strongly influenced by directionally biased dispersal (Altermatt, Schreiber & Holyoak, 2011).
The role of spatiotemporal heterogeneity in determining aquatic communities of rivers and their floodplains has been a central theme of research in recent decades. Most studies have emphasised the significance of the physical conditions of habitats and niche differences of species, while the spatial configuration of habitat patches and dispersal mechanisms of species were largely ignored (see Winemiller, Flecker & Hoeinghaus, 2010). We believe that dispersal must not be disregarded in river-floodplain systems although given the high spatial heterogeneity it may be that niche differentiation is the most important process in generating and maintain diversity. Furthermore, river floodplains are often highly stochastic systems. Stochasticity and the related unpredictability of abiotic conditions may impede adaptations to specific environmental conditions and may thus favour habitat generalists (i.e. species that are neutral with respect to habitat). Such communities can be expected to be structured by regional spatial processes (Pandit et al., 2009).
One characteristic of river-floodplain systems is the network configuration of the waterbodies, which are linked by unidirectional flow from upstream to downstream. The main mode of colonisation under such conditions is dispersal by drift. We therefore assume that the configuration of the network upstream of a site is more influential than its arrangement downstream. We further argue that drift prevention and associated traits are essential because they allow the maintenance of position in a flowing environment. This is crucial for specialist species to decrease the chance of dislocation into unfavourable habitats but less important for generalist species that can deal with a broader range of conditions. Niche breadth and drift propensity should thus be linked. Evidence for a positive relationship between niche breadth and rates of dispersal was found by McCauley (2007) and Bonte et al. (2003) for odonates and spiders, respectively. We expect this relationship to be general and to have a significant effect on the relative importance of local compared to regional processes for metacommunity structure.
To test such ideas, Dumbrell et al. (2010) suggested that an ideal study community should be functionally important, species-rich and show a priori evidence of both niche and dispersal assembly. Aquatic gastropods fit these criteria. They enhance microbial growth and nutrient cycling by their mixing of surface sediments and breakdown of organic detritus (Covich, Palmer & Crowl, 1999). Floodplains host a very rich fauna of aquatic gastropods, and physical conditions have a major bearing on distribution and richness (Reckendorfer et al., 2006). Drift and drift prevention are relevant for juvenile and adult gastropods (Dillon, 2000; Mouthon & Daufresne, 2006; Kappes & Haase, 2012). Since the mobility of gastropods is low, passive drift mechanisms outweigh active movement between patches.
- Both environmental and spatial factors have a significant impact.
- The aquatic network and its unidirectional arrangement play important roles.
- The distribution of specialist species can be better explained by local mechanisms, whereas the diversity of generalists is more strongly governed by regional processes.
- The distribution of species with traits preventing drift is better explained by local processes, whereas regional processes determine the distribution of species with a high propensity for drift.
- Niche breadth and drift propensity are positively correlated and equally explain the relative importance of local compared with regional processes for the distribution of species.
The analysis is based on an assessment of the gastropod fauna of the whole river-floodplain network. We use pooled species data to define an ‘average’ metacommunity. The data set consists of 47 waterbodies differing in their spatial (i.e. spatial connectivity within the network) and environmental (i.e. local physical habitat) characteristics. To assess the relative importance of local (e.g. competition, predation) and regional (i.e. dispersal) processes, we performed a variance partitioning procedure according to Borcard, Legendre & Drapeau (1992). To gain further insight into the significance of species traits (e.g. dispersal ability, niche breadth), their interdependencies and potential trade-offs for community assembly, we also investigated the distribution of individual species.
Methods
Study area: the Donau-Auen National Park in Austria
The Danube River, the second largest river in Europe, is 2900 km long and drains an area of 817 000 km2. At Vienna, the Danube is a ninth-order river with a mean annual discharge of about 1950 m3 s−1 and a bankfull discharge (recurrence time of c. 1 year) of 5800 m3 s−1. The average slope in this section is 0.45‰. In 1996, the floodplain east of Vienna was given the status of a national park [Schiemer, Baumgartner & Tockner, 1999; Donau-Auen National Park (DANP), Fig. 1].
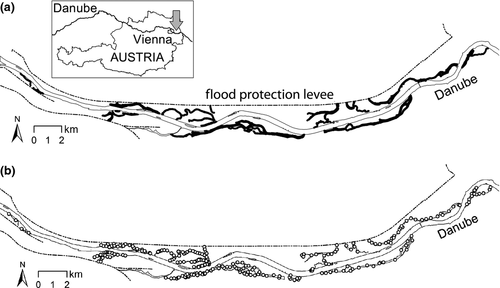
Historically braided, the floodplain has been constrained by major regulations that began in 1875. Due to ongoing measures of restoration (Tockner, Schiemer & Ward, 1998; Schiemer et al., 1999; Reckendorfer et al., 2005), the DANP now contains sections of differing connectivity, ranging from predominantly lentic waterbodies to areas of intermediate and high connectivity (Baranyi et al., 2002; Reckendorfer et al., 2006).
Delineation of waterbodies
Waterbodies (sections) in the floodplain were delineated from aerial photographs based on inflow areas, transverse check dams and points of intersection within the network. The analysis contained 47 sections representing the entire floodplain.
Sampling
The data set we used for our analysis consisted of 275 individual mollusc samples taken in different years (Fig. 1b). The whole floodplain network, delimited by flood-protection levees, was sampled for the mollusc community (i.e. c. 90% of the water area). Several locations were sampled more than once. We used pooled species data for each of the 47 waterbodies to define an ‘average’ metacommunity.
Molluscs were collected using a sediment dredge with an average sediment sample volume of 7 L (0.5–16 L). Dredge samples were complemented with manual collection of individuals for 10 min along the shoreline. When macrophytes were present, an c. 50-cm-long piece of the plant was taken into a bag, rinsed carefully over a 1-mm sieve, and the plant biomass and sieve residue were carefully screened for molluscs. This procedure guaranteed that small bottom dwelling molluscs as well as large infrequent taxa were detected. Sampling was confined to the littoral zone at depths between 0 and 140 cm. Molluscs were counted and identified to species following Glöer & Meier-Brook (1994).
Data for presence and absence were created for each section based on two (small waterbodies) to eleven (large waterbodies) individual samples. We thus provide an analysis of the ‘average’ metacommunity structure of the gastropod community. Only mollusc species present in more than 10% of the waterbodies were used in the analysis.
Environmental factors
- Days of hydrological connectivity (hco) to the main channel (Reckendorfer et al., 2006), ranging from 0 (lentic) to 365 (permanent lotic conditions);
- Direct solar radiation (sol): The theoretical hours of direct sunlight per day calculated for May 30th based on surface levels and height of adjacent riverine vegetation as a surrogate for autochthonous production due to irradiation and allochthonous energy input from autumnal leaf fall averaged for each waterbody;
- Sinuosity ratio (sin): The distance along a channel divided by the straight-line distance from inflow to outflow;
- The Euclidean distance from the main stem of the Danube to the centre (dac) and to the nearest edge (dae) of a waterbody as a surrogate for the influence of the ground water;
- Depth (dep): Greatest depth of a section calculated for the mean discharge of the Danube as a measure of permanence; calculations are based on a groundwater model and a digital terrain model;
- The largest grain size present (gsz): recorded at each sampling point in the field and averaged for each waterbody;
- Percentage of fine sediment <1 mm in the uppermost sediment layer (fse): recorded at each sampling point in the field and averaged for each waterbody.
Spatial structure

We calculated several variables of habitat connectivity (see Fig. 2 for a graphical representation):
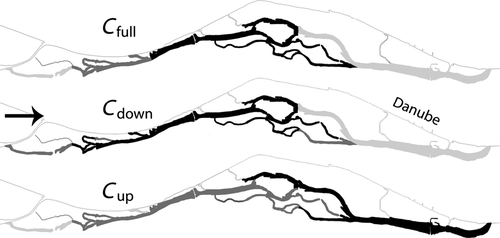
- All waterbodies were treated as equal, that is, we neglected direction of flow (Cfull).
- Downstream connectivity (Cdown) is important and emphasises active upstream movement of organisms. Cdown was calculated including only the network downstream of the section.
- Only upstream connectivity (Cup) is important, placing emphasis on mechanisms of drift:
- All upstream waterbodies have equal influence. Cup1 was calculated including only the network upstream of the section.
- Only waterbodies showing equal or higher connectivity than the waterbody of interest (i.e. at least equally lotic) have a relevant impact. Cup2 was calculated including only the waterbodies upstream of the section that were at least equally lotic.
- To account for the frequency of exchange processes, we calculated Cup3 and Cup4 by weighting network lengths with hydrological connectivity as length (m)*(365-hco)/365; the variables of connectivity where then calculated analogous to Cup1 and Cup2.
Species traits
We selected traits that were related to drift propensity/colonisation (Falkner et al., 2001): (i) the number of eggs or live young (egg) and (ii) ovovivipary or pasting capsulated eggs on conspecifics (brood) (see Table S1). In passive dispersers, the production of large numbers of offspring improves the ability to colonise (Kneitel & Chase, 2004). Parental care (ovovivipary or pasting eggs on conspecifics) associated with a low number of offspring is a good surrogate for competitive ability. High numbers of small eggs relate to a high colonisation ability/drift propensity.

Data analysis
Before any analyses, predictor variables were transformed (arcsine transformation for fse and sin, log transformation for dae and gsz and square root transformation for hco) to reduce the skewness of the data. To analyse the importance of the different environmental and spatial patterns for the metacommunity structure, R package ‘packfor’ was used to conduct a redundancy analysis (RDA, R Development Core Team, 2011) based on Hellinger-transformed presence/absence data with forward selection to partition the variance between spatial and environmental variables (Borcard et al., 1992).
The importance of the different environmental and spatial variables for single species was analysed by univariate variance partitioning. To accommodate zero-inflated data (none of the species was present in more than two-thirds of the waterbodies), abundance data were transformed to presence/absence and analysed by logistic regression. The method is frequently used in various modelling approaches and shows good performance in comparison with other methods (e.g. Ennis et al., 1998; Elith & Graham, 2009). Abiotic and spatial variables were fit separately with forward selection. Only variables explaining at least 10% of the total variation were included in the analysis. When abiotic and spatial variables were found to be relevant, variance partitioning was used to determine the relative amount of variation exclusively explained by the two matrices of explanatory variables by excluding shared variation. To test for the impact of sampling effort, a logistic regression was conducted for each species using the number of samples per waterbody as an independent variable. Species showing a significant relationship were excluded from further analysis. Logistic regression was conducted using SPSS for Windows, Version 12.0. (SPSS Inc., Chicago, IL, USA).
Correlation and regression analyses were used to analyse the relationship between the explanatory value of local and regional variables and species traits.
A principal component analysis (PCA) was performed to visualise associations between niche breadth, dispersal propensity and the importance of environment and space.
Results
Metacommunity analysis
Multivariate variance partitioning revealed that both environmental variables and spatial configuration had significant effects on community structure (Table 1). Spatial connectivity explained c. 7% of the total variance; only upstream connectivity (Cup3 and Cup4) was relevant. Local environmental variables, namely hydrological connectivity and distance to the main stem of the river, equally explained about 7%. Three per cent of the variance was shared between physical environment and spatial configuration.
| Source of variation | Significant variables | Variance explained (%) |
|---|---|---|
| Environment | hco, dae | 6.9 |
| Space | Cup4, Cup3 | 7.3 |
| Environment + Space | 2.9 |
Species analysis
Logistic models showed that the relative importance of environmental compared with spatial variables in determining the distribution of gastropods differed between species. The distributions of six species were determined only by environmental variables (38% of all species); only spatial variables were relevant for three species (19%). Two species were significantly affected by both (13%). Neither environmental nor spatial variables explained a significant proportion of the variation for Gyraulus laevis, Physella heterostropha, Stagnicola fuscus, Planorbis planorbis and Radix peregra (Table 2). These species were excluded from the univariate analysis of species traits.
| Species | Code | R2 environment | Environmental variable | R2 space | Spatial variable | R2 environment and space |
|---|---|---|---|---|---|---|
| Bithynia tentaculata | Bten | 0.00 | 0.24 | +Cup4 | 0.00 | |
| Galba truncatula | Gtru | 0.10 | +dep | 0.00 | 0.00 | |
| Gyraulus laevis | Glae | 0.00 | 0.00 | 0.00 | ||
| Lithoglyphus naticoides | Lnat | 0.26 | +sol | 0.00 | 0.00 | |
| Lymnaea stagnalis | Lsta | 0.10 | +dac | 0.00 | 0.00 | |
| Physella acuta | Pacu | 0.01 | −sol | 0.18 | +Cup3 | 0.10 |
| Physella heterostropha | Phet | 0.00 | 0.00 | 0.00 | ||
| Planorbarius corneus | Pcor | 0.19 | −dep | 0.19 | +Cup4 | 0.01 |
| Planorbis planorbis | Ppla | 0.00 | 0.00 | 0.00 | ||
| Potamopyrgus antipodarum | Pant | 0.11 | +dep | 0.00 | 0.00 | |
| Radix auricularia | Raur | 0.00 | 0.11 | +Cup2 | 0.00 | |
| Radix ovata a | Rova | 0.21 | +sol+hco | 0.01 | +Cup3 | 0.11 |
| Radix peregra | Rper | 0.00 | 0.00 | 0.00 | ||
| Stagnicola fuscus | Sfus | 0.00 | 0.00 | 0.00 | ||
| Valvata piscinalis | Vpis | 0.13 | −hco | 0.28 | +Cup4 | 0.04 |
| Viviparus contectus | Vcon | 0.18 | −hco | 0.00 | 0.00 |
- Bold numbers indicate P < 0.05 for at least one variable in the partial effect.
- a Radix ovata showed significant correlation with sampling effort and was thus excluded from further analysis.
Relationships between species traits and local and regional factors
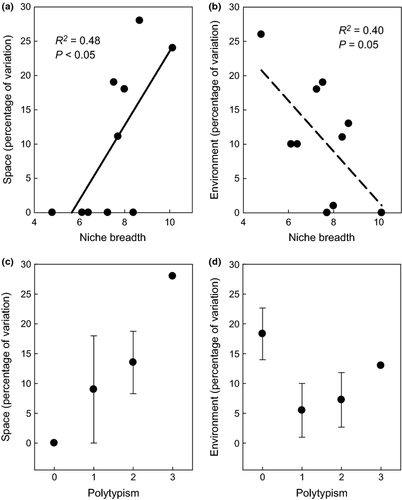
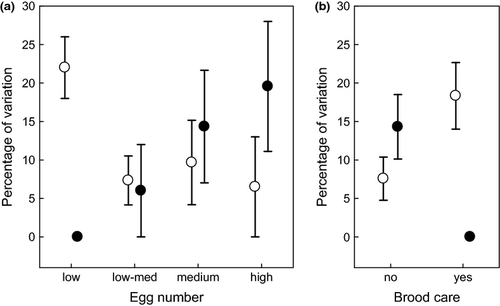
For single species, the explanatory value of the spatial variables in explaining patterns of distribution increased significantly with niche breadth (Fig. 3a; Pearson's correlation: R = 0.71, P < 0.05) and degree of polytypism (Fig. 3c; Spearman's correlation: R = 0.75, P < 0.05). An inverse relationship was found between the explanatory value of environmental variables and niche breadth (Fig. 3b, Pearson's correlation: R = −0.63, P = 0.05). The relationship for polytypism was not significant (Fig. 3d, Spearman's correlation: R = −0.35, P = 0.33). The explanatory value of the spatial variables was positively correlated with drift propensity, as indexed by egg number (Fig. 4a; Spearman's correlation: R = 0.67, P < 0.05) and presence or absence of brood care (Fig. 4b; Spearman's correlation: R = −0.61, P < 0.1, Mann–Whitney: U = 3, P < 0.1). The distribution of species showing brood care and low fecundity was less determined by regional spatial mechanisms than was the distribution of prolific species without brood care. The importance of the environmental variables decreased with egg number (Fig. 4a; Spearman's correlation: R = −0.45, P = 0.19) and brood care (Fig. 4b; Spearman's correlation: R = 0.57, P < 0.1, Mann–Whitney: U = 3, P < 0.1).
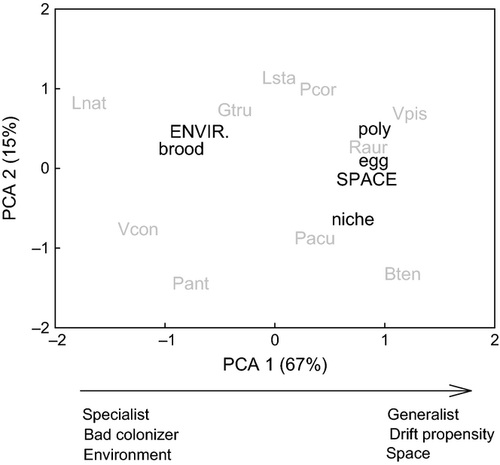
Principal component analysis produced one significant axis (PC axis 1) that explained 67% of the total variance (Fig. 5, Table 3). This axis showed a strong positive correlation with niche breadth, polytypism, egg number and importance of space (configuration of the network) and a negative association with brood care and the importance of the physical environment. Species were sorted in this gradient from specialists with a low ability to colonise and determined by the physical environment to generalists with a high ability to colonise (high drift propensity) and determined by regional spatial structure.
| PC axes | ||
|---|---|---|
| PCA 1 | PCA 2 | |
| Environment | −0.665 | −0.206 |
| Space | 0.841 | 0.245 |
| Niche | 0.730 | 0.646 |
| Poly | 0.905 | −0.360 |
| Egg | 0.911 | −0.177 |
| Brood | −0.854 | 0.384 |
Discussion
The analysis of the aquatic gastropod metacommunity revealed that processes of both niche and dispersal assembly affect the distributions of species and patterns of richness. Our results are also in accordance with several studies of freshwater ecosystems showing a general trend of communities in rivers and interconnected waterbodies being more strongly related to spatial structure than are those of stagnant, isolated bodies of water (Cottenie et al., 2003; Urban, 2004; Cottenie, 2005; Vanschoenwinkel et al., 2007; Ledger et al., 2008; Muneepeerakul et al., 2008; Brown & Swan, 2010). Our analysis also confirmed that the structure of the aquatic network, and especially the direction of habitat linkages, has a major bearing on the assemblage. This relationship held particularly well for the upstream configuration, whereas the structure of the network downstream of a sampling location had no detectable influence. The analysis explained 17% of the variation in the presence/absence matrix of the gastropod metacommunity, and 83% remained unexplained. Seventeen per cent is low compared to some values from different types of ecosystems previously analysed (see Cottenie, 2005). One possible explanation is the stochastic nature of river-floodplain systems (Winemiller et al., 2010). Additionally, the mode of calculating habitat connectivity and missing environmental variables may partly explain the high proportion of unexplained variation, although this is unlikely since we have used the set of variables known to be of most importance in river floodplains. That we describe the ‘average’ metacommunity, beyond short-term temporal effects, may also blur the relationships and decrease explanatory power. However, we suggest that this is the correct scale to link species traits to metacommunity patterns since these species traits are determined on larger spatial and temporal scales (biogeography, evolution).
The analysis of single-species distributions and species traits revealed that the gastropod metacommunity cannot be described by a single paradigm. The importance of local and regional processes for species distribution is highly dependent on the degree of habitat specialisation (niche breadth). Spatial patterns were predominantly associated with generalist (or neutral) species and species sorting associated with specialists: 33% of species whose distribution was solely determined by environmental variables are predominantly habitat specialists, including riverine species such as Lithoglyphus naticoides, Potamopyrgus antipodarum and Galba truncatula and species bound to stagnant waterbodies such as Viviparus contectus and Lymnaea stagnalis. In contrast, the distribution of generalists is more strongly governed by the spatial configuration. Our findings confirm the result of Pandit et al. (2009), who investigated a rock-pool metacommunity of aquatic invertebrates. This suggests that the proportion of specialists to generalists may significantly determine the outcome of metacommunity analyses.
The inclusion of colonisation traits in the analysis allowed us to explain differences in distribution patterns between species and added further insight into the processes of assembly. In fluvial systems, colonisation is ultimately linked to drift in many animal groups. Under such conditions, species with traits that prevent drift are better able to maintain their position in the floodplain network and are consequently less determined by regional processes.
Our combined analysis revealed that a broad niche width and a high drift propensity are to a large extent interlinked: generalists possess life-history traits favouring drift (i.e. high fecundity and no brood care) whereas specialists have life-history traits that bear on drift prevention (i.e. ovovivipary or pasting egg capsules on conspecifics or hard ground). These relationships may be interpreted as trade-offs between habitat specialisation and colonisation ability/drift propensity. Specialists may succeed locally due to competitiveness and a strategy of risk reduction by preventing drift, because the risk is high that their offspring will drift to an unsuitable habitat, whereas generalists may succeed regionally due to a strategy that spreads risk by high reproductive outputs, high dispersal rates and adaptability to various types of habitats. Theoretical (McPeek & Holt, 1992; Doebeli & Ruxton, 1997; Mathias, Kisdi & Olivieri, 2001; Kisdi, 2002) and empirical (Bonte et al., 2003; McCauley, 2007) studies have already indicated the importance of these two alternative strategies for the coexistence of species. We have shown that they are very important for explaining metacommunity structure.
Our findings have several important implications for future research and applications of metacommunity analysis. The inclusion of species traits into metacommunity analysis may significantly improve our understanding of the underlying assembly processes (see also Pandit et al., 2009). Our study, the first to assess the joint impact of colonisation (drift propensity) and habitat specialisation on metacommunity patterns, also showed that a trade-off between the ability to colonise and habitat specialisation may explain the relative importance of local compared with regional conditions for species composition. Further studies of other species groups and systems will determine the generality of our findings. The inclusion of time series may also add to our understanding of the generation and maintenance of diversity. Floodplains are highly stochastic environments, and the time elapsed since a flood may impact the relative importance of the environment and spatial configuration in supporting local and regional diversity.
Our findings also have serious implications for schemes to restore large rivers where the main emphasis is the enhancement of the lateral integration between the river and its floodplain (Schiemer, 1999; Schiemer et al., 1999; Buijse et al., 2005). The structure of the network and the habitat connectivity of the river-floodplain system are thereby significantly altered, with subsequent effects on the relative importance of spatial and local processes for local diversity. An understanding of the spatial context of river-floodplain networks is thus of central interest for planning measures for the restoration of rivers.
Acknowledgments
This study was financed by an EU Life Project (project number LIFE98NAT/A/005422), the Austrian Federal Waterway Agency, the Nationalpark Donau-Auen GmbH and the city authority of Vienna (MA 45). Aerial photographs were provided by Nationalpark Donau-Auen GmbH. We are grateful to Christian Schulze, Christian Baranyi, Irene Zweimüller and two referees for helpful comments on previous versions of the manuscript.


