Environmental effects on biofilm bacterial communities: a comparison of natural and anthropogenic factors in New Zealand streams
Summary
- We investigated the resident bacterial communities within the biofilm of 252 streams in New Zealand with the aim of assessing the community variation associated with natural and anthropogenic-influenced environmental characteristics. This work is part of a larger project investigating the use of bacterial communities as biological indicators, and here we assess how predictable the variation in bacterial community is in response to environmental influences.
- Samples of epilithic biofilm were collected in the Austral Summer of 2010, and bacterial communities were characterised using the DNA-fingerprinting technique automated ribosomal intergenic spacer analysis (ARISA).
- Multivariate analysis of the ARISA data revealed that geographical location (region) was a better predictor of bacterial community structure than land use.
- Our finding that taxon richness varied with geographical location, decreasing along a north to south (increasing latitude) gradient, and that land use had no significant effect on taxon richness suggests that bacterial communities have great potential to act as biological indicators of stream health. In particular, the maintenance of taxon richness at impacted sites is a key advantage since the local extinction of many traditional indicator organisms, such as fish or macroinvertebrates, often precludes their further use.
- Our conceptual model of bacterial community structure proposes that stream biofilm communities are comprised of four broad groups of bacteria: ubiquitous bacteria (found at all sites), region-specific bacteria (those representative of geographical areas), natural-state bacteria (those associated with unmodified systems) and impact-related bacteria (those associated with human activities). The proportion of these four groups at a particular sample site would provide the basis of a novel bacterial community index of stream health.
Introduction
Recent advances in assessing the health of freshwater ecosystems have included the development of metrics involving multiple measures from a single biological group (Seilheimer & Chow-Fraser, 2006; Walsh, 2006) or a combination of measures from differing biological groups and local habitat characteristics (Emery et al., 2003). In New Zealand, such metrics are generally limited to the analysis of communities of invertebrates (Boothroyd & Stark, 2000; Collier, 2008) and fish (Joy & Death, 2002). However, recent investigations of bacterial biofilm communities using modern molecular biology techniques suggest that these could offer an additional tool for assessing stream ecological health (Lear et al., 2011; Vinten et al., 2011). Bacterial biofilm communities have benefits as indicators since they provide responses to environmental stresses at the basal trophic levels that are detectable before the effects are relayed to upper layers of the stream ecosystem food web (Lewis & Turner, 2003; Lewis et al., 2010). Sampling of biofilm communities requires minimal effort, causes minimal disturbance to the sampling sites and allows repeated sampling at sites with no recovery periods required (Lear & Lewis, 2009; Lewis et al., 2010). Furthermore, bacterial communities can be sampled at sites where other bioindicators, such as benthic invertebrates and fish, are absent (Lear et al., 2012).
Biofilms are complex assemblages of microorganisms living in association with a matrix of extracellular polymeric substances and are found on virtually all surfaces in rivers and streams. They include viruses, bacteria, fungi, algae, protozoans, nematodes and other microorganisms that derive energy and organic matter from autotrophic and heterotrophic metabolism (Lear et al., 2012). Organisms within biofilms are relatively immobile when compared with transient communities within the water column, and therefore, the biofilm community structure is more likely to be associated with localised influences within the sample site. These influences may include changes in temperature (Lyautey et al., 2005; Lear et al., 2008), light (Lear, Turner & Lewis, 2009c) and hydrologic regime (Battin et al., 2003; Lyautey et al., 2005; Besemer et al., 2007). Hence, one would expect differences amongst the biofilm bacterial communities across New Zealand due to the natural diversity in the geography (temperature/altitude), geomorphology and ‘landscape ecology’ of catchments (Poole, 2002; Sigee, 2005; Thorp, Thoms & Delong, 2006). In addition, effects from these natural spatial patterns may be complicated by anthropogenic influences arising from differing land uses. Together, physical habitat and land use characteristics of the catchment influence the hydrology and chemical composition of the surface runoff including biologically important organic matter and inorganic nutrients such as phosphates and nitrates (Poole, 2002; Sigee, 2005).
Natural variation and anthropogenic variation in abiotic factors, such as physicochemical water quality variables (Quinn et al., 1997; Quinn, 2000), are well described for biotic constituents such as fish (Joy & Death, 2002), algae (Biggs, 2000) and invertebrates (Boothroyd & Stark, 2000; Death & Collier, 2010). In contrast, studies on biofilm bacterial communities have focused on large-scale biogeography (Martiny et al., 2006; Battin et al., 2007); consequently information on the relative importance of natural and anthropogenically driven variation in such communities is limited. However, significant differences in stream bacterial biofilm communities were found amongst a limited number of rural and urban catchments in Auckland, New Zealand. This suggests that bacterial communities have potential as indicators of stream ecosystem health provided they respond to natural and anthropogenic drivers in a predictable manner on a larger scale.
To examine the influence of natural and anthropogenic factors on the heterogeneity of stream biofilm bacterial communities, we sampled 252 streams across both the North and South Islands of New Zealand. We used this data set to investigate the relative importance of (i) the natural geographical variation in bacterial community structure and (ii) the relationship of bacterial community structure with land use. This approach allowed us to assess whether bacterial communities responded to catchment land use change consistently at a national scale.
Methods
Sample collection
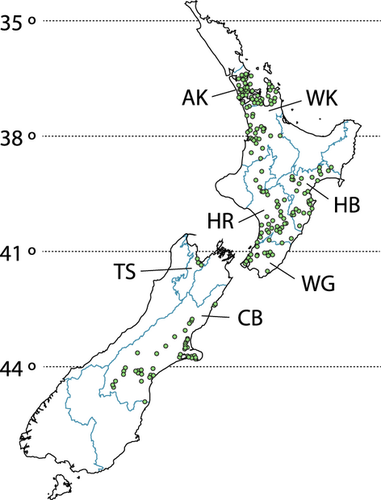
Stream biofilm samples were collected from a total of 252 stream sites using a standard protocol developed at the University of Auckland (Lewis et al., 2010). The sampling sites were located in seven regions throughout New Zealand (Fig. 1), ranging from Auckland (North Island) to Canterbury (South Island). A summary of the sites is provided in the Table S1. All samples were collected by local government authority staff at sites that are part of routine state-of-the-environment monitoring programmes, and as a result the sites spanned a wide range of natural environmental conditions and anthropogenic impact. All samples were collected between February and March 2010 to minimise effects of temporal variation that have been documented in bacterial biofilm community structure (Lear et al., 2008). Land use information was supplied by each local government authority which allowed each site to be classified as rural, urban, exotic forest or native forest based on the dominant catchment land-cover (Table 1). At each site, the biofilm was sampled by removing five rocks, c. 15–20 cm diameter (within a 10 m reach) and scrubbing the upper surface of each with a fresh sterile sponge (Speci-Sponge; VWR International Ltd., Arlington Heights, IL, U.S.A.). Each sponge was placed into an individual sterile Whirl-Pak® bag (VWR International), sealed, frozen and transported to the Centre for Microbial Innovation (CMI) laboratory (School of Biological Sciences, The University of Auckland), where they remained frozen (−20 °C), until analysis.
| Region | Sites (n) | Land use | |||
|---|---|---|---|---|---|
| Rural | Urban | Native forest | Exotic forest | ||
| Auckland | 65 | 27 | 13 | 17 | 8 |
| Waikato | 37 | 11 | 4 | 19 | 3 |
| Hawkes Bay | 33 | 21 | 4 | 5 | 3 |
| Horizons (Manawatu–Wanganui) | 40 | 26 | 0 | 14 | 0 |
| Wellington | 19 | 9 | 3 | 7 | 0 |
| Tasman | 8 | 1 | 3 | 0 | 4 |
| Canterbury | 50 | 38 | 5 | 7 | 0 |
| Total | 252 | 133 | 32 | 69 | 18 |
Sample processing and DNA extraction
Biofilm samples were each separated from the sponges by immersing in sterile water and macerating (using a Stomacher 400; Seward, Norfolk, UK) for 120 s at high speed. Sponges were squeezed to remove the entire sample material, and the resulting biofilm suspension transferred into individual centrifuge tubes before the biomass from each individual rock sample was pelleted by centrifugation (4500 g, 25 min). Total DNA was extracted from pelleted biofilm samples using a modified method of Miller et al. (1999) that combines a bead-beating methodology with chloroform–isoamyl alcohol extraction and precipitation of the extracted DNA with isopropanol (as previously described in Lear et al., 2008).
Molecular analysis of biofilm bacterial communities
The biodiversity of bacterial communities was assessed using automated ribosomal intergenic spacer analysis (ARISA). This PCR-based method exploits the variability in the length of the 16S–23S intergenic spacer (IGS) region of bacteria and creates ‘fingerprints’ of microbial communities based on the length of the amplified nucleotide sequences (Lear et al., 2008). Molecular fingerprinting approaches such as ARISA do not reveal the identity of bacterial species. However, DNA-fingerprinting methodologies have been shown to produce results that are broadly consistent with DNA-sequencing methods (Hackl et al., 2004) and remain widely used in comparative assessments of microbial community structure and similarity (Lejon et al., 2005; Bomberg et al., 2011), particularly for large sample numbers as DNA sequencing remains expensive. PCR was undertaken on the extracted DNA using Promega GoTaq® Green DNA polymerase master mix (Invitro Technologies Ltd., Auckland, New Zealand) and the primers SDBact (5′-TGC GGC TGG ATC CCC TCC TT-3′) and LDBact (5′-CCG GGT TTC CCC ATT CGG-3') (Ranjard et al., 2001). To reduce PCR inhibition from humic material likely to be present in the DNA extracts, bovine serum albumin (BSA) was added (0.4 μg μL−1 final concentration). For amplification, protocols previously established by Lear et al. (2009a) were followed. These were (i) 95 °C for 5 min, (ii) 30 cycles of 95 °C for 30 s, 61.5 °C for 30 s, 72 °C for 90 s and then (iii) 72 °C for 10 min. The primer SDBact was labelled at the 5′-end with HEX (6-carboxyhexafluorescein) fluorochrome (Invitrogen Molecular Probes, Auckland, New Zealand) to enable analysis by ARISA (Ranjard et al., 2001). PCR products were purified (Zymo DNA clean and Concentrator kit; Ngaio Diagnostics Ltd., Nelson, New Zealand) and 1 μL combined with 10 μL Hi Di formamide and a standard size marker (LIZ1200; ABI Ltd., Melbourne, Vic., Australia) before being heat-treated (95 °C, 5 min) and then cooled on ice. Samples were then run on a 3130XL Capillary Genetic Analyser (Applied Biosystems Ltd, Auckland, New Zealand) using a 50-cm capillary and the fluorescent intensity of different sized PCR products within each sample recorded.
Quantitative methods
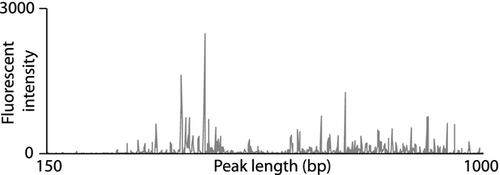
genemapper software (v. 3.7; ABI Ltd) was used to assign a fragment length (in nucleotide base pairs) to ARISA peaks, via comparison with the standard ladder (LIZ1200; ABI Ltd.). To include the maximum number of peaks whilst excluding background fluorescence, only peaks with a fluorescence value of 50 units or greater were analysed. The 16S–23S region is thought to range between c. 140 and 1530 bp (Fisher & Triplett, 1999). However, only a few minor peaks were detected over 1000 bp. Hence, fragment sizes ranging from 150 to 1000 base pairs were included for analysis. The total area under the curve was normalised (to 1.0) to remove differences in profiles caused by different initial DNA template quantities, and the PCR product length (peak size) was rounded to the nearest whole number. The ARISA profile of each sample consisted of the relative abundance of PCR products with lengths of up to 851 bp (representing 150–1000 bp of the intergenic spacer region) from constituent bacteria. One such example of a bacterial community profile is shown in Fig. 2. For this study, the lengths of ARISA fragments (in DNA base pairs) were used as the operational taxonomic unit (OTU) for each bacterial biofilm community. The number of ARISA peaks detected in each community was used as a measure of taxon richness, such that the maximum possible taxon richness of any community was 851 OTUs. For this and other reasons, operational taxonomic unit richness does not necessarily equate to species richness estimates. Diverse groups of bacteria may display similar-sized intergenic fragments, and some bacteria are known to contribute more than one peak to an ARISA profile.
Data analysis
Bacterial biofilm community data were initially investigated to understand land use influences on bacterial community structure within each region, and subsequently the entire New Zealand-wide data were analysed. For each site, data from at least three replicate samples were used to test for within- and amongst-site variability in bacterial community structure. To investigate regional and land use influences, differences in the taxon richness (numbers of ARISA peaks detected) within each stream site were investigated using a one-way analysis of variance (anova), followed by pairwise comparisons to identify components with significant differences. To account for errors arising from multiple tests, the significance of differences was corrected using Tukey's highly significant difference (HSD) testing within the SPSS Statistics 20 program. Differences in biofilm community structure (i.e. ARISA peak profiles) amongst sites were investigated using permutational analysis of variance (permanova) on multiple (3–5 samples per site) and centroid (centre point of a 3D data cloud) data, with 999 permutations of the data McArdle & Anderson (2001). All tests were performed using type III sums of squares (as missing data points can cause the data to be unbalanced), and 999 permutations were used under the reduced model. In addition to the permanova partitioning, the variability associated with each ‘source’ of variation in the model was quantified and expressed in terms of the square root of the variance component (McArdle & Anderson (2001). Pairwise permanova was used to evaluate the statistical significance of differences amongst the regional (i.e. comparing data from each of the seven regions sampled in this study, for example Auckland versus Canterbury) or land use categories (e.g. comparing data from catchments dominated by native versus exotic forest).
To visualise multivariate patterns in bacterial community data, non-metric multidimensional scaling (nMDS) was used on the ARISA data using the Bray–Curtis similarity measure. Points that are close together are more similar in terms of their community structure, that is, the presence and size of individual ARISA peaks. ARISA data sets were also compared using multivariate dispersion index values (MVDISP), based on the Bray–Curtis distances amongst sites. This index provides a relative ‘score’ of the multivariate variability within each of the regional and land use categories in a single ordination. All multivariate analyses were carried out using the primer v.6 computer program (Primer-E Ltd., Plymouth, UK) with the additional add-on package permanova+ (Anderson, Gorley & Clarke, 2008).
Results
From the 252 sites sampled, good-quality bacterial community profile data were obtained for 248 sites as four sites yielded insufficient DNA. For most sites, sufficient DNA was obtained from all five samples; however, for a smaller number of sites, three (14 sites) or four (31 sites) samples were used. To compare within- and amongst-site variation, a permanova was used to obtain a ‘global’ comparison incorporating all sample and site data. Differences in bacterial community structure were detected amongst sites (P = 0.001) regardless of whether multiple data (3–5 samples per site) or the centroid data were used, but not amongst data collected at any given site (P = 1).
Regional differences in bacterial community structure
Samples collected from the Wellington region showed the greatest average taxon richness (231 ± 7.0 OTUs; mean ± standard error (SE), used throughout unless noted otherwise), and the lowest taxon richness was observed in the Canterbury region (131 ± 3.7). With the exception of Wellington (231 ± 7.0), results reveal a broad pattern of decreasing taxon richness with increasing latitude from Auckland (209 ± 4.8) and Waikato (210 ± 4.5) in the north through Hawkes Bay (173 ± 4.9), Horizons (Manawatu–Wanganui) (164 ± 5.2) and Tasman (170 ± 7.5) to Canterbury (131 ± 3.7) in the south. Significant differences in taxon richness were observed for 15 of the 21 regional pairs tested; no significant differences were seen between the following pairs: Auckland and Wellington; Auckland and Waikato; Wellington and Waikato; Hawkes Bay and Horizons; Hawkes Bay and Tasman; and Horizons and Tasman.
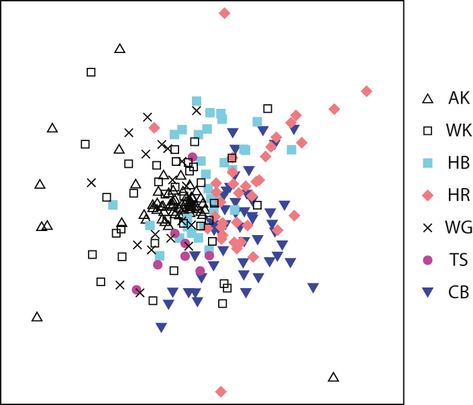
Differences in bacterial community structure were detected amongst all regions (pairwise permanova, P < 0.05). Analysis of the regional variation in community structure using an nMDS plot (Fig. 3) showed lowest similarity in bacterial community structure comparing samples from the Auckland and Canterbury regions. Variability in bacterial community structure was lowest in the smallest regions (MVDISP = 0.7 and 0.8 for Tasman and Auckland, respectively) and highest in the Canterbury region (MVDISP = 1.3). Whilst we identified significant differences in community structure, 142 OTUs (of a maximum of 851) were present in at least 70% of stream sites sampled across New Zealand (based on the number of ARISA peaks). However, the number of OTUs detected per site ranged from 15 to 407 OTUs (with an average of 180 ± 2 OTUs). Interestingly, the biofilm communities collected from Tasman region were differentiated by the absence of 122 of the 851 OTUs. It is likely that the smaller sample size and the lack of land use categories (such as native forest sites) for this region could have contributed to this observation. Together, the data suggest that regional differences arise from heterogeneity in taxon richness (detected OTUs) and their relative abundance within the multispecies biofilm assemblage.
Land use–based differences in bacterial community structure
There were no significant differences in OTU richness between land use categories. Taxon richness ranged from 177 ± 3.2 in rural catchments to 192 ± 6.3 in exotic forest catchments, and native forests and urban sites showed mid-range values of 184 ± 4.1 and 185 ± 5.0, respectively. However, differences in biofilm community structure (pairwise permanova, P < 0.05) were detected amongst all sites based on land use. Variability in bacterial community structure was low in the exotic forest (MVDISP = 0.7) and urban stream sites (MVDISP = 0.8), whilst data from rural and native forest stream sites were more variable (MVDISP = 1.0). This finding may be influenced by the fact that the data set was strongly represented by rural and native forest stream sites (131 and 66 sites, respectively). Data from these land use categories separated well on nMDS plots of data for four (of six regions); lesser differences were seen in samples collected from the Horizons (Manawatu–Wanganui) and Canterbury regions (Fig. 4). Tasman District samples were excluded from these analyses due to a low number of samples and the absence of native forest sites. To test whether differences in land use were consistent across the country, data from each region were analysed separately. Using pairwise permanova, differences (P < 0.05) in bacterial community structure were detected amongst data from each land use category.

Comparison of regional and land use effects
Our results have shown that both regional and land use factors are important in structuring biofilm bacterial communities. Therefore, we explored the relative contribution of the two drivers in explaining the variation in bacterial communities using a nested permanova (where the factor ‘land use’ was nested within ‘region’ and ‘P’ values were obtained using 999 permutations of variables under a reduced model). Variation in bacterial community structure was associated with both region and land use (P < 0.05). However, based on the square root values, regional differences were more closely related to variability in bacterial community structure than land use (square root values were 14 and 11, respectively, where a greater value provides evidence of a stronger relationship).
Discussion
In this New Zealand-wide study, we used an established molecular methodology (Lear et al., 2008, 2009b) to demonstrate clear differences in stream bacterial community structure related to both geographical location and anthropogenic impact. Whilst heterogeneity in the structure of resident bacterial communities showed significant differences based on regional influences (geographical location), bacterial community structure was also significantly impacted by the dominant catchment land use attributes upstream of each sampling location. The upstream catchments of our 252 streams cover 16% of the country's total land area and together with the use of a standard sampling and processing protocol; this enabled us to use this large data set to evaluate factors influencing bacterial communities at both the regional and national scale.
Confirmation of the land use-driven structuring of bacterial communities in both regional and nation-wide data sets has implications for the potential of microbial communities as a bioassessment tool for stream health. Whilst our study showed clear differences in bacterial community structure based on land use, there was no accompanying loss of taxon richness in impacted streams. The average taxon richness of bacterial communities was observed to range from 177 OTUs (rural streams) to 194 OTUs (exotic forest), with native forest and urban streams having 184 and 185 OTUs, respectively. This is a key point of difference when compared with existing biological indicators such as macroinvertebrates, which are often depauperate in impacted streams, with the result that ecosystem assessments are forced to rely on a few ‘tolerant’ species (Boothroyd & Stark, 2000; Lear et al., 2011). The taxon richness of bacterial communities in these streams can be attributed to the inherent (or adapted) high tolerance of certain biofilm members to a wide range of environmental stressors such as pH, temperature, chemical composition including toxicant and heavy metal concentrations (Ager et al., 2010; Ancion, Lear & Lewis, 2010; Wang et al., 2011). Moreover, structural rearrangements and physiological interactions between microbial components of the biofilm increase the metabolic flexibility of the entire community (James, Beaudette & Costerton, 1995; Cowan et al., 2000; Whiteley et al., 2001). The high diversity of the bacterial biofilm community therefore provides a potential tool for the systematic grading of stream ecosystem health, even within highly impacted urban sites.
Our data showed clear differences in bacterial community structure based on regional effects. Overall, taxon richness appeared to decrease from north (Auckland and Waikato) to south (Canterbury), with the exception of Wellington. This suggests that bacterial taxon richness is greater for sites closer to the equator. Taxon richness estimates based on studies with aquatic invertebrates have shown that such ‘latitudinal gradients in taxon richness’ exist for many biological communities (Hillebrand, 2004; Fierer et al., 2007), whereas our data suggest that similar patterns exist for freshwater bacterial communities.
The implications of regional differences in bacterial community structure are that any community-based tool for potential use at the nationwide scale must incorporate an appropriate level of regional variation into its design. Whilst regional boundaries might not be meaningful for the stream biota (since their distribution is not restricted by such arbitrary borders), these geopolitical areas are the scale at which regulatory authorities undertake their monitoring programmes. The combination of regional and land use–driven influences observed in our study allows us to propose a conceptual model that explains factors influencing the heterogeneity of bacterial biofilm communities in freshwater environments (Fig. 5). Our results suggest that bacterial diversity in any stream biofilm community will always be high and the net bacterial biofilm community diversity will depend on the complex interactions between natural factors such as geological and local environmental variables, in combination with anthropogenic influences. The bacteria represented in the biofilm bacterial community profile are therefore likely to comprise four broad ecological groups of bacteria:
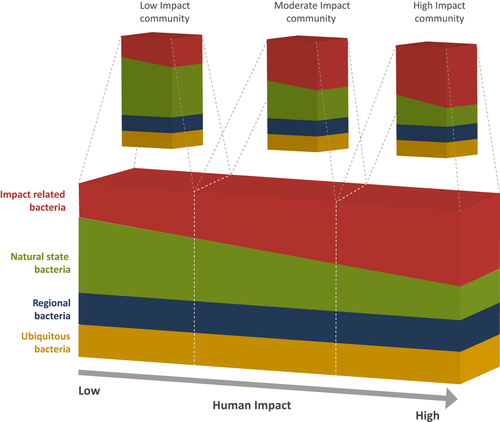
- Ubiquitous bacteria: 142 taxa were found to be present in at least 70% of stream sites analysed in this study suggesting the presence of ubiquitous taxa.
- Regional bacteria: Significant differences in bacterial community structure between regions suggest that there are regionally distinctive bacterial biofilm taxa.
- Natural-state bacteria: These are bacterial populations associated with unmodified streams where biofilm community development is driven by natural processes of succession.
- Impact-related bacteria: These are biofilm community members that are associated with the effects of human activities in the upstream catchment.
Further investigations are now required to identify the representative biofilm communities of each of these broad categories of organisms. Of particular, benefit will be the use of more advanced DNA-sequencing methods (Loman et al., 2012) which (unlike most DNA-fingerprinting methodologies) can provide detailed taxonomic information at the species level and inform on the presence and relative abundance of various indicator bacteria (e.g. E. coli, Bifidobacterium sp.) (Jeanneau et al., 2012).
Very few studies have been carried out that investigate the community structure of any biological group using a consistent sampling regime and incorporating the spatial variation across New Zealand. Quinn & Hickey (1990) investigated the diversity of benthic invertebrates by sampling 88 New Zealand rivers (covering the North and South Islands), also including a wide range of catchment types and water quality variables. The findings of Quinn & Hickey (1990) were similar to ours and revealed that urban development of the stream catchment strongly influenced macroinvertebrate community structure.
Our samples were collected from a range of sites capturing most of the natural and anthropogenic variation that exists in New Zealand. From a critical viewpoint, it might seem that the composition of our regional and land use categories was somewhat unbalanced. For example, our data were dominated by rural (131 sites) and native forested (66 sites) catchments, with fewer urban (34 sites) and exotic forest (17 sites) catchments. However, this reflects the applied nature of our study whereby our sampling sites are part of long-term monitoring programmes for which supporting environmental variables data and other biological samples are regularly collected. The utilisation of these existing local authority monitoring networks permitted the extensive sampling undertaken here. Nevertheless, the coverage of our data set could be improved by increased sampling of urban and exotic forested catchments.
In conclusion, we obtained bacterial community fingerprints for 248 stream sites and identified clear differences in bacterial community structure related to natural and anthropogenic environmental characteristics. Hence, we suggest that the bacterial community fingerprint profiling approach offers considerable opportunity for rapid comparative analysis of stream biofilms and that there are selection pressures acting upon bacterial community structure exerted by natural environmental variables and by stressors associated with the land use activities. This large-scale study has provided evidence of our ability to assess stream health based on the structure of the resident bacterial biofilm community and provides impetus for the development of a new evaluative tool targeting the basal trophic level of stream ecosystems to complement the existing suite of biotic and abiotic indicators.
Acknowledgments
The authors would like to acknowledge the Foundation for Research, Science and Technology, New Zealand (Grant No. UOAx306), and the RSNZ Marsden Fund (LIU0901) and staff of the following regional councils for funding and assistance with biofilm sampling: Martin Neale (Auckland Council, formerly called Auckland Regional Council), Kevin Collier (Environment Waikato), Sandy Haidekker (Hawkes Bay Regional Council), Carol Nicholson (Horizons Regional Council), Juliet Milne (Greater Wellington Regional Council), Trevor James (Tasman Regional Council) and Michele Stevenson (Environment Canterbury). We thank Kristine Boxen (Centre for Genomics and Proteomics, School of Biological Sciences, The University of Auckland) for assistance with ARISA of bacterial DNA and the Centre for Microbial Innovation (CMI), The University of Auckland for the continuation of this research.


