Fracture toughness of a rigid polyurethane foam: experimental and numerical investigation by varying the specimen sizes
Abstract
In the present paper, the fracture toughness of a polyurethane (PUR) foam (manufactured by Necumer GmbH, Germany, under the commercial designation Necuron 651) is experimentally and numerically investigated in order to examine its dependence on the specimen sizes. As a matter fact, to the best knowledge of the present authors, such an analysis is still missing in the technical literature. To perform the experimental campaign, notched PUR foam beams, with different geometrical sizes, are tested under three-point bending loading, and the Modified Two-Parameter Model (recently proposed by some of the present authors) is employed to measure the fracture toughness. Subsequently, such an experimental campaign is numerically simulated by applying a micromechanical model, implemented in a non-linear finite element homemade code. Finally, the results obtained are compared with some experimental data available in the literature, related to the same PUR foam.
Highlights
- The fracture toughness of a polyurethane foam is experimentally investigated.
- Notched PUR foam beams, with different sizes, are tested under three-point bending.
- The Modified Two-Parameter Model is employed to measure the fracture toughness.
- A numerical simulation is performed with a non-linear finite element model.
- The results are compared with some experimental data available in the literature.
1 INTRODUCTION
Cellular materials are nowadays very popular materials due to lightweight, efficient, and superior design for engineering structures,1 with applications in different fields such as defense, healthcare, automotive, construction, and aerospace,2 and used both as a stand-alone material and in combination to other ones to form composites.3
They can be classified into natural and man-made (manufactured) cellular materials.4-6 Cork, bamboo, wood, and human bones are examples of natural cellular materials, whereas polymeric, metallic, and ceramic foams, honeycomb and auxetic structures are examples of man-made ones.
As far as polymeric foams are concerned, their market has significantly increased over the last three decades, such foams being generally employed in building and aircraft/aerospace industries for both thermal and/or acoustic insulation, in automotive industry for energy absorption, thermal insulation, packaging, electronics, and other sectors.4, 7
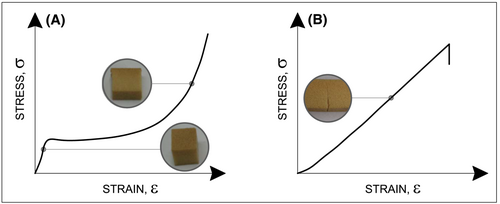
Failure of a polymeric foam is characterized by a crushing behavior under compression, reaching the full densification (Figure 1A), whereas it is characterized by the propagation of a single crack under tension (Figure 1B). Moreover, under tension and in the presence of a stress concentrator (such as a notch and/or a crack), such a foam has a linear-elastic behavior up to failure, highlighting a brittle fracture.4 Therefore, in the structural integrity analysis, the fracture toughness of the material represents a key parameter, which has to be examined in order to avoid sudden and catastrophic brittle fracture initiating from existing cracks.
The investigation on the fracture toughness of a polyurethane (PUR) foam, belonging to the category of polymeric foams, is the object of the present paper. The effort for determining the fracture toughness of PUR foams can be traced back to more than three decades ago.4, 8 More precisely, Fowlkes9 determined the fracture toughness of a low density rigid PUR foam (density equal to 88 kg/m3) by testing specimens of different types, that is, center cracked specimen, single- and double-edge cracked specimens, and double cantilever beam specimen. By using single-edge crack specimens, McIntyre and Anderton10 analyzed the fracture behavior of rigid PUR foams characterized by different density, founding a linear correlation between fracture toughness and density.
More recently, Marsavina and Linul4 have presented a review on the different approaches to determine the fracture toughness of polymeric foams, including PUR foams, that is, analytical models, numerical micromechanical models, and experimental investigations.
Many research works have been published on fracture behavior of PUR foams. For example, Aliha et al.11 performed Mixed-Mode I/II and I/III fracture tests on rigid PUR foams, with a density ranging from 100 to 300 kg/m3. Under Mixed-Mode I/II loading, such tests were conducted by using asymmetric semi-circular bend (ASCB) and compact tension-shear (CTS) specimens, whereas edge notch disc bend (ENDB) specimens were employed under Mixed-Mode I/III loading. The mode mixity parameter, , was made to vary from 0 (that is, the case of pure Mode I loading) to 1 (that is, the case of pure Mode II loading). The corresponding values of the Mixed-Mode fracture toughness and fracture growth direction (or fracture trajectory) were determined. It was found that fracture toughness significantly depended on the density, whereas fracture trajectory did not show any dependence. Moreover, it was observed that the fracture trajectory was curved under Mixed-Mode I/II loading, whereas it was curved and twisted under Mixed-Mode I/III loading, reaching the grater deviation from the pre-crack direction under pure Mode II and pure Mode III, respectively. Linul et al.12 carried out Mode I fracture tests on three PUR foams, having a density equal to 100, 145, and 300 kg/m3, respectively. The specimens, each of them consisting in a single-edge notched bend (SENB) specimen, were cut along either the foam rise direction (also named out-of-plane loading direction) or the foam flow direction (also named in-plane loading direction) and subjected to either quasi-static or dynamic three-point bending loading. More precisely, quasi-static tests were performed according to the ASTM D-5045-99 standard,13 whereas dynamic tests were performed according to the EN ISO 179–2 standard14 and the procedure presented by Kalthoff.15 The specimens were tested at both room temperature (25°C) and cryogenic temperature (−196°C). It was found that the Mode I fracture toughness of the examined foams depended on density and significantly increased at cryogenic temperature. The fracture toughness determined for out-of-plane specimens was slightly higher than that for in-plane specimens. Moreover, the dynamic values were higher than the quasi-static ones (up to three times higher). Empirical relationships were proposed for the estimation of quasi-static fracture toughness at −196°C and dynamic fracture toughness at room temperature. Imani et al.16 performed Mixed-Mode I/II fracture tests on three PUR foams (density 100 ÷ 300 kg/m3). The specimens, each of them consisting in an asymmetric edge notched disc bend (AENDB) specimen, were subjected to asymmetric three-point bending, by varying from 0 to 1. For each value of , three AENDB specimens were tested. It was found that the Mode I fracture toughness ranged between 0.08 and 0.31 MPa·m0.5, whereas the Mode II one ranged between 0.09 and 0.34 MPa·m0.5. It was also observed that, for each value of examined, the fracture toughness increased by increasing density. Some experimental results were assessed by employing analytical failure criteria available in the literature.17, 18 Further, Shahbazian et al.19 carried out Mixed-Mode I/II and I/III fracture tests on a rigid PUR foam with a density of 40 kg/m3. Forty ENDB specimens were tested under the above loading conditions. The fracture angle and the fracture toughness were determined, being the experimental results also assessed by using some analytical failure criteria available in the literature.20-22
In the present paper, the fracture toughness of a PUR foam with a density equal to 708 kg/m3, manufactured by Necumer GmbH (Germany) under the commercial designation Necuron 651, is experimentally and numerically investigated in order to examine its dependence from specimen sizes, being such an analysis missing in the literature to the best knowledge of the present authors. It is worth noticing that, with respect to the research works,23, 24, 4 where the thickness is taken as a constant, all the specimen sizes are herein made to vary proportionally.
To perform the experimental campaign, notched PUR foam beams, with different geometrical sizes, are tested under three-point bending loading, and the Modified Two-Parameter Model (MTPM), recently proposed by some of the present authors,25-29 is applied to measure the fracture toughness. Moreover, such an experimental campaign is numerically simulated by using a micromechanical model, proposed by some of the present authors in the past.30-32 The results obtained are compared with the experimental data reported by Negru et al.,33, 34 which are related to the same PUR foam.
The paper is structured as follows: the material examined is described in Section 2, whereas the experimental campaign performed, the MTPM, and the results obtained are presented in Section 3. Section 4 is devoted to both the description of the micromechanical model used for the numerical simulations and the results obtained. Section 5 is dedicated to the comparison of the present results with the literature data, whereas the main conclusions are summarized in Section 6.
2 MATERIAL EXAMINED
The PUR foam herein examined is manufactured by Necumer GmbH under the commercial designation Necuron 651.35 Being its density equal to 708.00 ± 3.45 kg/m3,33, 34, 36, 37 it can be classified as a PUR material with a porous solid structure, as is shown in Figure 2, which represents the material microstructure obtained by using a Quanta™ 250 FEG SEM, at a magnification of 500×.
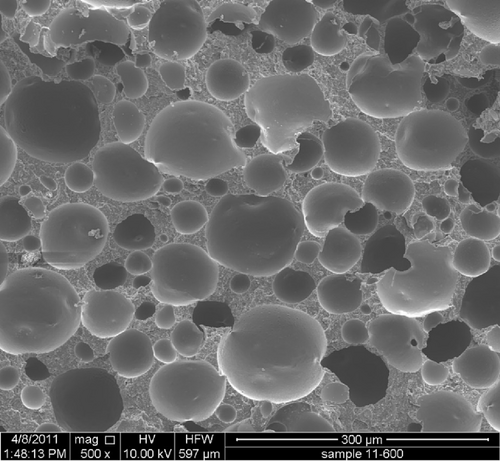
From the statistical analysis of the microstructure shown in Figure 2, the cell diameter is equal to 49.1 ± 30.2 μm, and the cell wall thickness ranges from 4.7 to 37.6 μm.
The elastic modulus and the Poisson coefficient, determined according to the ASTM E-1876-01 standard,38 are equal to 1250 ± 15 MPa and 0.302,33, 34, 37 respectively, whereas the ultimate tensile strength, evaluated according to the EN ISO 527 standard,39 is equal to 17.40 ± 0.32 MPa.33, 34, 36, 37
3 FRACTURE TOUGHNESS: EXPERIMENTAL CAMPAIGN
3.1 Specimen geometries
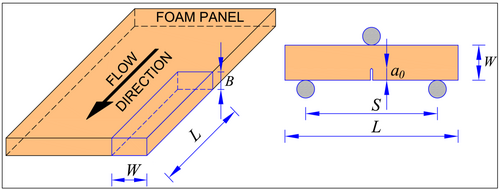
The tested specimens are made by cutting prismatic samples from Necuron 651 panels in flow direction (Figure 3). According to the MTPM,25-29 the specimen sizes are function of the panel width, , as follows: depth , span , and notch depth , being the notch width mm (see Figure 3). Such a notch is realized by using a circular saw, thus obtaining a blunt notch.
- six specimens (named N10-X, where X identifies the specimen No.) with a nominal width, , equal to mm;
- six specimens (named N25-X) with mm;
- six specimens (named N50-X) with mm.
For each group, the measured mean values of both width , depth , span , length , and notch depth are listed in Table 1. The average value of the notch width among all the specimens is equal to mm.
| Group name | |||||
|---|---|---|---|---|---|
| N10 | 10.293 | 20.862 | 80 | 120 | 6.058 |
| N25 | 25.394 | 48.942 | 200 | 300 | 16.710 |
| N50 | 50.094 | 99.049 | 400 | 500 | 33.366 |
Before testing, all specimens are stored in laboratory at 20°C and 65% of relative humidity.
3.2 Testing setup
Three-point bending tests on the above specimens are performed by using a universal testing machine Instron 8862 (Figure 4) at the “Testing Laboratory of Material and Structures” of the University of Parma, Italy, according to both the MTPM25-29 and the Rilem Recommendations,40, 41 under crack mouth opening displacement (CMOD) control by employing a clip gauge. The CMOD rate is equal to 0.15 mm/h.
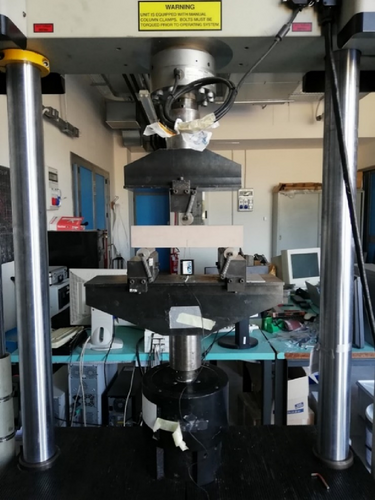
The applied load is measured through a load cell of 100 kN, with an accuracy up to 0.02%. Each specimen is monotonically loaded under CMOD control up to the peak load , being the specimen behavior characterized by an initial compliance . After is reached, the post-peak stage follows and, when the load is equal to about 95% of , the specimen is fully unloaded under load control in 3 min, being the specimen characterized by an unloading compliance . The specimen is then reloaded under CMOD control up to failure.
3.3 Calculation
The fracture toughness, named , is evaluated according to the MTPM,25-29 recently proposed by some of the present authors to compute such a parameter for brittle and quasi-brittle materials. The method consists of the following steps.
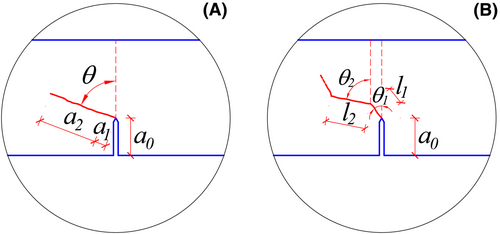
It is worth noticing that, when the fracture surface is not plane, is determined as the mean value of the kinking angles related to the front and the back side of the specimen.
3.4 Results
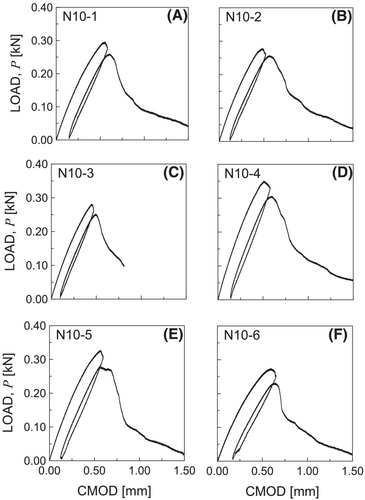
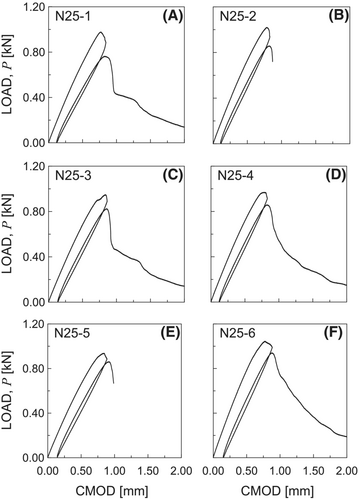
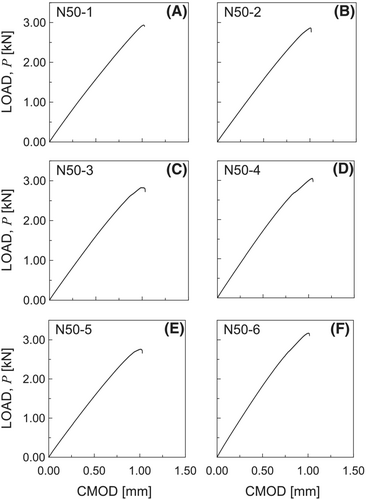
For each specimen group detailed in Section 3.1, the load against CMOD curves are reported in Figures 6-8, whereas the registered values of , , and are listed in Table 2. The crack paths are shown in Figures 9-11, highlighting a typical Mode I crack path. Therefore, to compute , the kinking angle is assumed equal to zero for all cases examined.
| Specimen No. | |||||
|---|---|---|---|---|---|
| N10-1 | 1.442 | 1.655 | 0.296 | 1.430 | 1.258 ± 0.143 |
| N10-2 | 1.366 | 1.613 | 0.278 | 1.285 | |
| N10-3 | 1.304 | 1.471 | 0.281 | 1.061 | |
| N10-4 | 1.168 | 1.378 | 0.351 | 1.383 | |
| N10-5 | 1.327 | 1.499 | 0.327 | 1.263 | |
| N10-6 | 1.556 | 1.906 | 0.274 | 1.128 | |
| N25-1 | 0.665 | 0.884 | 0.978 | 1.365 | 1.334 ± 0.038 |
| N25-2 | 0.644 | 0.792 | 1.020 | 1.352 | |
| N25-3 | 0.704 | 0.839 | 0.949 | 1.302 | |
| N25-4 | 0.658 | 0.791 | 0.970 | 1.303 | |
| N25-5 | 0.711 | 0.820 | 0.937 | 1.296 | |
| N25-6 | 0.723 | 0.750 | 1.046 | 1.384 | |
| N50-1 | 0.309 | 0.346 | 2.937 | 1.322 | 1.352 ± 0.066 |
| N50-2 | 0.316 | 0.351 | 2.865 | 1.301 | |
| N50-3 | 0.307 | 0.349 | 2.829 | 1.316 | |
| N50-4 | 0.289 | 0.340 | 3.053 | 1.390 | |
| N50-5 | 0.317 | 0.365 | 2.760 | 1.314 | |
| N50-6 | 0.259 | 0.317 | 3.172 | 1.469 |
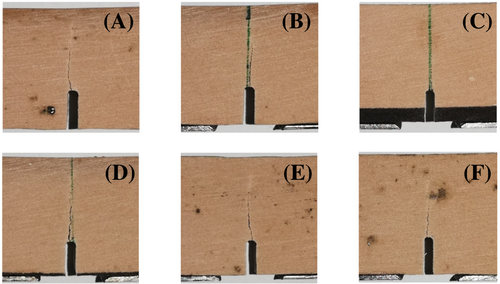
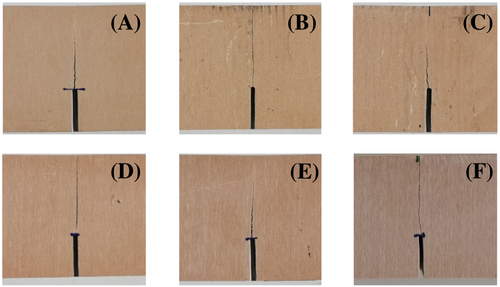

It can be observed that, for the specimens of the N50 group (Figure 8), fracture failure is reached just after the is achieved. Therefore, the unloading and reloading is not performed, contrary to what occurs for the specimens of N10 and N25 groups (Figures 6 and 7).
For each specimen examined, the corresponding value of is reported in Table 2, together with the mean value and standard deviation related to each specimen group. By comparing the values with each other, it can be stated that, according to the MTPM, the fracture toughness of Necuron 651 is a size-independent parameter, being the maximum relative difference in absolute value equal to 0.094, which is lower than the maximum standard deviation related to the fracture toughness results. Consequently, the fracture toughness of the present Necuron can be assumed to be equal to 1.315 ± 0.097 MPa·m0.5 (computed as the mean value of values related to all specimens, reported in Table 2).
4 NUMERICAL SIMULATIONS
4.1 Model description
The experimental campaign described in Section 3 is numerically simulated by employing a micromechanical model, implemented in a non-linear Finite Element (FE) homemade code in Fortran language, proposed by some of the present authors in the past.30-32 More precisely, the P-CMOD curves are numerically simulated, and the fracture toughness is determined according to Equations (1)–(7).
In the present model, the matrix is assumed to have a brittle behavior, and the discontinuities due to the fracture process are simulated by using a suitable modification of the material properties. More precisely, the nucleation of one or more cracks in the finite elements is related to the reduction of the current matrix stiffness in correspondence of the integration points. In order to describe such a process, a cohesive law is employed to simulate the cracked zone, whereas an elastic law is adopted for the uncracked (i.e., continuous) region. The crack faces, hence, transmit a non-zero stress, described by an exponential function of the relative crack opening displacement.
Due to the nature of the simulated tests, a plain strain FE analysis is performed. To such an aim, three notched prismatic models subjected to three-point bending loading are created, whose geometrical sizes are listed in Table 1. According to the specimen geometries (Section 3.1), the notch is schematized as a blunt notch in the numerical model.
The mesh discretization is composed by four-node quadrilateral plane elements, and the model is characterized by a number of finite elements equal to 639 for the N10 model and 630 for both N25 and N50 models. Such discretizations derive from both convergence analyses, performed on the von Mises stress, and a mesh refinement near the notch in order to better simulate the fracture behavior. Consequently, the minimum size of the used four-node quadrilateral element is equal to 0.33 mm.
The input data are represented by: the elastic modulus equal to 915.45 MPa, computed as the average value of the experimental results; the Poisson ratio and the ultimate tensile strength equal to 0.302 and 17.40 MPa, respectively, according to the experimental values provided by Negru et al.33, 34, 37; and the energy release rate computed as 1715 N/m, by exploiting the well-known relationship related to the fracture toughness under plane strain assumption (the used fracture toughness value is the experimental mean one, that is, 1.315 MPa·m0.5).
The analyses have been performed under displacement control, by imposing a vertical displacement increment at the top central loading point.
It is worth noticing that, since the unloading branch has not been numerically reproduced, the unloading compliance is computed as the slope of the straight line passing through the origin and of each numerical load against CMOD curve.
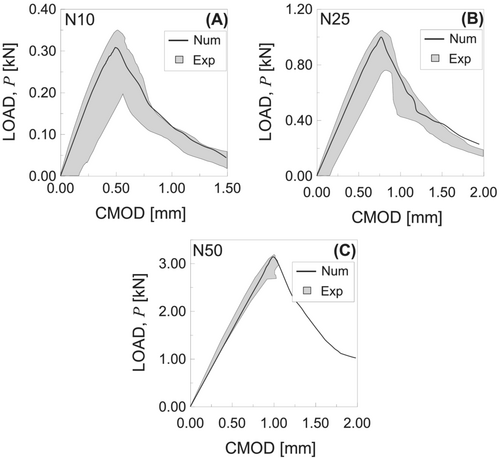
4.2 Results
- +3.51% on , +1.20% on , and +9.16% on for the N10 model;
- +5.89% on , −5.67% on , and +1.29% on for the N25 model;
- +5.05% on , −9.08% on , and +6.27% on for the N50 model.
| Model name | ||||
|---|---|---|---|---|
| N10 | 1.408 | 1.606 | 0.308 | 1.257 |
| N25 | 0.724 | 0.767 | 0.996 | 1.263 |
| N50 | 0.312 | 0.313 | 3.120 | 1.339 |
By using the numerical values of , , and , listed in Table 3, the corresponding values of fracture toughness are computed by using Equations (1)–(7), assuming . The maximum error in terms of fracture toughness with respect to is equal to −0.09% for the N10 model, −5.29% for the N25 model, and −0.93% for the N50 model.
5 COMPARISON WITH LITERATURE DATA
The Mixed-Mode I/II fracture toughness evaluation for Necuron 651, performed by using different methods available in the literature,33, 34 is discussed in this section, and the comparison with the present results is made.
5.1 Method by using an ASCB specimen
The tested sample employed by Negru et al.33 was an ASCB specimen with a radius of 40 mm and thickness of 10 mm, containing an edge crack with a length of 20 mm, perpendicular to the specimen edge. The specimen was loaded under three-point bending, and a wide range of Mixed-Mode loading was produced by varying the position of one of the two supports. More precisely, such a distance was made to vary from 30 mm (pure Mode I loading) to 2.66 mm (pure Mode II loading). The tests were carried out by means of a Zwick/Roell Z005 testing machine (maximum load 5 kN), under displacement control with a loading rate of 1 mm/min.
It was found that the Mixed-Mode fracture toughness ranged between 1.073 MPa·m0.5 (pure Mode II loading) and 1.286 MPa·m0.5 (pure Mode I loading). Such results are in agreement with both the present experimental and numerical results, equal to 1.315 and 1.286 MPa·m0.5, respectively, being the maximum relative difference lower than the experimental standard deviation.
5.2 Method by using a SENB specimen
The tested sample employed by Negru et al.34 was a SENB specimen with a depth ( ) of 20 mm and a thickness of 10 mm, containing an edge crack with a length equal to . The specimen was loaded under three-point bending, being the span equal to . The tests were carried out according to the ASTM D 5045-14 standard,42 by means of a Zwick/Roell Z005 testing machine (maximum load 5 kN), under displacement control with a loading rate of 1 mm/min.
It was found that the Mode I fracture toughness was equal to 0.996 MPa·m0.5, being the relative difference with respect to the value obtained using the ASCB specimen33 equal to about 23%, whereas the difference with respect to the present experimental and numerical results is equal to about 24% and 23%, respectively.
5.3 Method by using a DCR specimen
The tested sample employed by Negru et al.34 was a diametrically compressed ring (DCR) with an inner diameter of 40 mm, an outer diameter of 80 mm, and a thickness of 5 mm, containing a U-shaped notch with a depth equal to 5 mm. Different values of the notch root radius ranging from 0.5 to 1.5 mm were examined. The specimen was loaded under compression, and a wide range of Mixed-Mode loading was produced by varying the notch orientation. More precisely, such an orientation was made to vary from 0° (pure Mode I loading) to 25° (nearly pure Mode II loading). The tests were carried out by means of a Zwick/Roell Z005 testing machine (maximum load 5kN), under displacement control with a loading rate of 1 mm/min.
It was found that, when the notch root radius was equal to 0.5 mm, the generalized notch stress intensity factor ranged between 1.097 MPa·m0.5 (nearly pure Mode II loading) and 1.147 MPa·m0.5 (pure Mode I loading). The comparison with the present results can be only qualitative since the DCR specimen is characterized by a notch root radius of 0.5 mm (sharp notch). The above results related to the DCR specimens are of the same order of magnitude as the present ones (both experimental and numerical).
6 CONCLUSIONS
- fracture toughness is a size-independent material parameter;
- the numerical model employed is able to estimate the parameters used to compute fracture toughness with a quite good accuracy, providing results characterized by errors, with respect to the experimental ones, lower than the standard deviation values;
- the present results are in quite satisfactory agreement with some results available in the literature, experimentally obtained with alternative methods.
This research work also highlights that the present micromechanical model is a good alternative to compute the fracture toughness of brittle materials.
AUTHOR CONTRIBUTIONS
Sabrina Vantadori: Conceptualization; supervision; funding acquisition; investigation; review and editing. Andrea Carpinteri: funding acquisition; Review and editing. Roberto Cerioni: Review and editing. Camilla Ronchei: Formal analysis; investigation; writing. Daniela Scorza: Formal analysis; investigation; writing. Andrea Zanichelli: Formal analysis; investigation; review and editing. Liviu Marsavina: Supervision; review and editing.
ACKNOWLEDGMENTS
The work of Andrea Carpinteri, Roberto Cerioni, Sabrina Vantadori, and Andrea Zanichelli is supported by the Italian Ministry of University and Research (P.R.I.N. National Grant 2017, Project code 2017HFPKZY; University of Parma Research Unit).
Open Research
DATA AVAILABILITY STATEMENT
The data that support the findings of this study are available on request from the corresponding author. The data are not publicly available due to privacy or ethical restrictions.


