Magnitude of blood pressure change and clinical outcomes after thrombectomy in stroke caused by large artery occlusion
Mohammad Anadani and Marius Matusevicius are joint first authors.
Funding information
No funding source has had any impact on the methodology or the presented results of this study. M.M. and N.A. have received funding from the Stockholm Regional Council. M.M. and N.A. have received funding from the Swedish Stroke Foundation. M.M. and N.A. have received funding from the Karolinska Institute. A.H. is supported by NIH-NINDS K23NS105924.
See commentary by C. S. Anderson on page 1797
Abstract
Background
Extremes of both high and low systolic blood pressure (SBP) after mechanical thrombectomy (MT) in large artery occlusion stroke are known predictors of unfavorable outcome. However, the effect of SBP change (∆SBP) during the first 24 h on thrombectomy outcomes remains unclear. We aimed to investigate the association between ∆SBP at different time intervals and thrombectomy outcomes.
Methods
We analyzed MT-treated patients registered in the SITS International Stroke Thrombectomy Registry from January 1, 2014 to September 3, 2019. Primary outcome was 3-month unfavorable outcome (modified Rankin scale scores 3–6). We defined ∆SBP as the mean SBP of a given time interval after MT (0–2, 2–4, 4–12, 12–24 h) minus admission SBP. Multivariable mixed logistic regression models were used to adjust for known confounders and center as random effect. Subgroup analyses were included to contrast specific subpopulations. Restricted cubic splines were used to model the associations.
Results
The study population consisted of 5835 patients (mean age 70 years, 51% male, median NIHSS 16). Mean ∆SBP was −12.3, −15.7, −17.2, and −16.9 mmHg for the time intervals 0–2, 2–4, 4–12 h, and 12–24 h, respectively. Higher ∆SBP was associated with unfavorable outcome at 0–2 h (odds ratio 1.065, 95% confidence interval 1.014–1.118), 2–4 h (1.140, 1.081–1.203), 4–12 h (1.145, 1.087–1.203), and 12–24 h (1.145, 1.089–1.203), for every increase of 10 mmHg. Restricted cubic spline models suggested that increasing ∆SBP was associated with unfavorable outcome, with higher values showing increased risk of unfavorable outcome.
Conclusion
SBP increase after thrombectomy in large artery occlusion stroke is associated with poor functional outcome.
INTRODUCTION
Blood pressure (BP) management is a key part of post-mechanical thrombectomy (MT) care in large artery occlusive stroke and requires taking multiple factors into consideration such as reperfusion status, infarct size, and comorbidities.[1 Multiple studies demonstrated an association between elevated BP post-MT and unfavorable outcome and hemorrhagic complications,[2-6 a finding that was further supported by a meta-analysis.[7 However, the association between systolic BP change (∆SBP) post-MT and outcome of MT has not been well studied.
Studies from the pre-thrombectomy era demonstrated an association between BP reduction and unfavorable outcome, suggesting detrimental effect of BP reduction after acute stroke.[8, 9 However, those studies did not take into account the presence of large artery occlusion or reperfusion status. Therefore, their results cannot be reliably applied to patients with large artery occlusion stroke treated with thrombectomy.
Previous study of patients with large artery occlusions treated successfully with MT demonstrated an inverse association between ∆SBP and unfavorable outcome, suggesting a potential benefit from altering BP post-MT.[10 In contrast, a subsequent study of patients treated with MT failed to demonstrate an association between ∆SBP and functional outcome or hemorrhagic complications.[11 However, these studies lacked analysis on time-stamped BP data and were unable to investigate the association between ∆SBP and outcome at different time points and with regard to reperfusion status.
It is possible that the association between ∆SBP and outcomes is time-dependent as it was demonstrated by preclinical studies[12-14]; therefore, it is imperative to understand the difference in the association between ∆SBP and outcome between different time intervals.
In this study, we aimed to study the association between ∆SBP during different time periods post-MT with the efficacy and safety outcomes.
METHODS
Study population
We analyzed MT-treated patients registered in the Safe Implementation of Treatments in Stroke International Thrombectomy Registry from January 1, 2014 to September 3, 2019. Inclusion criteria were: (1) ischemic stroke due to anterior circulation large vessel occlusion strokes treated with MT using modern generation devices with and without intra-arterial thrombolysis and (2) pre-stroke modified Rankin Scale (mRS) score 0–2. In order to maintain high data quality, we only included data from centers which registered at least 10 patients and had 3-month follow-up data on at least 70% of patients.[4
Blood pressure parameters
Systolic BP (SBP) was recorded on admission, end of procedure (0 h) and at 2, 4, 6, 12, and 24 h post-MT. There was no standardized BP measurement method; however, most centers included in the study use non-invasive cuff for BP measurement post-MT as their standard practice.[15 ∆SBP was defined as mean SBP at different time points (0–2, 2–4, 4–12, 12–24 h) post-MT minus baseline SBP. We first considered admission SBP as baseline SBP. Then we repeated the analysis by considering end of procedure BP as baseline SBP and the resulting ∆SBP was named ∆eSBP.
Outcome measures
Primary outcome was 90-day unfavorable functional outcome. Unfavorable outcome was defined as 90-day mRS scores of 3–6. Secondary outcomes included 90-day all-cause mortality, neurological deterioration within 24 h (defined as worsening National Institutes of Health Stroke Scale [NIHSS] by four or more points from baseline), and symptomatic intracerebral hemorrhage (SICH) within 24 h as diagnosed according to modified SITS-MOST definition.[4 Successful reperfusion was defined using modified Treatment in Cerebral Ischemia (mTICI) scores of 2b-3. All outcomes were reported by local investigators without central adjudication.
Statistical analysis
Comparison between unfavorable outcome and favorable outcome groups was performed using Student’s t-test for continuous variables (variables expressed as mean ± standard deviation [SD]), Mann–Whitney U test for non-Gaussian continuous or ordinal variables (variables expressed as median [interquartile range]), and χ2 test for categorical variables (variables expressed as n [%]).
We assessed the association between ∆SBP and primary and secondary outcomes using mixed effects logistic regression models considering center as random effect. In addition to center, the mixed model was adjusted for the following pre-specified confounders: age, pre-treatment NIHSS, successful reperfusion, onset to reperfusion time, sex, history of diabetes, history of hypercholesterolemia, history of congestive heart failure, intravenous thrombolysis, admission SBP, and history of hypertension. Odds ratios (ORs) of each outcome with their corresponding 95% confidence intervals (CIs) were calculated for 10 mmHg change.
Subgroup analyses were performed based on reperfusion status (successful vs. unsuccessful), history of hypertension (yes vs. no), use of antihypertensive medications after MT (yes vs. no), admission SBP (<140, 140–160, and ≥180 mmHg), and age (70 vs. ≥70 years). The significance of stratifying by these subgroups was tested through adjusting the regression models with an interaction term between the subgroup and ∆SBP, using the p value for the interaction as indicator of significance.
Finally, to assess the shape of the association between ∆SBP and ∆eSBP and outcomes we created restricted cubic spline models for the association between both measures and each outcome as a sensitivity analysis in order to visualize the trend for ∆SBP.
The current study was approved by the Stockholm Regional Ethical Board through the framework of SITS-Monitoring Study II. Ethical and other approvals for sharing aggregate data were the responsibility of the principal investigators of the studies asked to provide the data. The trial was conducted in accordance with the good clinical practice guidelines of the International Conference on Harmonization and the principles of the Declaration of Helsinki.
Data availability statement
The data that support the findings of this study are available from the corresponding author upon reasonable request.
RESULTS
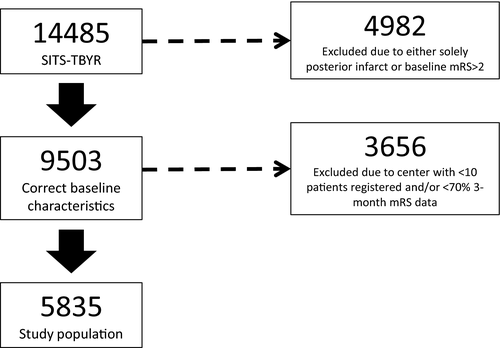
A total of 14,873 patients treated with MT were registered in the Safe Implementation of Treatment in Stroke Thrombectomy registry (SITS-TBYR) during the study period. Of these, 5835 patients fulfilled our inclusion criteria (Figure 1). Our study population had a mean age of 69.9 years, were 51.0% male, and presented with median NIHSS score of 16 (Table 1). Baseline SBP showed a normal distribution (Figure S1). Our inclusion criteria led to 38 centers providing the study population, with patient numbers per center ranging from 942 to 10. A total of 2671 (52.1%) patients achieved mRS scores of 3–6 at 3-month follow-up (Table 1). Patients that achieved mRS 3–6 differed vastly from those that achieved mRS 0–2, including the proportion of mTICI 2b-3 (77.6% vs. 94.6%, p < 0.001) and SICH (5.2% vs. 0.6%, p < 0.001).

| Characteristic | All | mRS 0−2 | mRS 3−6 | P value |
|---|---|---|---|---|
| N | 5835 | 2453 | 2671 | |
| Age (years) | 69.9 (13.4) | 66.3 (13.7) | 73.1 (12.2) | <0.001 |
| Systolic blood pressure, baseline (mmHg) | 149.6 (25.4) | 146.4 (24.0) | 152.1 (26.3) | <0.001 |
| Diastolic blood pressure, baseline (mmHg) | 81.5 (15.7) | 80.4 (15.0) | 82.5 (16.5) | <0.001 |
| Glucose, baseline (mmol/l) | 7.4 (15.7) | 6.9 (15.0) | 7.8 (16.5) | <0.001 |
| Cholesterol, baseline (mmol/l) | 4.5 (1.9) | 4.6 (2.4) | 4.4 (1.4) | 0.012 |
| Thrombectomy attempts | 1 (1, 3) | 1 (1, 2) | 2 (1, 3) | <0.001 |
| Onset to reperfusion | 300 (220, 412) | 280 (210, 390) | 320 (235, 424) | <0.001 |
| NIHSS, baseline | 16 (11, 20) | 13 (9, 18) | 18 (14, 22) | <0.001 |
| mRS, baseline | 0 (0, 0) | 0 (0, 0) | 0 (0, 0) | <0.001 |
| Sex, male | 51.0 (2975/5835) | 52.7 (1292/2453) | 49.5 (1321/2671) | 0.023 |
| Platelet inhibitors, baseline | 29.5 (1704/5778) | 25.8 (628/2437) | 32.9 (866/2636) | <0.001 |
| Anticoagulants, baseline | 17.3 (1005/5793) | 14.8 (362/2440) | 19.3 (512/2646) | <0.001 |
| Antihypertensive, baseline | 65.3 (3784/5791) | 60.4 (1474/2442) | 69.7 (1844/2644) | <0.001 |
| Statin, baseline | 29.5 (1696/5746) | 26.5 (642/2426) | 32.6 (854/2621) | <0.001 |
| Antidiabetic, baseline | 14.9 (859/5782) | 10.8 (263/2438) | 18.0 (476/2640) | <0.001 |
| Hypertension, baseline | 66.8 (3882/5813) | 61.0 (1493/2447) | 72.4 (1926/2660) | <0.001 |
| Hyperlipidemia, baseline | 33.1 (1915/5781) | 30.7 (748/2437) | 36.1 (954/2640) | <0.001 |
| Diabetes mellitus, baseline | 18.7 (1085/5817) | 14.3 (349/2446) | 22.1 (587/2662) | <0.001 |
| Smoking, baseline | 24.4 (1365/5600) | 27.3 (650/2378) | 21.9 (557/2545) | <0.001 |
| Atrial fibrillation, baseline | 29.6 (1719/5809) | 25.7 (628/2443) | 33.5 (892/2660) | <0.001 |
| Congestive heart failure | 10.6 (613/5805) | 8.7 (212/2444) | 12.7 (336/2653) | <0.001 |
| Previous TIA | 3.7 (213/5812) | 3.8 (93/2447) | 3.4 (91/2658) | 0.518 |
| Previous stroke | 10.3 (599/5817) | 8.5 (208/2447) | 11.2 (299/2662) | 0.001 |
| IVT treatment | 61.8 (3605/5835) | 66.7 (1635/2453) | 58.1 (1553/2671) | <0.001 |
| Localization of occlusion, ICA | 15.6 (860/5499) | 11.1 (259/2324) | 19.3 (484/2504) | <0.001 |
| Localization of occlusion, M1 | 66.5 (3657/5499) | 67.7 (1573/2324) | 65.2 (1632/2504) | 0.070 |
| Localization of occlusion, M2 | 16.5 (908/5499) | 19.6 (455/2324) | 14.5 (362/2504) | <0.001 |
| Localization of occlusion, other | 1.3 (74/5499) | 1.6 (37/2324) | 1 (26/2504) | 0.117 |
| mTICI 2b-3 | 85.6 (4159/4861) | 94.6 (1964/2076) | 77.6 (1723/2220) | <0.001 |
| Death at 3 months | 17.6 (926/5265) | – | 34.7 (926/2671) | – |
| SICH | 2.8 (156/5510) | 0.6 (14/2366) | 5.2 (130/2492) | <0.001 |
| Neurological deterioration | 13.3 (680/5120) | 4.4 (100/2251) | 22.4 (512/2283) | <0.001 |
- P value calculated for mRS 0−2 vs. mRS 3−6. Neurological deterioration defined as an increase of NIHSS score by ≥4 points.
- For continuous variables mean (standard deviation) is presented, Student's t-test for comparisons. For ordinal variables median (interquartile range) is presented, Mann−Whitney U test for comparisons. For categorical variables percentage (number of patients/total number of patients) is presented, Pearson's χ2 test used for comparisons.
- ICA, internal carotid artery; IVT, Intravenous thrombolysis; mRS, modified Rankin scale score; mTICI, modified Treatment in Cerebral Infarction score; NIHSS, National Institutes of Health Stroke Scale score; SICH, symptomatic intracerebral hemorrhage; TIA, transitory ischemic attack.
∆SBP and clinical outcomes
Mean ∆SBP was −12.3, −15.7, −17.2, and −16.9 mmHg for time intervals 0–2, 2–4, 4–12, and 12–24 h, respectively (Table S1). ∆SBP was normally distributed at all time intervals (Figure S2). After adjusting for potential confounders, ∆SBP showed significant associations with mRS 3–6 for increasing ∆SBP at all time intervals (OR 1.065, 95% CI 1.014–1.118; OR 1.140, 95% CI 1.081–1.203; OR 1.145, 95% CI 1.087–1.207; OR 1.145 with 95% CI 1.089–1.203 for time intervals 0–2, 2–4, 4–12, 12–24 h, respectively, for every increase of 10 mmHg ∆SBP) (Table 2).
| Parameter | mRS 3−6 at 3 months | Death at 3 months | SICH by mSITS | Neurological deterioration |
|---|---|---|---|---|
| ∆SBP | ||||
| 0–2 h | 1.065 (1.014–1.118) | 1.071 (1.009–1.137) | 1.131 (1.018–1.256) | 1.075 (1.010–1.144) |
| 2–4 h | 1.140 (1.081–1.203) | 1.135 (1.065–1.210) | 1.294 (1.157–1.446) | 1.163 (1.088–1.243) |
| 4–12 h | 1.145 (1.087–1.207) | 1.136 (1.069–1.208) | 1.199 (1.086–1.323) | 1.161 (1.091–1.236) |
| 12–24 h | 1.145 (1.089–1.203) | 1.121 (1.055–1.191) | 1.123 (1.001–1.260) | 1.163 (1.092–1.238) |
| ∆eSBP | ||||
| 2–4 h | 1.114 (1.058–1.174) | 1.076 (1.012–1.143) | 1.141 (1.026–1.267) | 1.129 (1.062–1.201) |
| 4–12 h | 1.107 (1.054–1.162) | 1.064 (1.004–1.128) | 1.140 (1.031–1.261) | 1.139 (1.074–1.208) |
| 12–24 h | 1.060 (1.014–1.109) | 1.019 (0.966–1.075) | 1.037 (0.942–1.141) | 1.088 (1.029–1.150) |
- Neurological deterioration defined as an increase of NIHSS score by ≥4 points.
- ∆eSBP, end of procedure systolic blood pressure change; mRS, modified Rankin scale score; mTICI, modified Treatment in Cerebral Infarction score; NIHSS, National Institutes of Health Stroke Scale score; ∆SBP, baseline systolic blood pressure change; SICH by mSITS, symptomatic intracerebral hemorrhage by the modified SITS-MOST criteria.
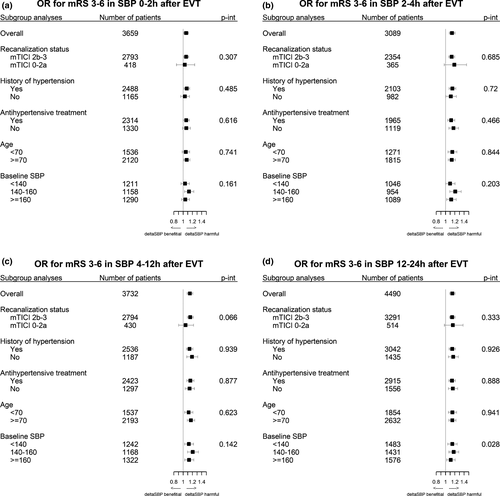
In the subgroup analysis, only the categorization of baseline SBP showed a significant interaction with ∆SBP at 12–24 h for unfavorable outcome (p for interaction = 0.028) (Figure 2). No significant interactions were found with the subgroups for death at 3 months (Figure S3). History of hypertension showed a significant interaction with ∆SBP at 0–2, 4–12, and 12–24 h for SICH (Figure S4). Baseline SBP subgroups at 0–2 h and reperfusion status at 4–12 h showed a significant interaction with ∆SBP for NIHSS worsening (Figure S5).

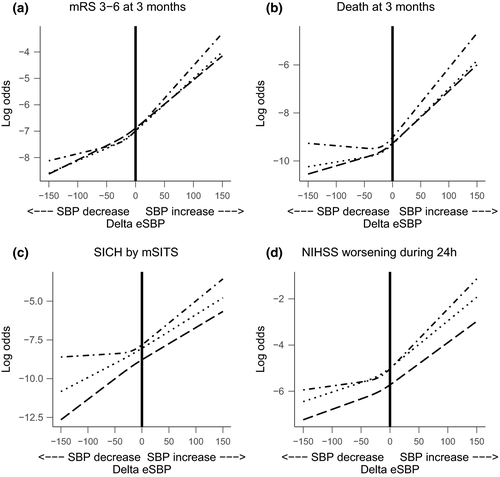
In the sensitivity analysis, we found that ∆SBP had linear-like associations with unfavorable outcome (Figure 3). Steeper slopes were seen with higher values of ∆SBP for most time intervals and outcomes, suggesting an even stronger association with unfavorable outcomes with higher values of ∆SBP.

∆eSBP and clinical outcomes
Mean ∆eSBP was −4.8, −7.1, and −8.1 mmHg for time intervals 2–4, 4–12, and 12–24 h, respectively (Table S1). Mixed effects logistic regression models of ∆eSBP largely followed the same results as ∆SBP. Higher values of ∆SBP were significantly associated with mRS 3–6 for all time intervals (OR 1.114, 95% CI 1.058–1.174; OR 1.107, 95% CI 1.054–1.162; OR 1.060, 95% CI 1.014–1.109 for time intervals 2–4, 4–12, 12–24 h, respectively, for every increase of 10 mmHg ∆SBP) (Table 2).
The association of ∆eSBP in the sensitivity analysis was also linear-like (Figure 4). Again, there was a trend towards unfavorable outcome with higher values of ∆eSBP for all outcomes at all time intervals. Negative ∆eSBP values showed varying associations for the time intervals in both direction and steepness.

DISCUSSION
To our knowledge, this is the first study investigating the association between ∆SBP at different time intervals post-MT and clinical outcomes. Our study demonstrated a direct association between ∆SBP and unfavorable outcome, death, SICH, and neurological deterioration. The results were consistent across all time intervals. The association between ∆SBP and outcomes were independent of age, reperfusion status, stroke severity, baseline SBP, and history of hypertension. When we examined the shape of the relationship between ∆SBP and outcome, we found that the greater the SBP increase post-MT, the higher the risk for unfavorable outcome, death, SICH, and neurological deterioration after MT. Conversely, the greater the SBP reduction post-MT, the lower the odds for unfavorable outcome. Although it should be noted that the association between positive ∆SBP (i.e., SBP increase) and outcomes was more pronounced than the association between negative ∆SBP (i.e., SBP reduction) and outcomes, as seen in the restricted cubic spline models.
Previous studies assessing the association between SBP change and outcomes of MT reported inconsistent results. A previous study of patients with successful reperfusion demonstrated a weak negative association between SBP change in the 24 h following reperfusion and unfavorable outcome.[10 However, when the authors compared SBP increase to different categories of SBP decrease post-MT, SBP reduction had lower odds of unfavorable outcome, though the difference did not reach statistical significance. In a subsequent analysis of the BEST (Blood Pressure after Endovascular Stroke Therapy) prospective study, ∆SBP was associated with unfavorable outcome in the unadjusted model; however, the association became insignificant after adjusting for potential confounders.[11 The difference in the study design and the definition of SBP change between the previous studies likely contributed to the difference in the results. Unlike previous studies, the present study assessed the association between ∆SBP and outcomes at different time intervals.
Underlying hypertension is an important factor that may modify the relationship between BP and outcome. In the present study, ∆SBP in the 0–4 h period was associated with unfavorable outcome only in patients with underlying hypertension but not in those without hypertension. This is not surprising given that the autoregulation curve is shifted rightward in patients with underlying hypertension which makes them more sensitive to BP change (especially BP reduction) than patients without underlying hypertension.[1 Additionally, underlying hypertension interacted with ∆SBP at all time intervals for an increased risk of SICH and only patients with hypertension had higher odds of SICH with higher values of ∆SBP. This is an important finding and highlights the importance of taking into account underlying hypertension when managing BP post-MT.
There is overwhelming evidence suggesting a link between elevated SBP acutely after ischemic stroke and unfavorable outcome,[1-5, 16 yet altering BP has not been found to be beneficial.[17 The ENCHANTED (intensive blood pressure reduction with intravenous thrombolysis therapy for acute ischaemic stroke) randomized controlled clinical trial compared intensive BP treatment approach (SBP goal 130–140 mmHg) to the guideline-recommended SBP goal (180 mmHg) after intravenous thrombolysis treatment.[18 The trial found no difference in functional outcome between the two groups, although the rate of any intracranial hemorrhage was lower in the intensive group. The ENCHANTED trial did not routinely assess reperfusion status and only 1.9% of patients received MT; therefore, its results cannot be generalized to MT patients. Due to lack of randomized trials, the American Heart Association/American Stroke Association (AHA/ASA) guideline recommends a BP goal of 180/105 mmHg or below post-reperfusion therapy, a recommendation that was mostly extrapolated from the intravenous thrombolysis literature.[19 Despite the AHA/ASA recommendations, SBP goals of <140 and <160 mmHg have been widely utilized due to concern of reperfusion injury post-MT.[20 A recent multicenter study compared different SBP goals post successful MT and found that patients treated for SBP goal of <140 mmHg had higher odds of functional independence compared to those treated according the guideline-recommended SBP goal (<180 mmHg).[20
Our results show a strong association between BP increases after thrombectomy and poor outcome after thrombectomy regardless of success or failure of recanalization. It remains unclear whether this association is causative, and if effective and early treatment of BP after thrombectomy improves outcome. This question is being addressed by ongoing clinical trials (NCT04140110, NCT03160677).[21
Limitations
Despite the large sample size and the multicenter design, our study has multiple limitations that need to be considered while interpreting our results. First, the retrospective design of the study is an inherit limitation. Second, there was no standardized BP measurement or management protocols across centers that may have affected our results in an unpredictable manner. Third, we did not have information regarding the type and timing of antihypertensive medications; therefore, we limited our analyses to whether patients received antihypertensive treatment post-MT. Fourth, the outcome measures were reported by participating centers without central adjudications. SITS lacks information on how mRS was performed at each center and certification status of the assessor for mRS. Fifth, we did not have detailed information on SBP during the endovascular thrombectomy (EVT) procedure, other than eSBP. Sixth, we did not have data specifying if a patient was admitted to the intensive care unit during their hospital stay or what type of specialist treated the patient. Finally, we did not have data regarding the infarct volume or extension; therefore, we could not assess the relationship between ∆SBP and infarct extension.
CONCLUSIONS
In acute ischemic stroke patients treated with MT, ∆SBP is associated with poor functional outcome. The association between ∆SBP and poor outcome was mostly linear; however, increasingly worse outcomes were observed for higher values of ∆SBP. The non-linear association of ∆SBP may be an interesting target for future studies and trials.
ACKNOWLEDGMENTS
We thank all Safe Implementation of Treatments in Stroke (SITS) International Stroke Thrombolysis Registry investigators and their centers for their participation. We also thank all the patients who participated in SITS. The current registry is developed, maintained, and upgraded by Zitelab, Copenhagen, Denmark in close collaboration with SITS.
DISCLOSURES
A.H. receives investigator-initiated funding from AMAG and Regeneron Pharmaceuticals. N.A. is the Chairman of SITS International, which receives a grant from Boehringer Ingelheim for the SITS-International Stroke Thrombolysis Register and from Stryker, Covidien, and Phenox in collaboration with Karolinska Institutet for the SITS-OPEN study. The remaining co-authors have no relevant disclosures.
AUTHOR CONTRIBUTIONS
Mohammad Anadani: Conceptualization (equal); Formal analysis (equal); Investigation (equal); Methodology (equal); Writing-original draft (equal); Writing-review & editing (equal). Marius Matusevicius: Conceptualization (equal); Data curation (equal); Formal analysis (equal); Funding acquisition (equal); Investigation (equal); Methodology (equal); Project administration (equal); Software (equal); Writing-original draft (equal); Writing-review & editing (equal). Georgios Tsivgoulis: Data curation (equal); Methodology (equal); Writing-original draft (equal); Writing-review & editing (equal). Andre Philippe Peeters: Methodology (equal); Project administration (equal); Writing-original draft (equal); Writing-review & editing (equal). Ana Paiva Nunes: Data curation (equal); Methodology (equal); Writing-original draft (equal); Writing-review & editing (equal). Michelangelo Mancuso: Data curation (equal); Methodology (equal); Writing-original draft (equal); Writing-review & editing (equal). Christine Roffe: Data curation (equal); Methodology (equal); Writing-original draft (equal); Writing-review & editing (equal). Adam de Havenon: Conceptualization (equal); Formal analysis (equal); Investigation (equal); Methodology (equal); Writing-original draft (equal); Writing-review & editing (equal). Niaz Ahmed: Conceptualization (equal); Data curation (equal); Formal analysis (equal); Investigation (equal); Methodology (equal); Project administration (equal); Resources (equal); Supervision (equal); Writing-original draft (equal); Writing-review & editing (equal).


