Retinal lesions induce fast intrinsic cortical plasticity in adult mouse visual system
Abstract
Neuronal activity plays an important role in the development and structural–functional maintenance of the brain as well as in its life-long plastic response to changes in sensory stimulation. We characterized the impact of unilateral 15° laser lesions in the temporal lower visual field of the retina, on visually driven neuronal activity in the afferent visual pathway of adult mice using in situ hybridization for the activity reporter gene zif268. In the first days post-lesion, we detected a discrete zone of reduced zif268 expression in the contralateral hemisphere, spanning the border between the monocular segment of the primary visual cortex (V1) with extrastriate visual area V2M. We could not detect a clear lesion projection zone (LPZ) in areas lateral to V1 whereas medial to V2M, agranular and granular retrosplenial cortex showed decreased zif268 levels over their full extent. All affected areas displayed a return to normal zif268 levels, and this was faster in higher order visual areas than in V1. The lesion did, however, induce a permanent LPZ in the retinorecipient layers of the superior colliculus. We identified a retinotopy-based intrinsic capacity of adult mouse visual cortex to recover from restricted vision loss, with recovery speed reflecting the areal cortical magnification factor. Our observations predict incomplete visual field representations for areas lateral to V1 vs. lack of retinotopic organization for areas medial to V2M. The validation of this mouse model paves the way for future interrogations of cortical region- and cell-type-specific contributions to functional recovery, up to microcircuit level.
Introduction
In mammals, accurately organized cortical retinotopic maps retain the ability to adapt to changes in sensory input well into adulthood (Wiesel & Hubel, 1963; Merzenich et al., 1983; Kaas, 1991; Buonomano & Merzenich, 1998). In cats and monkeys, depriving a small area of primary visual cortex (V1) from its retinal input can cause a dramatic reorganization of its topography. Immediately after inducing small retinal lesions, neurons in the cortical lesion projection zone (LPZ) become inactive, whereas neurons at the border of the LPZ remain responsive but display enlarged receptive fields that are slightly shifted towards the intact retina surrounding the scotoma. Upon longer recovery periods, much larger receptive field shifts take place, which can result in the complete filling-in of the LPZ, at least if the retinal lesions do not exceed 5° in the visual field (Kaas et al., 1990; Heinen & Skavenski, 1991; Chino et al., 1992, 1995; Gilbert & Wiesel, 1992; Chino, 1995; Das & Gilbert, 1995a,b; Dreher et al., 2001; Giannikopoulos & Eysel, 2006; Hu et al., 2009). This spatiotemporal pattern of recovery of neuronal activity from the LPZ border inwards, as measured by electrophysiology, correlates with visual experience-induced changes in expression levels of the activity reporter gene zif268 in cat V1 (Arckens et al., 2000a,b; Hu et al., 2009). The functional reorganization is believed to involve dynamic structural rearrangements of long-range excitatory horizontal connections as well as compensating modifications of axonal arbors of inhibitory neurons (Yamahachi et al., 2009; Marik et al., 2014).
Despite numerous investigations, hardly any information is available on the impact of retinal lesions outside V1, and unravelling the molecular and cell-type-specific mechanisms underlying the cortical capacity to reorganize neuronal connectivity and functionality calls for the validation of a mouse model (Young et al., 2002; Sawtell et al., 2003; Pham et al., 2004; Tagawa et al., 2005; Hofer et al., 2006a,b; Wandell & Smirnakis, 2009; Huberman & Niell, 2011). Using intrinsic signal imaging strategies, Keck et al. (2008, 2011) were able to show that also in the adult mouse a monocular retinal lesion induces a rapid functional recovery, at least in the supragranular layers of contralateral V1. The observed structural adaptations included a very early decrease in the number of spines and boutons on inhibitory neurons in the upper cortical layers, preceding an increased spine turnover on the apical dendrites of layer V pyramidal cells, followed by the formation of new persistent spines in the later phase of recovery.
To address whether LPZs are induced in- and outside V1 in adult mice by a unilateral retinal lesion we here screened for changes in visually induced zif268 gene expression throughout the complete visual cortex contralateral to the lesioned eye. This approach facilitated the assessment of a potential region- and layer-specific cortical recovery as well as its timing. To confirm the cortical origin, we also investigated the possible variation in retinal lesion size and the effect of the lesion on the superficial layers of the superior colliculus, the main target of retinofugal axons in mice.
Materials and methods
Animals
Adult C57Bl/6J mice of either sex (n = 26) were housed under standard laboratory conditions with a daily photoperiod of 13 h light and 11 h darkness with water and food available ad libitum. All experiments were approved by the ethical research committee of KU Leuven and were in strict accordance with the European Communities Council Directive of 22 September 2010 (2010/63/EU) and with the Belgian legislation (KB of 29 May 2013). Every possible effort was made to minimize the numbers of animals used.
Retinal lesions
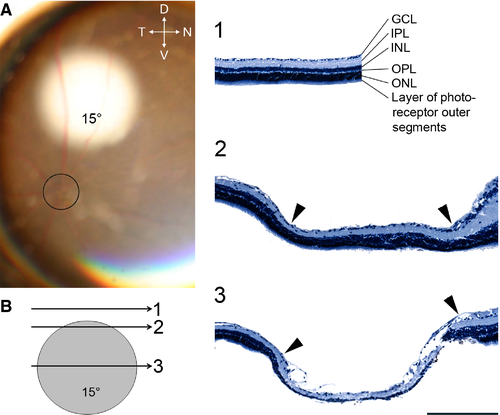
Adult mice (n = 23) were sedated by intraperitoneal injection of a mixture of ketamine hydrochloride (75 mg/kg; Dechra Veterinary Products, Eurovet, Heusden-Zolder, Belgium) and medetomidine hydrochloride (1 mg/kg; Orion Corporation, Elanco Animal Health, Brussels, Belgium), and right retinae were focally photo-coagulated (Fig. 1A) with a single IR laser lesion (600 mW, 150–200 ms; 810-nm IR laser, Oculight SLx, Iris Medical, USA) through a laser-adapted operating microscope (Carl Zeiss, Oberkochen, Germany) and focused to the retina with an attached binocular indirect ophthalmo-microscope (BIOM) especially designed for mice using a 132 D lens (SuperPupil XL, Volk, Mentor, OH, USA). The animals were positioned with the right eye facing the BIOM. Due to anaesthesia there were no disturbing head or eye movements. The fundus was observed through the microscope with a 50° field of view. The papilla served as landmark and all lesions were made with the same spot size setting and in the same dorso-nasal position above the optic disc under continuous visual control. The resulting lesions had diameters of about 15° (Fig. 1A). After injection with atipamezol hydrochloride (1 mg/kg; Orion Corporation, Elanco Animal Health) to reverse anaesthesia, the animals were allowed to recover on a heating pad. They were all administered Meloxicam (1 mg/kg; Boehringer Ingelheim Vetmedica, Ingelheim/Rein, Germany) intraperitoneally every 24 h over the next few days as a systematic analgesic. Subsequently, the mice returned to their home cages for different survival times [RL; 2 days (n = 4), 1 week (n = 5), 3 weeks (n = 5), 4 weeks (n = 5) and 8 weeks (n = 4)] before being killed. Adult control mice (CM, n = 3) were maintained in a similar housing and light environment.
Tissue preparation
Prior to being killed, all mice underwent an overnight dark-exposure followed by 45 min of bright light (always between 09.00 and 11.00 h to minimize any possible variation due to time of the day) to obtain an optimal visually evoked immediate early gene (IEG) expression in the cortex (Worley et al., 1991; Zhang et al., 1994; Kaczmarek & Chaudhuri, 1997; Arckens et al., 2000b; Zangenehpour & Chaudhuri, 2002; Van Der Gucht et al., 2007).
Animals were killed by cervical dislocation upon deep anaesthesia by an overdose of sodium pentobarbital (600 mg/kg; Ceva Santa Animale, Kansas City, KS, USA) injected intraperitoneally. Brains were rapidly removed and immediately frozen in dry-ice-cooled 2-methylbutane (Merck, Overijse, Belgium) at −40 °C and stored at −80 °C until sectioning. Sections 25 μm thick were prepared on a cryostat (Microm HM 500 OM, Walldorf, Germany), mounted on 0.1% poly-l-lysine (Sigma-Aldrich, St Louis, MO, USA)-coated slides, and kept at −20 °C until hybridization.
Retina histology
To verify retinal lesion size, retinae were stained with haematoxylin following standard procedures. Briefly, eyes were removed from the orbits and hemisected near the ora serrata. After removing lens and vitreous, each eyecup was fixed for 30 min in 4% paraformaldehyde (Sigma-Aldrich) in 0.15 m phosphate-buffered saline (PBS, pH 7.42) and embedded in paraffin (McCormick Scientific, St Louis, MO, USA). Sections 7 μm thick were cut on a microtome (Microm HM 360), collected on Mayer's albumin (Prosan, Merelbeke, Belgium)-coated Superfrost Plus slides (Menzel-Gläser, Braunschweig, Germany), stained for 15 min in a haematoxylin solution (0.1% haematoxylin, 0.02% sodium iodate, 5% potassium aluminum sulphate, 0.1% citric acid) and coverslipped.
The variation of the extent of the retinal lesion (n = 5) was calculated by multiplying the number of sections on which the lesion was visible by their thickness, taking the intersection interval into account.
In situ hybridization
In situ hybridization was performed as previously described (Arckens et al., 1995; Nys et al., 2015). Series of coronal brain sections between Bregma levels −2.70 and −4.84 were analysed to examine the exact anatomical location and the spatial extent of neuronal activity changes throughout the complete visual cortex as well as subcortical retinal targets, by measuring changes in the expression of the IEG zif268. A mouse-specific synthetic oligonucleotide probe (Eurogentec, Seraing, Belgium) for zif268 was used as before with sequence 5′- CCGTTGCTCAGCAGCATCATCTCCTCCAGTTTGGGGTAGTTGTCC-3′.
As a first control, sets of tissue sections were hybridized with sense oligonucleotides in an identical manner to the antisense oligonucleotide probes. A competition experiment included the prehybridization of sets of tissue sections with a 50-fold excess of relevant or irrelevant unlabelled probe for 1 h prior to hybridization with labelled antisense probe. Some sections were incubated with RNase-containing buffer (0.005% RNase; Sigma-Aldrich; in 0.1 m phosphate buffer pH 7.4) for 1 h at 37 °C prior to hybridization with labelled probe. All control experiments, except the irrelevant probe test, abolished the signal as generated by normal antisense probe hybridization (Arckens et al., 1995; Van Brussel et al., 2009).
Each probe was 3′-end labelled with 33P-dATP using terminal deoxynucleotidyl transferase (Invitrogen, Paisley, UK). Unincorporated nucleotides were separated from the labelled probe with miniQuick Spin™ Oligo Columns (Roche Diagnostics, Brussels, Belgium). Series of cryostat sections for zif268 were fixed, dehydrated and delipidated. The radioactively labelled probe was added to a hybridization cocktail [50% (vol/vol) formamide, 4× standard saline sodium citrate buffer, 1 × Denhardt's solution, 10% (wt/vol) dextran sulphate, 100 μg/mL herring sperm DNA, 250 μg/mL tRNA, 60 mm dithiothreitol, 1% (wt/vol) N-lauroyl sarcosine, 20 mm NaHPO4, pH 7.4] and applied to the cryostat sections (106 c.p.m. per section) for an overnight incubation at 37 °C in a humid chamber. The following day, sections were rinsed in 1 × standard saline sodium citrate buffer at 42 °C, dehydrated, air-dried and exposed to an autoradiographic film (Biomax MR, Kodak). Films for zif268 were developed in Kodak D19 developing solution after 6 days. Fixation was performed in Rapid fixer (Ilford Hypam, Kodak).
Autoradiographic images from the coronal sections were scanned at 1200 d.p.i. (CanoScan LIDE 600F, Canon) and all files were similarly adjusted for brightness and contrast in Adobe Photoshop CS5.
Histological verification of the position of LPZs in different visual areas
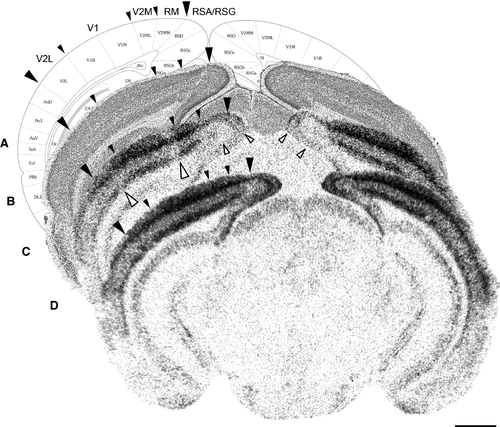
After in situ hybridization, all sections were counterstained with 1% cresyl violet (Fluka Chemical; Sigma-Aldrich) according to standard protocols. Cresyl violet provides sufficient information to delineate the different areas analysed, including primary visual cortex (V1), lateral extrastriate cortex (V2L), medial extrastriate cortex (V2M), rostromedial areas (RM), and agranular and granular retrosplenial cortex (RSA/RSG) (Fig. 2A) as described in detail previously (Van Der Gucht et al., 2007; Van Brussel et al., 2009, 2011; Nys et al., 2014, 2015). All topographic denominations were adopted from these papers. Comparisons were made with the stereotaxic mouse brain atlas (Franklin & Paxinos, 2008).
Defining the extent of the LPZ along the anterior–posterior axis in V1/V2M and SC over time
The anterior and posterior borders of the LPZ in V1/V2M and the superior colliculus (SC) were determined on series of in situ hybridization sections of mice with different survival times (RL 2 days, 1 week, 3 weeks, 4 weeks and 8 weeks) by comparing these images with the atlas of the mouse brain (Franklin & Paxinos, 2008). Based on these Bregma levels, the mean extent of the LPZ along the anterior–posterior axis was calculated for all animals by multiplying the number of sections displaying the lesion by their thickness, taking the intersection interval into account.
Microscopy
Images of the stained retinae and coronal brain sections were obtained at 5 × (NA: 0.16) with a light microscope (Zeiss Axio Imager Z1) equipped with an AxioCam MRm camera (1388 × 1040 pixels) using the software program Axiovision Rel. 4.6 (Carl Zeiss-Benelux).
Quantitative analysis of in situ hybridization results
The optical density (OD) values (mean grey value per pixel) from the autoradiograms of three animals for each condition (RL 2 days, 1 week and 3 weeks, and CM) were quantified using a custom-made MATLAB script (MATLAB R2008b, The MathWorks Inc., Natick, MA, USA) as described earlier (Nys et al., 2014). For each mouse, three 25-μm sections were selected around −3.52 mm relative to Bregma (Franklin & Paxinos, 2008). To demarcate the region of interest in the left hemisphere, we determined the top edge of the cortex, the border between the granular layer IV and infragranular layer V and the boundary where layer VI meets the white matter. These layer-related borders were computed by a contour-smoothing algorithm based on the Gaussian-weighted least squares fit (Birdal, 2011) from manually drawn lines on the autoradiogram. The different areal boundaries as derived from Nissl patterns were subsequently registered to the curvature of the top and bottom boundaries. Next, the delineated region of interest was divided equally into 30 segments creating two lattices of 30 quadrangles, corresponding to the upper (II–IV) and lower (V–VI) layers. To compensate for possible variation in brain size and morphology, we translated the lattice on each autoradiogram over the cortical curvature, fixing the border of a specific segment to an areal border (the border between segment 20/21 and 21/22, for the upper and lower layers respectively, is area border V1/V2M). For segments 3–28 created this way, the relative OD was calculated as the mean grey value of all pixels within this quadrangle normalized to the mean grey value of a square measured in the thalamus (a defined region with no zif268 expression above background). This procedure was required to compare autoradiograms across experiments (Nys et al., 2014). Relative zif268 expression was expressed in percentages based on the following formula: [1−(cortical zif268/thalamic background)] × 100.
We compared zif268 expression between different experimental and control groups for upper and lower layers of the visual cortex separately. Furthermore, relative expression patterns were assessed along the anatomically defined visual subdivisions.
Statistics
For each condition, the extent of the retinal lesion and LPZ as well as data for relative zif268 expression in each segment separately and for all segments in the LPZ are presented as mean ± standard error of the mean (SEM). As not all comparisons displayed a normal distribution of data points (Shapiro–Wilk test) within a group and with equal variance between groups and given the number of animals per group, non-parametric statistical tests were performed. The Kruskal–Wallis one-way analysis of variance on ranks test was used to analyse data of more than two conditions followed by a Tukey post hoc test for all pairwise multiple comparisons. When data coming from two conditions were analysed, a Mann–Whitney rank sum test for pairwise comparison of independent samples was applied. For all tests, the probability level (α-level was set to 0.05) of < 0.05 was accepted as statistically significant. Statistical analyses were performed using SigmaStat 3.1 (SYSTAT software).
Results
Localization of LPZs in the visual cortex
Lesions of 15° in visual angle were made dorso-nasally to the optic disc in the right retina of adult mice by focal laser photo-coagulation (Fig. 1A). To determine the number and position of possible LPZs in the visual cortex where neurons would cease to respond to visual stimulation, we performed in situ hybridization studies to detect localized expression changes for the activity reporter gene zif268 (Fig. 2). This allowed us to distinguish a discrete zone of low IEG expression where the monocular segment of V1 meets the V2M border, and also less clearly delineated spots of low expression in V2L, contralateral to the lesioned eye in the first days following lesion. Areas RM and RSA/RSG displayed expression below normal levels ipsilateral as well as contralateral to the retinal lesion.
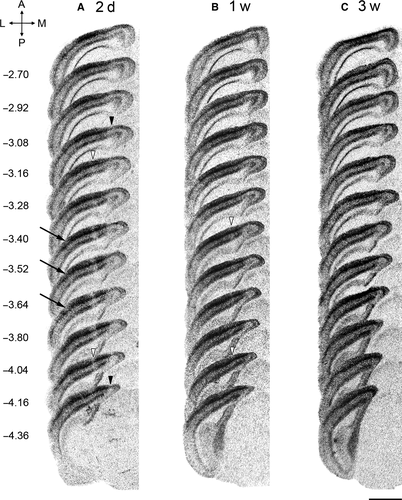
By performing in situ hybridization on series of sections and comparing these images with the atlas of the mouse brain (Franklin & Paxinos, 2008), the anterior and posterior margins of the LPZs in 2-day RL mice could be determined (Fig. 3A). The LPZ that encompassed the V1/V2M border was situated between Bregma levels −3.28 and −4.16, just anterior to the horizontal meridian representation across V1 according to the maps of Wang & Burkhalter (2007). The borders of the LPZ in RM extended even further, reaching maximally Bregma levels −3.16 at the anterior margin and −4.36 at the posterior border. The low expression levels in RSA/RSG were even noticeable along the full antero-posterior extent of the retrosplenial cortex. In V2L, however, delineating a clear LPZ was not possible as decreased expression was visible on only a few brain sections around Bregma level −3.52, not always adjacent to each other, giving it a distributed appearance in comparison with the V1/V2M LPZ.
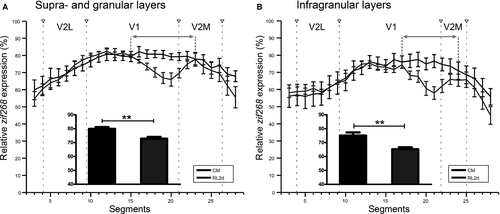
Quantitative analysis of the zif268 expression patterns in visual areas V1, V2M and V2L of 2-day RL mice vs. control mice confirmed the discrete LPZ in monocular V1 and encompassing the border with V2M (Fig. 4: Mann–Whitney rank sum test for pairwise comparison of independent samples; Fig. 4A, upper layers T = 924.000, P = 0.002; Fig. 4B, lower layers T = 729.000, P = 0.004). The size of the LPZ in the upper layers (Fig. 4A) was larger (segments 15–23) than that in the lower layers (segments 17–24) (Fig. 4B), in accordance with its funnel-like appearance (Fig. 2B). In all layers, relative zif268 expression gradually declined and increased when moving in and out of the LPZ, respectively (Fig. 4).
Recovery in the visual cortex
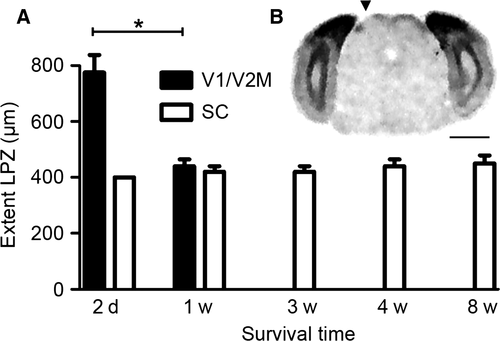
To investigate whether the cortical regions with low IEG expression were able to recover visually induced zif268 expression over time, we performed in situ hybridization on sequential coronal brain sections of mice of different post-lesion survival times (Fig. 3). Figure 3B shows an apparent smaller LPZ in V1/V2M at 1 week when compared with 2 days post-lesion (Fig. 3A), with Bregma levels −3.52 and −4.16 demarcating the LPZ. By 3 weeks this LPZ was no longer discernible (Fig. 3C). The bar graph in Fig. 5A clearly shows the decrease of LPZ extent in V1/V2M caused by the retinal lesion over a period of 3 weeks (RL 2d – RL 1w: Mann–Whitney rank sum test for pairwise comparison of independent samples T = 30.000, P = 0.016). In V2L, RM and RSA/RSG, it is clear that zif268 expression had already recovered within the first week following lesion (compare Fig. 3B and A).
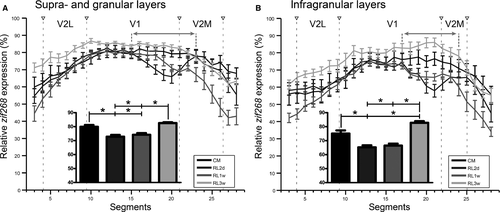
The same reorganization trend in V1/V2M was visible after quantitative analysis (Fig. 6: Kruskal–Wallis one-way analysis of variance on ranks test with Tukey post hoc test; Fig. 6A, upper layers H3 = 35.628, P < 0.001; P < 0.05 for CM – RL 2d & 1w; RL 3w – RL 2d & 1w; Fig. 6B, lower layers H3 = 42.085, P < 0.001; P < 0.05 for CM – RL 2d; RL 3w – RL 2d & 1w). Moreover, this detailed comparison revealed that zif268 expression exceeded control levels in the infragranular layers of the former LPZ 3 weeks after the lesion (Fig. 6B, lower layers: Kruskal–Wallis one way analysis of variance on ranks test followed by Tukey post hoc Test, H3 = 42.085, P < 0.001; P < 0.05), suggesting a layer-specific response to the lesion.
Verification of the cortical nature of recovery
Next we determined whether the retina and an important direct retinal target structure in the mouse, the superior colliculus (SC), showed any sign of reorganization. Independent of survival time, the extent of the retinal lesion was on average 500 ± 47 μm, based on histology. This correlates well with the intended size, as 1° of visual angle corresponds to 31 μm in the mouse eye (Remtulla & Hallett, 1985). Figure 1B shows retinal cross-sections at different positions within the lesion (panels 1–3). Comparison of the retinal morphology inside and outside the lesion zone demonstrated that the damage caused by the laser is not completely uniform. Beyond the lesioned area (Fig. 1B, panel 1), the different retinal layers were clearly visible including the ganglion cell layer (GCL), the inner plexiform layer (IPL), the inner nuclear layer (INL), the outer plexiform layer (OPL) the outer nuclear layer (ONL) and the layer of photoreceptor outer segments. The transition between normal and lesioned retina was rather gradual. At the border (Fig. 1B, panel 2), damage was mostly detected near the photoreceptor layer and GCL, whereas all retinal layers were affected near the centre (Fig. 1B, panel 3). Histology revealed anatomical features comparable to those found in cats with retinal laser lesions, which could indicate that the lesioned retinal tissue became scar tissue (Eysel et al., 1981).
In the SC, zif268 expression patterns allowed the localization of a clear and circumscribed LPZ in the upper optical layers. Its location in the lateral posterior part of the contralateral SC (Fig. 5B) is retinotopically correct, with an extent of approximately 400 μm between Bregma levels −4.04 and −4.48 in 2-day RL mice (Fig. 5A). To judge a possible recovery over time, we also examined the SC of RL mice 1–8 weeks after the lesion. The SC still showed a discrete zone of diminished zif268 expression of comparable size and location to 2-day mice, thereby excluding any kind of recovery of subcortical visual experience-induced neuronal activity (Fig. 5A, Kruskal–Wallis one way analysis of variance on ranks, H4 = 3.149, P = 0.533).
The zif268 expression in the dorsal lateral geniculate nucleus (dLGN) of the thalamus was already extremely low in controls, making it impossible to judge any loss of signal due to the retinal lesion, as reported before in cat (Zhang et al., 1994; Arckens et al., 2000b), monkey (Soares et al., 2005) and mouse (Takahata et al., 2008). An earlier electrophysiological study in the cat described a spatially quite restricted functional recovery in the dLGN (Eysel, 1982).
Discussion
Employing in situ hybridization for zif268 we demonstrated a decline in visually induced neuronal activity upon induction of an irreversible monocular retinal lesion in multiple regions throughout the cortex of the adult mouse. In ensuing weeks, full recovery of cortical zif268 expression levels first occurred in higher order visual areas, but V1 also showed the capacity for a fast and complete intrinsic recovery.
zif268: a secondary indicator for neuronal activity changes in the visual system of mammals
Light stimulation after a period of darkness induces the rapid and transient expression of IEGs in the visual cortex of many mammalian species, including mouse (Worley et al., 1991; Arckens et al., 2000b; Correa-Lacarcel et al., 2000; Mataga et al., 2001; Van Der Gucht et al., 2002). Glutamate receptor activation can increase cytosolic Ca2+ levels, influencing several signal transduction pathways that trigger the expression of, for example, the IEG zif268 (Mataga et al., 2001; Knapska & Kaczmarek, 2004; Soares et al., 2005). As a regulatory transcription factor, Zif268 protein controls the expression of a diverse set of neuronal proteins (Knapska & Kaczmarek, 2004). Because synaptic activity regulates its expression, zif268 acts as an excellent marker to map brain areas adapting their level of neuronal activity to changes in visual stimulation (Kaczmarek & Chaudhuri, 1997; Arckens et al., 2000b, 2003; Massie et al., 2003a,b; Qu et al., 2003; Leysen et al., 2004; Hu et al., 2009; Van Brussel et al., 2009, 2011; Woolley et al., 2013; Nys et al., 2014, 2015). Due to a relatively high basal expression level of zif268 mRNA in adult visual cortex, both short- and long-term visual deprivation strategies can generate a measurable down-regulation of expression as well as its restoration to normal/higher levels by subsequent experience-induced stimulation (Kaczmarek & Chaudhuri, 1997). In monkey visual cortex, preferential expression of Zif268 protein in excitatory neurons has been demonstrated (Chaudhuri et al., 1995; Kaczmarek & Chaudhuri, 1997). Combined with the notion that zif268 expression can be tightly regulated by pharmacologically manipulating excitatory transmission (Saffen et al., 1988; Cole et al., 1989; Worley et al., 1991; Mataga et al., 2001), we interpret the in situ hybridization experiments for zif268 as a screening for brain regions showing alterations in synaptic activity of predominantly excitatory neurons over time in response to visual deprivation.
Position and size of LPZs in the visual cortex: indicators of retinotopy and cortical magnification factor
Within V1 the location of the LPZ is consistent with previously reported retinotopic maps, in which ganglion cells located in the upper nasal retina, and which receive information about the peripheral lower visual field, project to more anterior and medial parts of V1 (Dräger, 1975; Wagor et al., 1980; Schuett et al., 2002; Kalatsky & Stryker, 2003; Wang & Burkhalter, 2007; Bonin et al., 2011; Marshel et al., 2011; Garrett et al., 2014). The position of this LPZ at the V1/V2M border also matches the position of the lower temporal visual field representation at the transition zone of V1 with the posteromedial area (Wang & Burkhalter, 2007; Garrett et al., 2014).
Only recently, Garrett et al. (2014) reported the absence of a representation of the lower visual field in several mouse visual areas, which explains the lack of evidence for a clear LPZ in several higher order areas. The very small and distributed zones with reduced zif268 expression which we located in extrastriate visual cortex lateral to V1 indeed confirm that several higher order visual areas in the mouse may not contain a full representation of the visual field. Consistent with this interpretation, and with their position around Bregma level −3.64, these small LPZs would be situated where the lateromedial (LM), laterointermediate (LI), and the anterolateral (AL) areas meet in the elevation maps of Garrett et al. (2014).
The size of the cortical LPZ was not previously specifically measured in mice after retinal lesions. Calculations using the cortical magnification factors obtained by Schuett et al. (2002) for V1 (mediolateral 14.5 ± 5.4 μm/°, anterior–posterior 24.8 ± 5.9 μm/°) predict a medio-lateral width of the LPZ in V1 in the range 225–300 μm ± 37% and an anterior–posterior extent of 372–440 μm ± 24%. These predictions fit the mediolateral range of the LPZ shown with zif268 in V1 in Fig. 2B but underestimate the anterior–posterior size of the LPZ after 2 days as shown in Fig. 5A. However, the detailed mapping of 11 mouse visual areas and their cortical magnification factor using optical imaging (Garrett et al., 2014) suggests differences in magnification factor across a given area. For V1, this demonstrates a larger magnification factor along the anterior–posterior axis of the brain exactly at the border between V1 and more medial visual cortex, and thus at the position of the elongated V1/V2M LPZ.
In binocular vision animals such as cats and monkeys, monocular retinal lesions have been described to have an impact on neuronal activity only in the monocular parts of the cortex situated in the contralateral hemisphere (Rosa et al., 1995). Obviously, the fellow eye compensates for the visual deficit in largely binocular-driven visual cortex, an observation strengthened by investigations where the fellow eye has been removed to dissect the impact of monocular retinal lesions on visual cortex activation and plasticity (Kaas et al., 1990). In our mice, a monocular retinal lesion did induce a clear zone with decreased zif268 expression in ipsilateral and contralateral RM areas, the transition zone between the retrosplenial areas and area V2M, despite the binocular input to this area (Wagor et al., 1980; Van Der Gucht et al., 2007; Van Brussel et al., 2009, 2011). Area RM is the medially located extrastriate cortical region that corresponds to V2MM in the atlas of the mouse brain (Franklin & Paxinos, 2008) and the mediomedial area (MM) in the maps of Wang & Burkhalter (2007). Although Wang & Burkhalter (2007) could only weakly label connections between V1 and this area, our results and previous studies in our lab suggest that this area responds very strongly to visual deprivation, just like areas RSA/RSG (Van Der Gucht et al., 2007; Van Brussel et al., 2009, 2011; Nys et al., 2014). Optical imaging also revealed visual responsiveness in this cortical zone medial to V2M but no retinotopy (Garrett et al., 2014), a finding that can explain our observations of a bilateral, more widespread rather than localized impact of the partial vision loss on zif268 expression.
Rapid functional recovery in the visual cortex
The LPZ in V1/V2M regained visual zif268 induction within 3 weeks following lesion. This result corresponds to the first period of rapid retinotopic and structural reorganization revealed by Keck et al. (2008) using intrinsic-signal imaging in mouse visual cortex after a unilateral retinal lesion of similar position but larger size. During the first month after the lesion, apical dendritic tufts of layer V pyramidal cells in the LPZ showed a 3.5-fold increase in spine turnover. The new spines probably form the structural basis for the rapid functional reorganization of the LPZ in contralateral monocular V1 (Keck et al., 2008). Even when adult mice undergo monocular enucleation, contralateral V1 can still regain a normal zif268 expression pattern, with the fellow-eye-driven reorganization component responsible for the expansion of the binocular cortex into monocular territory also occurring in the first 3 weeks following enucleation (Van Brussel et al., 2011; Nys et al., 2014, 2015).
The swiftness of recovery, and also the completeness, could be related to the large receptive fields of V1 cortical neurons in mice compared with monkeys (Niell & Stryker, 2008; Gao et al., 2010; Van den Bergh et al., 2010; Vreysen et al., 2012), a hypothesis that could be tested via future in-depth analysis of the response to binocular retinal lesions of higher order visual areas in higher order binocular vision mammals. Shao et al. (2013) have already demonstrated that area MT in monkeys has a higher potential for reorganization after macular degeneration than V1, and higher order visual areas in rodents also exhibit much larger receptive fields than area V1 (Huang et al., 2007; Van den Bergh et al., 2010; Vermaercke et al., 2014). The observation that the V1/V2M LPZ was the last to fully recover visual responsiveness may also be related to the cortical magnification factor being the largest along the anterior–posterior axis exactly at the border where V1 meets V2M (Garrett et al., 2014), indicating that the largest cortical surface had to be reorganized.
Previous investigations dealing with zif268 expression levels as an indicator of recovery of visually driven neuronal activity reported zif268 levels exceeding normal values exactly in those parts of the visual cortex that undergo spatio-temporally matching binocular lesion-induced changes in excitability as measured by electrophysiology (Arckens et al., 2000b; Giannikopoulos & Eysel, 2006; Hu et al., 2009, 2011). Imbrosci et al. (2015) observed zif268 levels above control in transhemispheric diaschysis, paralleled by a shift in the excitatory–inhibitory balance in favour of excitability as detected by in vitro patch-clamp recordings. In cats with binocular retinal lesions, the location and timing of abnormally high cortical IEG expression matched the LPZ border of intense receptive field remapping (Arckens et al., 2000b). In the current mouse study, the observation of such an increase in zif268 levels above control at the LPZ site itself therefore fits the interpretation that this is the part of the mouse visual cortex where functional recovery exactly takes place, making it a plausible counterpart for the LPZ border in higher order mammals such as cat and monkey for future investigations about the cell-type-specific contribution to adult visual cortex plasticity.
A role for inhibition in lesion-induced adult cortex plasticity
Mechanistically, the retinal lesion may lower the threshold of predominant contralateral visually driven cells in the visual cortex, allowing formerly weak ipsilateral as well as top-down visually driven synapses to promote the reorganization. Indeed, previous studies have shown that acute reduction of inhibition reveals the presence of sub-threshold synaptic inputs to cortical neurons (Jacobs & Donoghue, 1991; Harauzov et al., 2010; Keck et al., 2011). So far the only evidence for a change in the mouse inhibitory circuit has come from V1 investigations. Within the first hours after the lesion, the inhibitory spine density decreases in the supragranular layers of V1 followed by that of the inhibitory boutons. The decrease is strongest in the centre but also occurs outside the LPZ, although with a gradual decline when moving further away from the lesion projection zone (Keck et al., 2011). This pattern of inhibitory spine and bouton dynamics is consistent with our optical density measurements of the zif268 signal, which revealed a gradual decrease from the border regions into the centre of the LPZ. Upon lesion induction, the resulting lowered overall inhibitory drive thus possibly triggers excitatory changes to accomplish the reorganization consistent with the detected increase in zif268 expression levels 3 weeks after visual manipulation. The supragranular and infragranular layers in the V1/V2M LPZ displayed a differential time-dependent recovery profile upon deprivation, with an increase in expression reaching control levels or even higher levels, respectively. This layer-specific effect was also observed in area 17 of retinal lesion cats, by both electrophysiology and IEG detection (Waleszczyk et al., 2003; Hu et al., 2010), or upon monocular enucleation in mouse visual cortex (Van Brussel et al., 2011; Nys et al., 2014) and can be attributed to the layer-dependent distribution of glutamate receptors (Waleszczyk et al., 2003; Hu et al., 2010) that causes the layer-specific zif268 expression. However, whereas infragranular layers recover faster and more extensively in mice, as suggested by the funnel-like shape of the zif268 expression pattern in relation to the V1/V2M LPZ, the opposite holds in cats where supragranular layers were witnessed to recover deeper into the LPZ than infragranular layers (Arckens et al., 2000b).
A permanent LPZ in the superior colliculus
The lateral posterior location of the LPZ in the SC is in accordance with previous mapping studies which show that the temporal part of the contralateral visual field projects posteriorly, and the inferior visual field laterally in the SC of the mouse (Dräger & Hubel, 1975, 1976). In contrast to the visual cortex, the SC showed no signs of recovery, not even after 8 weeks. In newborn rodents reorganization of retinocollicular projections can be induced by a retinal or optic tract lesion, or unilateral enucleation, resulting in an aberrant projection of ipsilateral retinal ganglion cell axons of the intact eye to the SC (Lund et al., 1973; Lund & Lund, 1976; Godement et al., 1980; Serfaty & Linden, 1991; Hanson & Reese, 1993; Serfaty et al., 2005). In adult rodents, however, this reorganization of retinocollicular projections does not occur (Lund et al., 1973; Lund & Lund, 1976), unless induced experimentally (Tropea et al., 2003; Cancedda et al., 2004; Landi et al., 2007; Caleo et al., 2009).
In conclusion, a discrete monocular retinal lesion immediately influences neuronal activity throughout all cortical layers of more than one area within adult mouse visual cortex. With time, the visual areas display the intrinsic capacity to reorganize and this persists well into adulthood, at a time when the capacity for ocular dominance plasticity has substantially decreased. The speed of the recovery mirrors cortical magnification factor, receptive field size and retinotopic organization. Interestingly, in mouse visual cortex the absence of a clear LPZ reflects an incomplete or partially condensed visual field representation for areas lateral to V1 and the absence of retinotopic organization in areas medial to V2M, as recently also witnessed using an optical imaging approach (Garrett et al., 2014). The validation of this rodent model for deprivation-induced cortical plasticity may facilitate new investigations towards a better understanding of brain-region-, cell-type- and microcircuit-specific contributions to different forms of neuronal plasticity.
Conflict of interest
The authors declare that they have no conflict of interest.
Acknowledegements
This work was supported by grants of the Fund for Scientific Research – Flanders, Belgium (FWO), the Research Fund of the KU Leuven, Belgium (OT 09/022) and the German Research Foundation (DFG SFB 874, TP A2), a PhD fellowship of the Agency for Innovation through Science and Technology Flanders (IWT Vlaanderen, 101421) to K.S., an FRQS postdoctoral fellowship (FF6-14P/27498) and an FWO postdoctoral fellowship (12I7 316N/16144) to M.E.L., and an FWO Flanders PhD grant to A.C. and J.N. We thank Ria Vanlaer and Lieve Geenen for excellent technical assistance.
Abbreviations
-
- CM
-
- control mouse
-
- dLGN
-
- dorsal lateral geniculate nucleus
-
- GCL
-
- ganglion cell layer
-
- IEG
-
- immediate early gene
-
- INL
-
- inner nuclear layer
-
- IPL
-
- inner plexiform layer
-
- LPZ
-
- lesion projection zone
-
- OD
-
- optical density
-
- ONL
-
- outer nuclear layer
-
- OPL
-
- outer plexiform layer
-
- RL
-
- retinal lesion
-
- RM
-
- rostromedial areas
-
- RSA/RSG
-
- agranular and granular retrosplenial cortex
-
- SC
-
- superior colliculus
-
- V1
-
- primary visual cortex
-
- V2L
-
- lateral extrastriate cortex
-
- V2M
-
- medial extrastriate cortex


