Issue Cover (March 2015)
Graphical Abstract
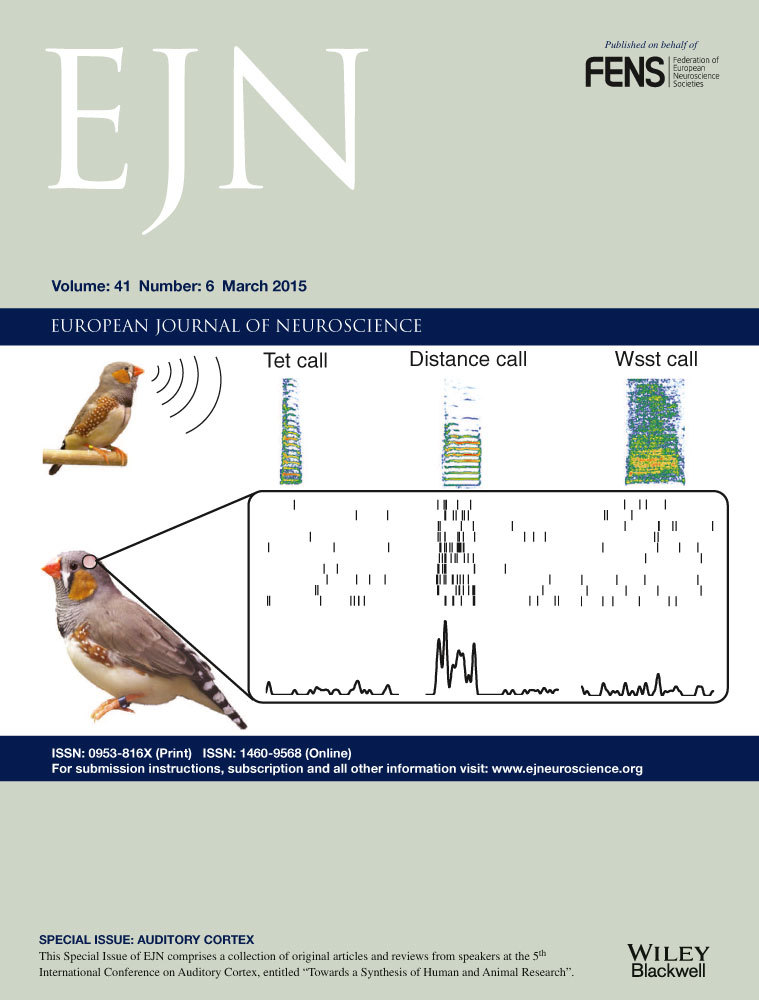
Cover Illustration: Neuroelectrophysiological activity recorded in the avian auditory cortex of zebra finches in response to conspecific vocalizations that have different meanings. The top row shows the spectrogram of the vocalizations, the middle section the spike rasters obtained for 10 presentations of that same sound, and the bottom row the Post Stimulus Time Histogram (PSTH) or average spike response in number of spikes per ms. PSTH values ranges between 0 and 100 spikes per ms for the example cell. This cell shows selective response for one category of vocalizations, the Distance call. For details see the article of Elie & Theunissen (Meaning in the avian auditory cortex: neural representation of communication calls. Eur. J. Neurosci., 41, 546–567).