Identification of a direct GABAergic pallidocortical pathway in rodents
Abstract
Interaction between the basal ganglia and the cortex plays a critical role in a range of behaviors. Output from the basal ganglia to the cortex is thought to be relayed through the thalamus, but an intriguing alternative is that the basal ganglia may directly project to and communicate with the cortex. We explored an efferent projection from the globus pallidus externa (GPe), a key hub in the basal ganglia system, to the cortex of rats and mice. Anterograde and retrograde tracing revealed projections to the frontal premotor cortex, especially the deep projecting layers, originating from GPe neurons that receive axonal inputs from the dorsal striatum. Cre-dependent anterograde tracing in Vgat-ires-cre mice confirmed that the pallidocortical projection is GABAergic, and in vitro optogenetic stimulation in the cortex of these projections produced a fast inhibitory postsynaptic current in targeted cells that was abolished by bicuculline. The pallidocortical projections targeted GABAergic interneurons and, to a lesser extent, pyramidal neurons. This GABAergic pallidocortical pathway directly links the basal ganglia and cortex, and may play a key role in behavior and cognition in normal and disease states.
Introduction
The basal ganglia are a collection of heterogeneous forebrain structures that play a critical role in motor behavior, cognition, affect, and sleep–wake regulation. One model of basal ganglia function proposes direct and indirect pathways for processing cortical information within the basal ganglia for output back to the cortex (Albin et al., 1989). In both pathways, the basal ganglia output to the cortex occurs via thalamic relays, either directly from the striatum to the globus pallidus interna (GPi) and the substantia nigra reticulata (SNr), or indirectly via the globus pallidus externa (GPe), the subthalamic nucleus (STN), and the GPi/SNr. This model of basal ganglia function provides an interpretative framework for understanding the etiology and pathogenesis of such disorders as Parkinson's disease, but it is insufficient to explain many pathological features of these diseases (Obeso et al., 2008).
Basal ganglia structures such as the GPe have robust connections within the basal ganglia, receiving striatal and subthalamic inputs and projecting back to these structures and the SNr and GPi, connecting every input and output structure of the basal ganglia (Kita, 2007). Basal ganglia outputs to the cortex, however, are thought to be primarily mediated by basal ganglia–thalamus–cortex relays. Deep brain stimulation of the STN and GPe ameliorates the symptoms of Parkinson's disease (Vitek et al., 2012), but stimulation of the thalamus, the putative output relay for the basal ganglia, improves tremor but not necessarily bradykinesia and rigidity (Fasano et al., 2012). Studies of the role of the basal ganglia in sleep add further complexity to the interaction of basal ganglia structures and other brain regions. Lesions of the GPe, but not of the STN or SNr, produce profound increases in wakefulness and alter motor behavior in rats (Qiu et al., 2010). In contrast, lesions of the thalamus have a minimal effect on overall sleep–wake patterns (Fuller et al., 2011). These findings suggest the intriguing hypothesis that the basal ganglia, specifically the GPe, project to and directly communicate with other structures in the brain to influence behavior. Retrograde tracing from the cortex has previously identified neurons located in the GPe projecting to the cortex, but no study has shown that these are GPe neurons of the basal ganglia, rather than basal forebrain (BF) cortically projecting neurons (Saper, 1984; Zaborszky et al., 2013). GABAergic GPe neurons projecting directly to the cortex would denote a novel basal ganglia output pathway with a potentially unique role in regulating motor and premotor cortical activity.
To investigate the efferent projection targets of the GPe, we performed unilateral injections of an adeno-associated viral vector (AAV) expressing a channelrhodopsin-2 (ChR2)–yellow fluorescent protein (YFP) fusion product into the GPe of rats. We combined retrograde and anterograde tracing to confirm that the pallicortical pathway originates from GPe neurons, and we used AAV–ChR2 in Vgat-ires-cre mice to specify and differentiate novel GPe projections. Finally, we used in vitro optogenetic stimulation of these GABAergic GPe projections to explore their functional role in cortical control.
Materials and methods
Tracer injections
Twelve adult male Sprague-Dawley rats, weighing 300–325 g (Taconic, Hudson, NY, USA), and five adult female Vgat-ires-cre mice (Vong et al., 2011), weighing 20–25 g, were used. Rats were individually housed, and mice were group-housed, in temperature-controlled and humidity-controlled rooms, under 12 : 12-h light–dark cycles with ad libitum access to food and water. Animal care was in accordance with National Institutes of Health standards, with measures to minimise pain and discomfort, and all procedures used were approved by the Beth Israel Deaconess Medical Center Institutional Animal Care and Use Committee. Rats and mice were weighed, anesthetised with an intraperitoneal injection of a ketamine (100 mg/kg)–xylazine (10 mg/kg) mixture, and placed into a stereotaxic frame. The cranium was exposed for measurement of coordinates relative to bregma, and a burr hole was made for injections. A 1-mm glass pipette with a 10–20-μm tapered tip was inserted into the brain at the calculated coordinates. Injections were performed with electronically controlled air puffs lasting for 5–10 ms at 1–2 Hz. Injection volume was determined by measuring the meniscus of the injection liquid within the pipette by use of calibrated reticules on a surgical microscope. After 5 min of waiting to prevent backflow, the pipette was raised. After all injections, the scalp wound was closed with surgical clips, and the rodents were given meloxicam (5 mg/kg) subcutaneously once daily for 2 days.
We used at least five rodents in each tracing group to ensure consistency of the neuroanatomical pathways described; none of the rodents had undergone any previous procedures. In six rats, we performed unilateral injections (24 nL) of elongation factor-1 alpha (EF1a)–humanised ChR2 (hChR2) (H134R)–enhanced YFP (eYFP)–AAV10 into the GPe [AP = −1.0 mm, ML = −3.2 mm, DV = −5.2 mm (Paxinos & Watson, 2005)]. In six rats, we performed unilateral injections of fluorogold (120 nL) into frontal area 2 (Fr2) (AP = 3.2 mm, ML = 2.0 mm, DV = −1 mm), and, in two of these rats, unilateral injections of biotinylated dextran amine (45 nL) into the dorsal striatum [caudate putamen (CPu)] (AP = −1.7 mm, ML = 2.8 mm, DV = −4.2 mm). For mice, we performed unilateral injections (15 nL) of EF1a–double-floxed inverse ORF (DIO)–hChR2 (H134R)–eYFP–AAV10 into the GPe [AP = −0.35 mm, ML = −1.8 mm, DV = −3.3 mm (Franklin & Paxinos, 2008)]. All AAV–hChR2 (H134R)–YFP vectors were generously provided by K. Deisseroth, and were packaged into AAV10. The vector stocks were titered by real-time polymerase chain reaction with an Eppendorf Realplex machine. The titer of the preparations ranged from approximately 1 × 10¹² to 1 × 10¹³ vector genomes copies/mL.
Immunohistochemistry
At least 2 weeks after injection, animals were deeply anesthetised with 7% chloral hydrate and perfused with 10% buffered formalin (Fisher Scientific, Pittsburgh, PA, USA). Brains were transferred to a solution of 20% sucrose and phosphate-buffered saline containing 0.02% sodium azide overnight, and then sliced into four series of 40-μm sections with a freezing microtome. For staining, we incubated tissue in primary polyclonal anti-green fluorescent protein (GFP) 1 : 20 000 (Invitrogen; A-6455, Lot 622086) or anti-fluorogold 1 : 10 000 (Chemikon; AB153) for 24 h, and then in biotinylated secondary antiserum in phosphate buffered saline with Triton-×100 (PBST) (Vector Laboratories) for 1 h. After being washed with phosphate-buffered saline, tissue was incubated with an avidin–biotin–horseradish peroxidase conjugate (Vector Laboratories), and stained brown with 0.05% 3,3′-diaminobenzidine tetrahydrochloride (Sigma, St Louis, MO, USA) and 0.02% H2O2, or black with 0.05% cobalt chloride and 0.01% nickel ammonium sulfate. Sections were then mounted onto slides [some sections were stained with 0.1% Thionin (Sigma)], dehydrated, and coverslipped.
Grayscale figures were obtained in monochrome with a blue filter in adobe photoshop, which minimises the blue channel dominated by the thionin Nissl staining while preserving the black or brown staining for better visualisation of projections from the injection site. To quantify staining intensity, we inverted the grayscale figures, marked the cortical subregion boundaries, and measured the pixel intensity in imagej on a 200-pixel line drawn from the edge of the cortex to the white matter in each cortical subregion. The intensity was normalised to the average of all measured subregions, and the distance from edge of the cortex was normalised to each measurement.
Whole cell in vitro experiments
Vgat-ires-cre, lox-GFP (n = 7) mice (8 weeks, 20–25 g) were used for in vitro electrophysiological recordings. This number of mice was used to allow successful recording of a sufficient number of Fr2 neurons to functionally characterise the pallidocortical pathway. EF1a–DIO–hChR2 (H134R)–eYFP–AAV10 (15 nL) was injected bilaterally in the GPe (AP = −0.35 mm, ML = −1.8 mm, DV = −3.3 mm). Four weeks after these injections, mice were used for in vitro electrophysiological recordings. Mice were anesthetised (150 mg/kg ketamine and 15 mg/kg xylazine, intraperitoneal) and transcardially perfused with ice-cold artificial cerebrospinal fluid (N-methyl-d-glucamine-based solution) containing: 100 mm N-methyl-d-glucamine chloride, 2.5 mm KCl, 1.24 mm NaH2PO4, 30 mm NaHCO3, 20 mm HEPES, 25 mm glucose, 2 mm thiourea, 5 mm sodium ascorbate, 3 mm sodium pyruvate, 0.5 mm CaCl2, and 10 mm MgSO4 (adjusted to pH 7.3 with HCl when carbogenated with 95% O2 and 5% CO2). Their brains were quickly removed and cut into coronal frontal cortical slices (thickness, 250 μm) with a vibrating microtome (VT1000; Leica, Bannockburn, IL, USA). Slices containing Fr2 were transferred to normal artificial cerebrospinal fluid (sodium-based solution) containing: 120 mm NaCl, 2.5 mm KCl, 10 mm glucose, 26 mm NaHCO3, 1.24 mm NaH2PO4, 1.3 mm MgCl2, 4 mm CaCl2, 2 mm thiourea, 1 mm sodium ascorbate, 3 mm sodium pyruvate, and 1 mm kynurenic acid (pH 7.4 when carbogenated with 95% O2 and 5% CO2, 310–320 mOsm).
Recordings were made from 17 GFP-positive and 19 pyramidal cells in the deep layers (V/VI) of the Fr2 premotor cortex from seven mice. On average, five neurons per mouse were recorded (ranging from 4–7 per mouse). Recordings were guided with a combination of fluorescence and infrared (IR) differential interference contrast video microscopy and a fixed-stage upright microscope (BX51WI; Olympus America) equipped with a Nomarski water immersion lens (×40/0.8 W) and IR-sensitive CCD camera (ORCA-ER; Hamamatsu, Bridgewater, NJ, USA), and images were displayed on a computer screen in real time by the use of axiovision software (Carl Zeiss MicroImaging). Recordings were conducted in whole cell configuration at room temperature with a Multiclamp 700B amplifier (Molecular Devices, Foster City, CA, USA), a Digidata 1322A interface, and clampex 9.0 software (Molecular Devices). Globus pallidus axons and synaptic terminals expressing ChR2 were activated by full-field 5-ms flashes of light (~10 mW/mm2, 1-mm beamwidth) from a 5-W luxeon blue-light-emitting diode (wavelength, 470 nm; #M470L2-C4; Thorlabs, Newton, NJ, USA) coupled to the epifluorescence pathway of the Zeiss microscope. The area stimulated included the recorded cell, which is in the center of a 500-μm-radius concentric field. Photo-evoked inhibitory postsynaptic currents (IPSCs) were recorded at Vh = −40 mV in a potassium gluconate-based pipette solution containing: 120 mm potassium gluconate, 10 mm KCl, 10 mm HEPES, 3 mm MgCl2, 5 mm K-ATP, 0.3 mm Na-GTP, and 0.5% biocytin (pH adjusted to 7.2 with KOH, 280 mOsm). The liquid junction potential was calculated to be +13.2 mV, and no recordings were corrected for it.
Electrophysiological data were analysed with clampfit 9.0 (Molecular Devices) and igor pro 6 (WaveMetrics, Lake Oswego, OR, USA). Synaptic events were detected off-line with mini analysis 6 (Synaptosoft, Leonia, NJ, USA). Action potential duration was calculated as the width at the voltage halfway between the action potential threshold and the action potential peak, and action potential threshold was calculated as the voltage at which the slope of the action potential reached ≥20 V/s. The latency of the photo-evoked IPSCs was determined from the time difference between the start of the light pulse and the 5% rise point of the first IPSC. Results are expressed as mean ± standard error of the mean (SEM), and n refers to the number of cells. Immediately following the in vitro recordings, recorded slices and slices containing the injection site were fixed in 10% buffered formalin (overnight), and then cryoprotected in 40% sucrose and re-sectioned into 60-μm sections on a freezing microtome. We examined the sections under fluorescence to verify the location and extent of ChR2–YFP-expressing neurons in the injection sites, as the GPe injection site clearly showed dense fibers and terminals in addition to the native GFP fluorescence. We then incubated the sections overnight in an avidin–biotin–horseradish peroxidase conjugate (Vector Laboratories) and stained them with 0.05% 3,3′-diaminobenzidine tetrahydrochloride (Sigma), 0.02% H2O2, 0.05% cobalt chloride, and 0.01% nickel ammonium sulfate. Sections were then mounted onto slides, dehydrated, and coverslipped.
Statistical analysis
For analysis of the response rate of pyramidal (n = 19) and non-pyramidal (n = 17) neurons, we compared the proportions of responding and non-responding neurons of each type with Fisher's exact test (GraphPad).
Results
Rat GPe projections
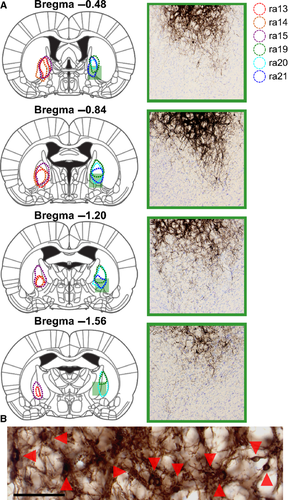
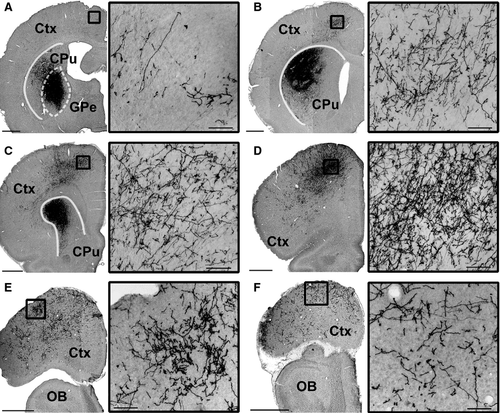
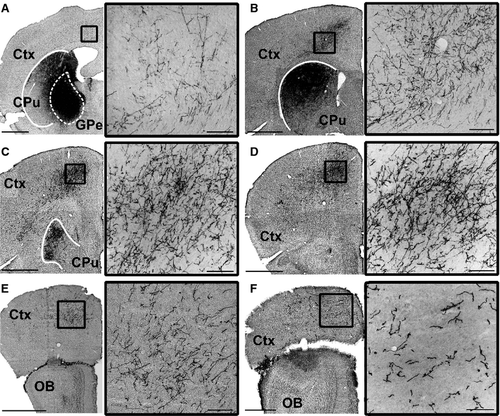
In all six rats tested, tracer injections filled cell bodies and local fibers within the anterior GPe without filling cells in the BF (Figs 1 and 2A–C). Starting from the rostrocaudal level of the GPe, we observed, in all rats, innervation of Fr2, an anatomical region also known as the secondary motor cortex/frontal cortex, agranular medial cortex, medial precentral area, and secondary motor area (Uylings et al., 2003). The projections were ipsilateral, passing through the striatum and terminating in Fr2 (Fig. 2A). Fr2 projections were sparse at the level of the injection, increased in density in rostral sections (Fig. 2B and C), and reached their greatest density at the rostral extent of the striatum (Fig. 2D). GPe projections reached the most rostral parts of the forebrain (Fig. 2E and F), spreading laterally in frontal regions while remaining sparse in the medial wall and orbital regions (Fig. 2F). Projections to Fr2 appeared to be topographic, with more lateral injections within the GPe producing more lateral projections to both the striatum and Fr2. However, projections always targeted Fr2 while avoiding the anterior cingulate cortex. No cell bodies were stained in the cortex.
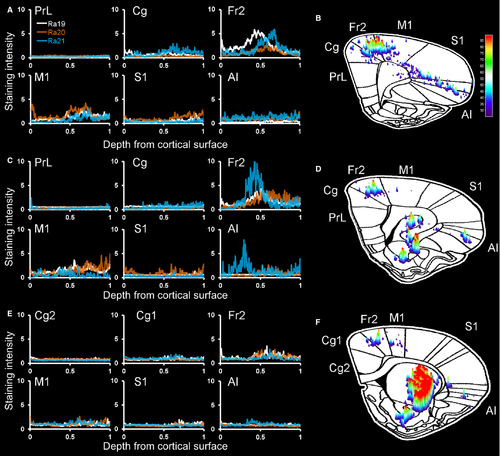
To quantify the cortical projections, we inverted the grayscale images and measured the staining intensity of projections within cortical subregions in three representative coronal sections (Fig. 3). At a level anterior to the striatum (Fig. 3A and B), projections – including fibers and terminals – were heaviest in Fr2, followed by lighter staining in the adjacent primary motor cortex (M1) and cingulate cortex, some staining in the anterior insula, and almost no projections in the prelimbic or sensory cortices. At the anterior tip of the striatum (Fig. 3C and D), the heaviest staining was seen in Fr2, with staining also being seen in the adjacent M1 and anterior insula. Little or no staining was observed in the prelimbic, cingulate and sensory cortices. In the rostral striatum (Fig. 3E and F), staining was heaviest in Fr2, with some projections in M1 and the anterior insula, and little staining elsewhere. In general, heavier projections were seen in more anterior sections, and no cortical projections were seen caudal to the injection site.
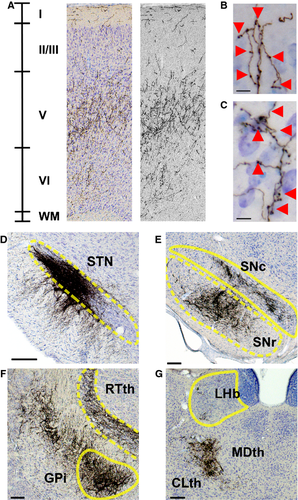
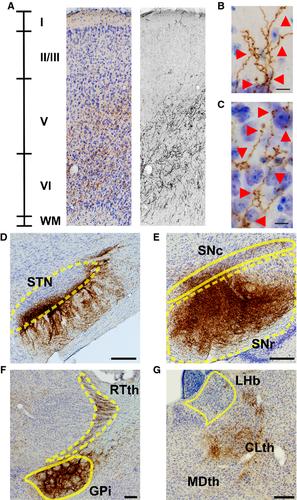
Projections in Fr2 were densest in deep projection layer V of the cortex (Figs 3A, C and E and 4D), although terminal boutons were observed from the level of the injection site to the rostral extent of the cortex (see insets, Fig. 1A–F) in both superficial (Fig. 4B) and deep (Fig. 4C) layers. Dense GPe projections were observed in the STN, entopedunclear nucleus/GPi, SNr, and substantia nigra pars compacta (Fig. 4D–F), and in the striatum (Fig. 1A–C), consistent with previous reports of GPe projections (Kita, 2007). Bilateral projections, with ipsilateral predominance, were also observed in the reticular, mediodorsal, parafascicular and centrolateral nuclei of the thalamus (Fig. 4G).
Striatal projections to pallidocortical neurons
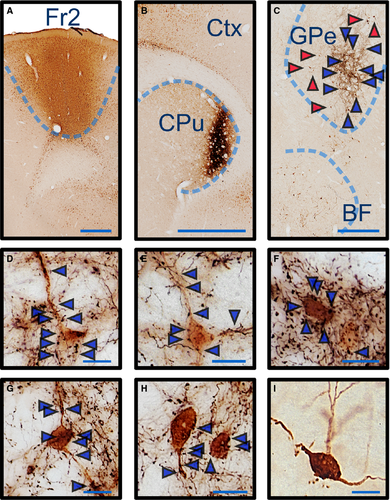
Neurons in the BF located ventral to the GPe have glutamatergic, GABAergic and cholinergic projections throughout the cortex (Saper, 1984; Gritti et al., 1997; Henny & Jones, 2008), but these neurons do not receive striatal input. To differentiate GPe projections to the cortex from BF projections in the cortex, we injected a retrograde fluorogold tracer (stained brown) into Fr2 in six rats (Fig. 5A), along with, in two rats, an anterograde biotinylated dextran amine tracer (stained black) into the rostral dorsal striatum (Fig. 5B), which projects to the GPe but not to the BF. Consistent with ChR2 tracing of the pallidocortical pathway, we observed retrogradely labeled neurons throughout the GPe (see representative trace in Fig. 5C) in all six rats, as well as neurons in the BF. In rats with anterograde tracing, neurons in the GPe also received projections from striatal neurons (Fig. 5D–H). Extended focus microscopy revealed striatal terminal boutons on cell bodies and dendrites of the GPe neurons that were retrogradely labeled from Fr2. Conversely, BF neurons ventral to the GPe did not receive any projections from the striatum (Fig. 5I).
Mouse GABA GPe projections
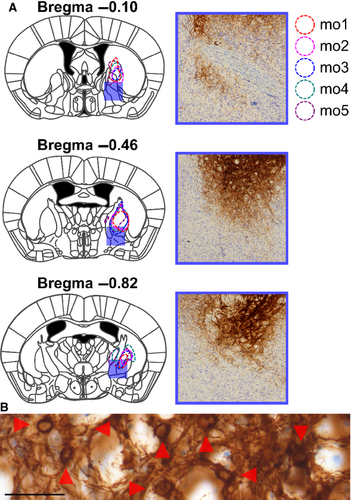
GPe neurons are mostly GABAergic, but non-GABAergic neurons, especially cholinergic GPe neurons, are thought to project to the cortex (Walker et al., 1989; Moriizumi & Hattori, 1992). To differentiate the GABAergic GPe projections observed in the rats from cholinergic projections of the GPe (Saper, 1984), we injected cre-dependent EF1a–DIO–hChR2 (H134R)–eYFP–AAV10 into the GPe Vgat-ires-cre mice (Fig. 6A and B).
Consistent with rat pallidocortical projections, we observed, in all injected mice, GABAergic GPe fiber projections to Fr2, beginning near the rostrocaudal level of the GPe (see representative trace in Fig. 7A) and becoming heaviest at the level of the most rostral aspect of the striatum (Fig. 7B–D). Projections were also observed at the most rostral aspect of the forebrain, becoming sparser along the ventral medial wall (Fig. 7E and F). Notably, GABAergic BF neurons at this level project to the infralimbic (Henny & Jones, 2008) and somatosensory cortices (Gritti et al., 1997); we did not observe similar innervation of the infralimbic or somatosensory cortices by GABAergic GPe neurons.
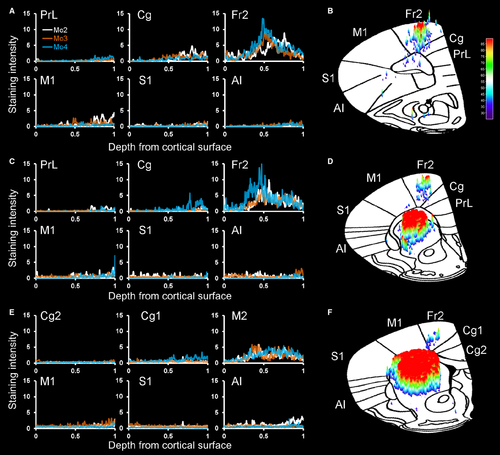
To quantify these GABAergic projections, we measured the staining intensity of projections – fibers and terminals – within cortical subregions in three representative coronal sections (Fig. 8). At a level anterior to the striatum (Fig. 8A and B), projections were heaviest in Fr2, followed by lighter staining in the cingulate cortex and M1, with few projections in the anterior insula or prelimbic and sensory cortices. At the anterior tip of the striatum (Fig. 8C and D), the heaviest staining was seen in Fr2, with staining also being seen in the adjacent M1 and cingulate cortex, and lighter or no staining in prelimbic, cingulate or sensory cortices. In the rostral striatum (Fig. 8E and F), staining was heaviest in Fr2, with some projections in M1, the cingulate cortex, and the anterior insula, and little staining elsewhere. In Fr2 and adjacent subregions, the most intense staining was seen in deeper, projection layers of the cortex, and, as in rats, heavier projections were seen in more anterior sections. No cortical projections were seen caudal to the injection site. As in rats, GPe fibers and boutons in Fr2 were heaviest in layers V and VI, although fibers and terminals were seen throughout all layers of the cortex (Fig. 9A–C). Also as in rats, GPe injections of DIO–hChR2–eEYP revealed fibers and terminals in the STN, EPN/GPi, SNr, and striatum, as well as in the mediodorsal, centrolateral, parafascicular and reticular thalamus (Fig. 9D–G).
In vitro optogenetic characterisation of pallidocortical projections
To confirm the presence of GABAergic pallidocortical projections, and to characterise the functional targets of these projections, we injected EF1a–DIO–hChR2 (H134R)–eYFP–AAV10 into the GPe of five Vgat-ires-cre-GFP mice. We recorded from GABAergic/GFP-expressing neurons and pyramidal neurons of layers V/VI of Fr2 (Fig. 10A), as these deep layers receive the strongest pallidocortical projections (Figs 3 and 8). Under IR visualisation, GABAergic/GFP-expressing neurons had a round soma quite distinctive from the neighboring pyramidal cells (Fig. 10B), were silent at resting membrane potential (−53.93 ± 2.6 mV), and had an input resistance of 208.18 ± 28.65 MΩ (n = 10). These neurons responded to depolarising current steps with fast and high-frequency firing (Fig. 10C). They also showed a narrow action potential (width, 0.61 ± 0.04 ms) followed by a large after hyperpolarisation (−19.53 ± 2.13 mV; n = 10). They responded to hyperpolarising pulses with a small, voltage-dependent rectification and a small depolarising sag, suggesting the presence of an inwardly rectifying IK and an Ih.
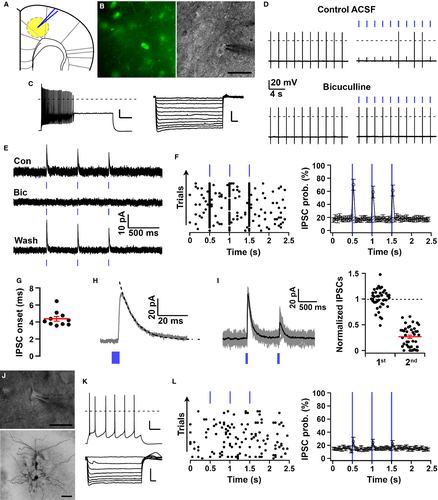
Photostimulation of axons and terminals that originated from GPeVgat neurons evoked release of GABA, which inhibits the firing of GFP-positive Fr2 neurons. This effect was blocked by bicuculline (10 μm; Fig. 10D), indicating that these responses were mediated by activation of GABAA postsynaptic receptors. In voltage-clamp recordings, photostimulation of GPeVgat axons/terminals evoked fast IPSCs in GFP-positive Fr2 neurons (n = 10 of 17 neurons; Fig. 10E–I) that were completely abolished by bicuculline. The peak amplitude of the photoevoked IPSCs was 34.57 ± 11.3 pA, and IPSC rise and decay could be fitted with single exponentials (rise time constant, 1.9 ± 0.3 ms; decay time constant, 13.57 ± 1.98 ms) (Fig. 10H). Paired pulse tests (80-ms inter-pulse intervals) showed robust paired pulse depression (76%; n = 2), suggesting high release probability of GPeVgat→Fr2GFP+ input (Fig. 10I). In addition, the onset delay of the photo-evoked IPSCs was short (4.38 ± 0.28 ms; Fig. 10G), supporting direct synaptic connectivity from GPe to Fr2 GABAergic interneurons.
We also recorded from 19 pyramidal cells in the same layers of the Fr2 cortex. These neurons were identified on the basis of their shape and their firing properties (Fig. 10J and K). Photostimulation of GPeVgat axons and terminals evoked IPSCs in three of 19 pyramidal neurons (Fig. 10L). The peak amplitude of the photo-evoked IPSCs in these three pyramidal cells was 15.4 ± 6.2 pA, and, importantly, the onset delay of the photo-evoked IPSCs was short (5.19 ± 0.62 ms), supporting direct synaptic connectivity from GPe to Fr2 pyramidal cells.
Overall, optogenetic activation of GPeVgat projections evoked inhibitory synaptic responses in a greater proportion of Fr2 GABAergic neurons (58.8%) than Fr2 pyramidal neurons (15.8%; Fisher's exact test, P = 0.01). These results indicate that functional GPeVgat projections target Fr2 neurons, primarily GABAergic interneurons and some pyramidal cells.
Discussion
Using a ChR2-based tracer in rats, we found ipsilateral projections from the GPe to all cortical layers, especially to the pyramidal cell-containing layer V, of Fr2, also known as the secondary motor cortex or M2. We confirmed that these are GPe neurons by retrogradely labeling from Fr2 in combination with anterograde labeling from the CPu, revealing cortically projecting GPe neurons innervated by the CPu. We then showed, by using Vgat-ires-cre mice, that these GPe projections to the cortex are GABAergic. Finally, we confirmed by using in vitro optogenetic stimulation that these GABAergic pallidocortical projections can target neurons in the cortex and produce a rapid, inhibitory synaptic response that inhibits action potential firing. Taken together, these findings suggest that the GPe and, by extension the basal ganglia, project directly to the cortex. Although previous studies have retrogradely labeled neurons in the GPe from the cortex (Van Der Kooy & Kolb, 1985), it was unclear whether these projections originated from GPe neurons rather than BF neurons, whether these projections targeted a specific cortical region, and whether stimulation of this projection directly affected cortical neurons. The present study is the first to show that the cortically projecting GPe neurons receive striatal projections, and thus form part of a basal ganglia system that projects directly to the prefrontal cortex, especially the deep layers of Fr2. Furthermore, the present study is the first to characterise a functional, inhibitory role of GABAergic pallidocortical projections on cortical neurons. This pallidocortical projection is a unique pathway for basal ganglia–cortical interaction.
Pallidocortical projections allow GABAergic neurons of the GPe, which receive projections from all basal ganglia input and output nuclei, to directly influence cortical activity. Quantification of staining intensity confirmed that the heaviest projection density is in Fr2, with some additional projections in the adjacent cingulate and motor cortices – two regions immediately adjoining Fr2 – as well as the anterior insula. The projection field is wider in the most rostral parts of the prefrontal cortex, where the precise delineation of Fr2 and other regions is unclear (Uylings et al., 2003). In contrast, the GPe does not send heavy projections to orbital, infralimbic, prelimbic or sensory regions, and nor do projections target motor or premotor regions caudal to the injection site, although the caudal GPe may have additional cortical targets. Just as CPu anterograde tracing targeted a specific region of the GPe, cortically projecting GPe neurons target Fr2 in the rostral cortex and striatum in a topographic manner. GPe projections to the cortex, basal ganglia and thalamus (Gandia et al., 1993) enable the GPe to influence multiple circuits throughout the brain.
Fr2 has been compared with the frontal cortex of primates, although there is debate concerning the precise mapping of homologous primate and rodent frontal regions (Preuss, 1995; Uylings et al., 2003; Wise, 2008). The Fr2 region has been specifically implicated in a range of functions, particularly those shaping the selection and initiation of action (Grillner et al., 2005; Sul et al., 2011). Much as the GPe is a hub of basal ganglia activity, Fr2 receives input from somatosensory and other cortical regions (Condé et al., 1995) while projecting to the motor cortex. Through the pallidocortical pathway, the GPe is probably able to play a direct role in behavior, such as modulation of Fr2 activity to adapt to reward contingencies (Kargo et al., 2007). Because GPe projections to other cortical regions are so limited, we hypothesise that the pallidocortical pathway is a specialised circuit for the regulation of premotor and motor activity. In contrast, other cortically projecting systems, such as the BF, project widely throughout the cortex and modulate global patterns of cortical activity. The pallidocortical pathway bridges two regions that, in turn, integrate inputs and outputs from the basal ganglia and cortex, respectively. This direct shortcut from the basal ganglia to the cortex may play a specialised role alongside basal ganglia–thalamic–cortical loops.
Our in vitro experiments indicate that the pallidocortical pathway preferentially targets GABAergic neurons in Fr2, presumably interneurons. These putative interneurons had firing properties resembling those of fast-spiking GABAergic/parvalbumin-positive cortical interneurons (Cauli et al., 1997) which account for almost 50% of neocortical GABAergic cells in layers V and VI (Rudy et al., 2011). We also found that the GPe projects to pyramidal cells, although the proportion of responding pyramidal neurons is less than that of GABAergic neurons. Also, although we focused on deep layer projections, pallidocortical projections to superficial layers may also contribute to GPe modulation of cortical activity. GPe neurons may help set cortical firing rates via direct input to cortical interneurons as well as indirect input to pyramidal cells or via the indirect basal ganglia pathway. Future work must delineate the molecular and physiological properties of the origins and targets of pallidocortical neuron projections, both within the known organisation of GPe neurons (Nóbrega-Pereira et al., 2010; Mallet et al., 2012; Mastro et al., 2014) and within the cortical architecture.
Cholinergic and GABAergic BF neurons project widely throughout the cortex, sharing many developmental, anatomical and functional characteristics with the GPe. Retrograde tracing studies from Fr2 show projections originating not only from BF populations but also from within the GPe itself (Zaborszky et al., 2013). Unlike output from BF neurons, which project diffusely across the cortex, output from the GABAergic pallidocortical pathway is concentrated on Fr2 and avoids other BF targets, including the amygdala and lateral hypothalamus. Although our retrograde tracing from Fr2 reveals BF innervation of the cortex, these neurons – which are located ventrally to the GPe – did not receive projections from the CPu. The BF and GPe both contain GABA neurons that project to the cortex, and appear to form a continuous population, based on retrograde tracing alone, especially at caudal levels, but only GPe neurons receive striatal input as part of the basal ganglia system. Delineating the similarities and differences between GPe and BF physiology and anatomy will be critical to understanding how the basal ganglia and BF interact with the cortex. For example, although our in vitro experiments clearly indicate that the pallidocortical pathway has a GABAergic, inhibitory phenotype, the cholinergic neurons within the GPe may also contribute a cortical projection, although these neurons are sparse within the GPe at the rostral levels that we examined (Walker et al., 1989; Moriizumi & Hattori, 1992). It is unclear whether these cholinergic neurons within the GPe or in the borders of the GPe receive CPu inputs.
In summary, we describe a GABAergic pallidocortical output pathway that directly links the basal ganglia and cortex. The rapid and inhibitory response produced by in vitro stimulation of pallidocortical terminals supports a role for the GPe in shaping Fr2 firing patterns. Direct inhibitory GABAergic projections from the GPe to the projecting layers of the Fr2 cortex may disinhibit premotor regions to influence motor planning and execution (Kargo et al., 2007) or provide a direct route for the propagation of deleterious basal ganglia oscillations to the cortex, such as the abnormal oscillations in GPe–STN circuits present in Parkinson's disease (Mallet et al., 2008; Obeso et al., 2008). The identification of this pallidocortical circuit may provide a structural basis for understanding the pathological motor features of basal ganglia disorders, and suggests an important role for GPe–cortical dialogue in motor control.
Acknowledgements
The authors thank Quan Ha and Xi Chen for technical expertise. This work was supported by the Hilda and Preston Davis Foundation (M. C. Chen) and National Institutes of Health (NS061863, NS082854 and HL095491 to E. Arrigoni; NS073613 to P. M. Fuller; NS062727 and NS061841 to J. Lu). The authors report no conflict of interest.
Abbreviations
-
- AAV
-
- adeno-associated viral vector
-
- BF
-
- basal forebrain
-
- ChR2
-
- channelrhodopsin-2
-
- CPu
-
- caudate putamen
-
- DIO
-
- double-floxed inverse ORF
-
- EF1a
-
- elongation factor-1 alpha
-
- eYFP
-
- enhanced yellow fluorescent protein
-
- Fr2
-
- frontal area 2
-
- GFP
-
- green fluorescent protein
-
- GPe
-
- globus pallidus externa
-
- GPi
-
- globus pallidus interna
-
- hChR2
-
- humanised channelrhodopsin-2
-
- IPSC
-
- inhibitory postsynaptic current
-
- IR
-
- infrared
-
- M1
-
- primary motor cortex
-
- SEM
-
- standard error of the mean
-
- SNr
-
- substantia nigra reticulata
-
- STN
-
- subthalamic nucleus
-
- YFP
-
- yellow fluorescent protein


