Type 2 wide-field amacrine cells in TH::GFP mice show a homogenous synapse distribution and contact small ganglion cells
Abstract
In vertebrate retinas, wide-field amacrine cells represent a diverse class of interneurons, important for the extraction of selective features, like motion or objects, from the visual scene. Most types of wide-field amacrine cells lack dedicated output processes, whereas some types spatially segregate outputs from inputs. In the tyrosine hydroxylase (TH)::green fluorescent protein (GFP) mouse line, two types of GFP-expressing wide-field amacrine cells have been described: dopaminergic type 1 and γ-aminobutyric acid-ergic type 2 cells (TH2). TH2 cells possess short and long radial processes stratifying in the middle of the inner plexiform layer, where they collect excitatory and inhibitory inputs from bipolar cells and other amacrine cells, respectively. Although it was shown that these inputs lead to ON–OFF light responses, their spatial distribution along TH2 cell processes is unknown. Also, the postsynaptic targets of TH2 cells have not been identified so far. Here, we analysed the synapse distribution of these cells in TH::GFP mice and show that they form a weakly coupled network. Electrical synapses (made of connexin36) and chemical (excitatory and inhibitory) synapses are uniformly distributed along TH2 dendrites, independent of dendrite length or distance from soma. Moreover, we reveal that TH2 cells contact at least two types of small ganglion cells; one of them is the W3 cell, a ganglion cell sensitive to object motion. Contacts were often associated with markers of inhibitory synapses. Thus, TH2 wide-field amacrine cells likely provide postsynaptic inhibition to W3 ganglion cells and may contribute to object-motion detection in the mouse retina.
Introduction
In the vertebrate retina, amacrine cells underlie the spatial and temporal processing of visual information in the inner plexiform layer (IPL). They receive inputs from bipolar cells and provide signals to bipolar, amacrine and/or ganglion cells, thus contributing to the extraction of features, such as edges and motion, from the visual scene (Zhang et al., 2012).
For the mouse retina, > 30 amacrine cell types have been described (Masland, 2012), which differ in dendritic field size, stratification pattern and physiology. Due to their diversity, the connectivity and function of many amacrine cells are still unknown. In particular, wide-field amacrine cells with dendrites longer than 500 μm (Kolb et al., 1981) are hard to study because of their low density. So far, their extensive dendrites are difficult to capture by serial electron microscopy, a technique that recently detailed the connections of smaller retinal neurons (Anderson et al., 2011; Briggman et al., 2011; Helmstaedter et al., 2013; Lauritzen et al., 2013). However, transgenic mice expressing fluorescent reporters under cell-specific promoters provide useful tools for studying the connectivity of wide-field amacrine cells (Zhang et al., 2007; Knop et al., 2011, 2014; Pottek et al., 2011). One example is the tyrosine hydroxylase (TH)::green fluorescent protein (GFP) line in which GFP is expressed under the TH promoter (Matsushita et al., 2002). In the retina of these mice, GFP expression is restricted to two types of wide-field amacrine cells: dopaminergic type 1 and γ-aminobutyric acid (GABA)ergic type 2 cells (Knop et al., 2011, 2014). Here, we used the TH::GFP line to analyse type 2 cells (in the following referred to as TH2 cells).
TH2 cells resemble catecholaminergic amacrine cells described in other species (Park et al., 1986; Mariani, 1991; Oh et al., 1999). However, in mice, TH2 cells were shown to be GABAergic (Zhang et al., 2004; Knop et al., 2011), not catecholaminergic, and immuno-negative for TH (Contini & Raviola, 2003; Zhang et al., 2004; Knop et al., 2011). They contribute to the second calretinin-positive band in the middle of the IPL. While it was shown that TH2 cells are ON–OFF cells and receive inputs from ON and OFF bipolar cells and other amacrine cells (Knop et al., 2011), the postsynaptic targets of TH2 cells have not yet been identified.
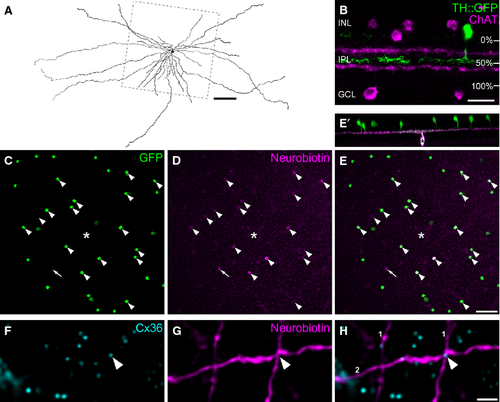
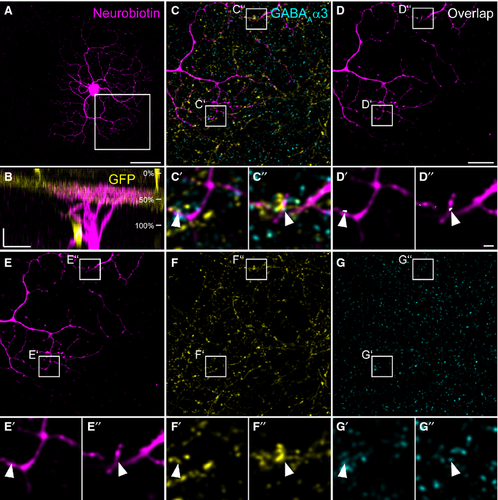
Also, the synaptic organization of TH2 cells is unknown. Most amacrine cell types are axonless and collect inputs and provide outputs within the same process, mediating, for example, signals for local gain control (Grimes et al., 2010). In contrast, polyaxonal amacrine cells receive inputs via short dendrites and deliver spikes via long axonal processes (Famiglietti, 1992; Völgyi et al., 2001; Greschner et al., 2014), thus mediating long-range inhibitions. As TH2 cells also possess short and long processes (Fig. 1A; Zhang et al., 2007; Pottek et al., 2011), we aimed to analyse the distribution of their in- and outputs to test for spatial segregation. Also, we aimed to identify ganglion cells postsynaptic to TH2 cells to shed light on the function of these wide-field amacrine cells in the mouse retina.
Materials and methods
Unless stated otherwise, all chemicals were purchased from Roth (Karlsruhe, Germany).
Animals and tissue preparation
A transgenic mouse line was used (TH::GFP mice), which expressed GFP under control of the TH promoter on a C57BL/6 genetic background (Matsushita et al., 2002). Mice were housed on a 12/12 h light/dark cycle with food and water ad libitum. All procedures were approved by the local animal care committee and were in compliance with the guidelines for the welfare of experimental animals issued by the European Communities Council Directive of 24 November 1986 (86⁄609⁄EEC) and the laws of the Federal Government of Germany (Tierschutzgesetz; BGBl. I S. 1206, 1313 and BGBl. I S. 1934).
Mice (aged 2–10 months) were deeply anaesthetized with CO2 and killed by cervical dislocation. Eyes were enucleated and dissected in HEPES-buffered saline (in mm: NaCl, 137; KCl, 5.4; CaCl2, 1.8; MgCl2, 1; glucose, 10; HEPES, 5; pH 7.4) for immunohistochemistry or, for intracellular dye/tracer injections, either carboxygenated extracellular solution (in mm: NaCl, 110; KCl, 2.5; CaCl2, 1; MgCl2, 1.6; NaHCO3, 22; d-glucose, 10; pH 7.4, equilibrated with 95% O2/5% CO2) or AMES medium (Sigma, Munich, Germany; pH 7.4, equilibrated with 95% O2/5% CO2). Eyes were opened, and cornea, lens and vitreous body were removed.
Intracellular dye/tracer injections
Dye/tracer injections were performed as described earlier (Meyer et al., 2014). Briefly, retinas were dissected from the eyecup and cut into halves, which were kept dark in a Petri dish with carboxygenated extracellular solution. For coupling experiments, dissections were performed under dim red light in AMES medium. Retina pieces were mounted ganglion cell side up on black filter paper (Millipore, Billerica, MA, USA). For ganglion cell injections, retinas were labelled with 0.01% acridine orange (Sigma) in extracellular solution for about 10 s. Ganglion cells and GFP-expressing TH2 cells (2–3 cells/piece of retina) were injected under visual control with borosilicate glass electrodes (100–120 MΩ; Hilgenberg, Malsfeld, Germany) pulled with a P-97 electrode puller (Sutter Instrument, Navato, CA, USA). Electrodes were filled at the tips with 4% neurobiotin (Vector Laboratories, Burlingame, CA, USA) and either 3.75 mm Alexa Fluor 594 potassium hydrazide (Life Technologies, Karlsruhe, Germany) or 3 mm Alexa Fluor 555 potassium hydrazide (Life Technologies), diluted in 0.1 m TRIS buffer (pH 7.4), and then backfilled with 0.2 m KCl. Dyes/tracers were iontophoretically driven into the impaled cell for 3–18 min using square pulses of 0.5 nA and 500 ms at 1 Hz, and were allowed to diffuse for another 30–45 min before the retina was fixed.
Immunohistochemistry
Immunostaining of retinal cryosections was performed as described (Sonntag et al., 2012). Briefly, eyecups were fixed with 2% paraformaldehyde in 0.1 m phosphate buffer (PB; pH 7.4) for 20 min and, after washing, incubated in 30% sucrose in PB at 4 °C overnight. Vertical cryosections (20 μm) were rinsed in PB for 10 min and in TRIS-buffered saline (TBS) with 0.3% TritonX-100 (TBS-T, pH 7.6) for 2 × 10 min. Sections were blocked with 5% donkey serum and 1% bovine serum albumin in TBS containing 0.02% NaN3, 0.5% TritonX-100 for 1 h at room temperature. The intense GFP signal in transgenic retinas did not need to be enhanced by antibodies. For immunostaining, antibodies were diluted in blocking solution, and primary antibodies (Table 1) were applied overnight at 4 °C. Sections were washed in TBS-T and incubated with secondary antibodies conjugated to Alexa Fluor 488, Alexa Fluor 568 or Alexa Fluor 647 (Life Technologies; 1 : 500) for 2 h. For controls, the primary antibody was omitted; occasional unspecific labelling of blood vessels was observed for secondary anti-mouse antibodies. After several washing steps in TBS-T, sections were mounted with Vectashield (Vector Laboratories).
| Antibody | Antigen/immunogen | Source | Cat. no. | Dilution, species | Reference |
|---|---|---|---|---|---|
| CtBP2 | Peptide (aa 361–445) of mouse CtBP2 | BD Biosciences, Heidelberg, Germany | 612044 | 1 : 10 000, mouse, monoclonal | Bayley & Morgans, (2007) |
| ChAT | Human placental choline acetyltransferase | Millipore | AB144P | 1 : 250, goat, polyclonal | Powers-Martin et al., (2006) |
| Cx36 | Connexin36 C-terminal region of rat and mouse Cx36 (aa 286–303) | Life Technologies | 37-4600 | 1 : 500, mouse, monoclonal | Li et al., (2004) |
| GABAA α3 | Peptide (aa 1–15 of human GABAA receptor alpha 3 protein) | Sigma | G4291 | 1 : 300, rabbit, polyclonal | Gao et al., (1993) |
| GABAA ρ | N-terminal region (aa 16–171) of the rat GABAA rho 1 subunit | Kindly provided by Ralf Enz, University of Erlangen-Nuremberg, Germany | – | 1 : 200 or 1 : 500, guinea pig, polyclonal | Enz et al., (1996) |
| Gephyrin | N-terminus of gephyrin, surrounding phospho-serines 268 and 270 | Synaptic Systems | 147021 | 1 : 500, mouse, monoclonal | Pfeiffer et al., (1984) |
| NL-2 | Synthetic peptide (aa 732–749 of rat neuroligin 2) | Synaptic Systems | 129203 | 1 : 250, rabbit, polyclonal | Briatore et al., (2010) |
- aa, amino acid.
Immunostaining of retinal whole-mounts was performed in a similar way with some adjustments. Briefly, after intracellular dye injections, retinas were fixed in 2 or 4% paraformaldehyde for 10 min, rinsed in PB for at least 30 min, and blocked with 5 or 10% donkey serum or normal goat serum at 4 °C overnight. For some stainings, 1% bovine serum albumin was added. Neurobiotin was visualized by adding DyLight 549 streptavidin (Vector Laboratories), diluted 1 : 500. Primary antibodies (Table 1) were applied in 1% serum, 0.3 or 0.5% TritonX-100 and 0.02 or 0.05% NaN3 for 6–7 days at 4 °C and secondary antibodies were applied for 1–2 days.
Image acquisition, image analysis and statistics
Retinas were analysed using confocal laser-scanning microscopy (Leica TCS SP5). Images were acquired with a 40 × immersion objective (HCX PL APO 40.0 × OIL UV, NA = 1.3) using a white light laser. A voxel size of 63 × 63 × 170 nm was used for high-resolution scans of injected cells and synaptic markers. Confocal stacks were deconvolved with theoretical point spread functions using Huygens Essential deconvolution software (SVI, Hilversum, Netherlands), normalized using the respective stack histograms, and processed afterwards with imagej (http://imagej.nih.gov/ij/; NIH, Bethesda, MD, USA) or Fiji (http://fiji.sc/Fiji; Schindelin et al., 2012). Unless stated otherwise, maximum projections of collapsed confocal stacks are shown, adjusted for brightness and contrast for presentation purposes.
Because TH2 cells are so large, tracer coupling of injected TH2 cells was only evaluated in a central square region of 0.15 mm² around the soma, as indicated by the box in Fig. 1A.
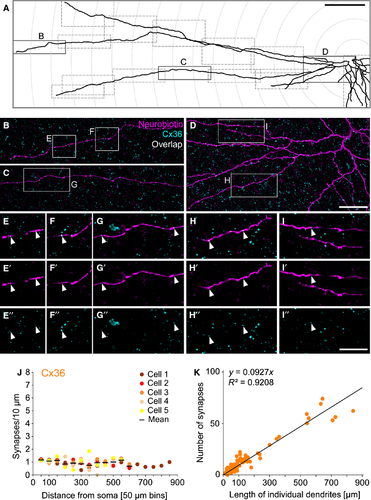
For the quantification of synaptic in- and outputs of TH2 cells, injected cells were scanned in partial mosaics comprising the soma and several long and short dendrites, as indicated in Fig. 2A. Synapses were defined as signal overlap of the synaptic immunolabels with the dendrites of the injected cell. Areas of signal overlap were identified using the ‘colocalization highlighter’ plugin in Fiji. This plugin generates binary images, indicating regions where both channels display values of a certain intensity ratio and above a certain threshold. Note that due to the resolution limits of confocal microscopy, this overlap may include both pre- and postsynapses (Contini et al., 2010).
For the dendrites of injected TH2 cells, several automatic thresholds were tested using stack histograms. All results were compared, and a threshold was chosen that resulted in the narrowest dendrites without fragmenting them too strongly. Typically, one of ‘MaxEntropy’, ‘Isodata’, ‘Moments’ or ‘Otsu’ produced the best results.
For punctate immunolabels, a different approach was used as with a global threshold either most of the smaller and/or darker puncta disappear or the larger ones outshine the others. Thus, punctate immunolabels were thresholded to the local half maximum using the automatic local threshold ‘midgrey’ in Fiji with the default settings. The resulting binary stack was then used as a mask by reversing and subtracting it from its original, resulting in a locally thresholded image that preserved the above-threshold signal intensities.
For the ‘colocalization highlighter’ plugin, a threshold of 1 was then used for the masked punctate labelling, the determined threshold for the dendrites, and an intensity ratio of 10% to account for the (occasionally) huge intensity differences between injected dendrites and antibody label. Finally, highlighted clusters were only counted as synapses if they comprised at least 10 connected voxels. The above procedure was tested in several stacks and verified by checking the intensity profiles of the two non-thresholded channels in line selections passing through the centres of highlighted clusters. In all cases observed, the overlap of the two profiles comprised values above 50% of the local intensity maximum.
Projections of the stacks (which now included the highlighted clusters) were stitched using the ‘pairwise stitching’ plugin (Preibisch et al., 2009). Dendrites were traced using the ‘NeuronJ’ plugin (Meijering et al., 2004) and two parameters were determined: (1) the total length of individual dendrites (tips and inner branches between nodes); and (2) the overall length of all imaged dendrites within concentric segments (= rings) of 50-μm radius increments (see Fig. 2A). Highlighted clusters were counted for each individual dendrite and again for each circle segment.
The distribution of puncta among the concentric segments, which contained data points from all injected cells, was statistically tested with a parametric one-way anova (parametric repeated-measurements one-way anova with Geisser–Greenhouse correction) and a post-test for linear trend in prism 5 (GraphPad Software, La Jolla, CA, USA). Linear fits and their respective R² values were determined in Excel (Microsoft, Seattle, WA, USA). Please note that values given for one cell were obtained from a divergent number of dendrites or differing lengths of dendrites. Therefore, all values on synaptic densities are given as weighted mean ± standard error of the weighted mean with respect to the dendritic length.
For injected ganglion cells, three-channel analysis was carried out sequentially. Channels of synaptic markers were filtered using the ‘sigma filter plus’, and automatic global thresholds were determined for each channel (injected cell: ‘Li’; TH2 cells and marker: ‘Otsu’). The signal overlap was first detected for ganglion and TH2 cells, and afterwards for ganglion cells and synaptic markers using the ‘colocalization highlighter’ plugin with the determined thresholds. Overlap of the two obtained binary files was then projected back onto the injected ganglion cell.
Classification of ganglion cells
To classify injected ganglion cells following Völgyi et al. (2009), we evaluated two main parameters: (1) the level of stratification in the IPL; and (2) the extent of the dendritic field. Stratification level was calculated in reference to TH2 cell dendrites, which contribute to the second calretinin-positive band in the IPL (Knop et al., 2011), i.e. at 49 + 1% depth (n = 12 retinal areas from three different mice), with the inner nuclear layer (INL) and ganglion cell layer (GCL) representing 0% and 100%, respectively (Fig. 1B). Dendritic field size was estimated by calculating the area of the convex polygon connecting the terminal tips of the dendrites. Dendritic field diameter was calculated from this area assuming it to be a circle. All values are given as mean ± standard error of the mean.
Results
In the TH::GFP mouse retina, dopaminergic type 1 cells, stratifying in the distal IPL, are moderately labelled by GFP. In contrast, GABAergic type 2 cells (TH2), stratifying in the middle of the IPL, are brightly GFP-labelled. The large majority of TH2 cell somata occur in the INL, but occasionally somata are also displaced to the GCL. The two subpopulations of TH2 cells were shown to have very similar light responses and the same marker signature (Knop et al., 2011).
Coupling and spatial distribution of electrical synapses
To study the synapse distribution of TH2 cells in the TH::GFP mouse retina, we first tested for electrical synapses (gap junctions) and used the gap junction-permeable tracer neurobiotin to inject displaced TH2 cells (Fig. 1A and C–E). Tracer injection revealed the wide-field morphology of the cells with radial, sparsely branched short and long dendrites, stratifying in the middle of the IPL (Fig. 1 A, B and E′). Neurobiotin spread from the injected cell into several brightly GFP-labelled neighbouring cells, which also represent TH2 cells (Fig. 1C–E, arrowheads). Tracer coupling was detected for all of the 23 injected TH2 cells with a mean of 5.6 ± 0.9 coupled cells (range 1–21). This comprised 15 ± 2% of the TH2 cells present in the square region around the soma. Based on the intensity of the neurobiotin signal, coupling among TH2 cells was rather weak, compared with the coupling we found in other wide-field amacrine cells (Knop et al., 2014). Coupled cells were hardly visible under the microscope and, in confocal micrographs, they could only be discriminated from background after contrast adjustments. This may be the reason why coupling was not detected in earlier studies (Zhang et al., 2004; Knop et al., 2011). A few coupled somata were found that did not express GFP (Fig. 1C–E, arrow; 3% of all coupled cells). Thus, TH2 cells form a homologously coupled network. As the gap junction protein connexin36 (Cx36) is the most abundant connexin in the IPL, we tested for Cx36 expression in TH2 cells. As expected for homologous coupling, we found Cx36 to be present at the intersection of dendrites from two different TH2 cells that were both injected with neurobiotin (Fig. 1F–H, arrowhead).
To determine the density of electrical synapses, the spatial distribution of Cx36 was analysed on individually injected TH2 cells stained for Cx36. Injected cells were traced (Fig. 2A) and Cx36 immunoreactivity was analysed with respect to dendrite length and distance from soma (Fig. 2B–I′′). A mean density of 1 ± 0.03 synapses per 10 μm (n = 93 dendrites) was determined, and plotting the synaptic density against distance from the soma shows that the differences among the concentric segments were not significant (anova, P = 0.4966, n = 5 cells; Fig. 2J) and the slope was not different from 0 (post-test for linear trend, P = 0.0965). Plotting the number of Cx36 puncta against the length of individual dendrites confirmed the homogenous distribution of electrical synapses on long and short dendrites (Fig. 2K) as the puncta distribution linearly increased with dendrite length (R2 for the fit: 0.9208, n = 93 dendrites). Thus, Cx36-containing electrical synapses are uniformly distributed along TH2 cell dendrites.
Spatial distribution of bipolar cell inputs
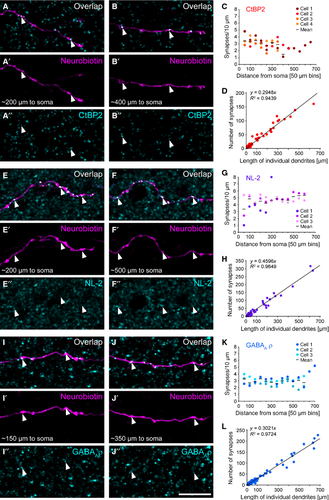
In an earlier report we showed that TH2 cells receive excitatory inputs from bipolar cells (Knop et al., 2011). To analyse the spatial distribution of these inputs, we injected GFP-expressing TH2 cells with neurobiotin to label an individual cell within the TH2 cell network and stained with antibodies against the ribbon protein CtBP2. CtBP2 distribution (Fig. 3A–D) was evaluated as shown for Cx36 (Fig. 2). Similar to electrical synapses, also excitatory inputs were evenly distributed along TH2 cell dendrites. However, the number of excitatory inputs was about three times larger than the number of electrical synapses (3.12 ± 0.13 per 10 μm; n = 41 dendrites). Differences between the distances from the soma were not significant (anova, P = 0.3884, n = 4 cells), resulting in a slope not different from 0 (Fig. 3C; post-test for linear trend, P = 0.1077). Also, the number of CtBP2-positive puncta decorating TH2 cell dendrites linearly increased with the length of individual dendrites (R2 for the fit: 0.9439, n = 41 dendrites; Fig. 3D), confirming that long and short dendrites receive relatively the same amount of excitatory inputs.
Spatial distribution of inhibitory synapses
TH2 cells get GABAergic and glycinergic inhibition, and are presumably postsynaptic to VGluT3-positive amacrine cells (Knop et al., 2011). Most likely, TH2 cells in turn provide inhibitory output to bipolar, amacrine and ganglion cells. To analyse the distribution of inhibitory synapses on TH2 cell dendrites, we used two different markers: neuroligin 2 (NL-2), labelling the postsynaptic site of inhibitory (mainly GABAergic) synapses in the retina (Hoon et al., 2009), and the GABAA receptor subunit ρ (rho, formerly known as GABAC receptor subunit) mainly expressed on bipolar cell terminals (Wässle et al., 1998; McCall et al., 2002) and potentially on ganglion cells (Rotolo & Dacheux, 2003). Similar to electrical and excitatory synapses, also inhibitory synapses showed a homogenous distribution along TH2 cell dendrites. NL-2-positive puncta (Fig. 3E–H) exhibited the highest density with a weighted average of 4.37 ± 0.16 synapses/10 μm (n = 56 dendrites), while GABAA receptor subunit ρ (Fig. 3I–L) showed a similar density (2.95 ± 0.06 synapses/10 μm; n = 115 dendrites) to CtBP2-labelled excitatory synapses (Fig. 3A–D). For both markers, synaptic density was independent of the distance from the soma (anova, NL-2: P = 0.3921, n = 3 cells; ρ subunit: P = 0.4668, n = 3 cells; Fig. 3 G and K) or individual dendrite length, resulting in a linear increase in the number of synaptic sites with increasing dendrite length (NL-2: R2 = 0.9649, n = 56 dendrites; ρ subunit: R2 = 0.9724, n = 115 dendrites) and a slope not different from 0 (post-test for linear trend, NL-2: P = 0.1109; ρ subunit: P = 0.7858; Fig. 3 H and L). Although we cannot strictly separate inhibitory inputs to TH2 cells from inhibitory outputs provided by TH2 cells to bipolar or ganglion cells, this very even distribution of markers suggests that TH2 cells do not show a spatial segregation of in- and outputs (see also 4 below).
In summary, our findings on the distribution of electrical and chemical synapses are thus in line with our earlier report revealing homogenous receptive fields without functional subdivision in TH2 amacrine cells of the TH::GFP mouse line (Knop et al., 2011).
Identification of postsynaptic ganglion cells
While it was shown that TH2 cells receive inputs from bipolar and amacrine cells, their postsynaptic targets are unknown so far. To identify postsynaptic partners, we dye-injected ganglion cells in TH::GFP retinas and subsequently labelled for markers of inhibitory synapses, namely NL-2, GABAA receptor subunits α3 and ρ, and gephyrin, a scaffolding protein in the retina important for the clustering of GABAA and glycine receptors (Fischer et al., 2000). Injected ganglion cells were identified by their dendritic tree size and stratification depth in relation to the stratification of TH2 cells (for details, please see 2). In case injected cells did not resemble a genetically identified ganglion cell type, we used the classification provided by Völgyi et al. (2009), which differentiates mouse ganglion cells into 22 types (G1–G22). We found several ganglion cell types to be contacted by TH2 cells in the TH::GFP retina: W3 (Kim et al., 2010; Figs 4 and 5), G5 (Figs 6 and 7), G4 (Fig. 8) and G14 cells (Fig. 9). As G4 and G14 cells were hard to separate and encountered rarely, we will focus on W3 and G5 cells here.
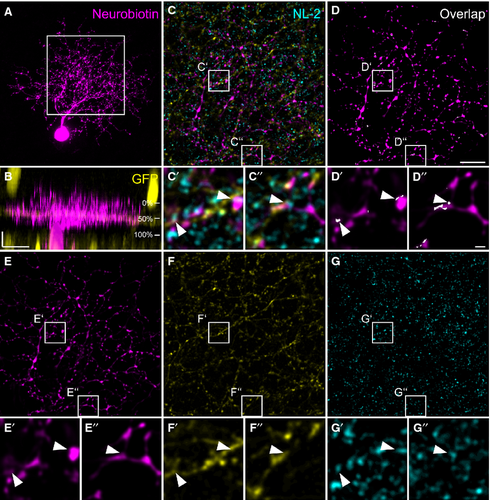
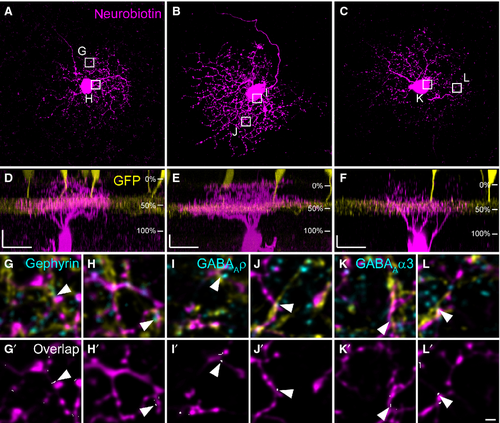
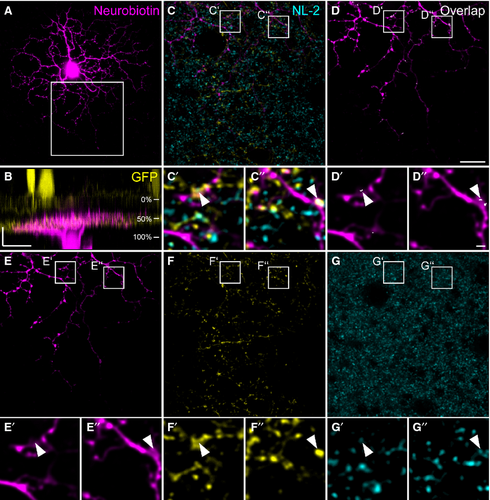
W3 ganglion cells have been genetically identified in TYW3 mice (Kim et al., 2010), and represent ON–OFF ganglion cells. They are sensitive to local motion (Zhang et al., 2012), thereby serving the detection of object motion in the mouse retina. W3 cells are thought to correspond to G8 or G13 cells (Helmstaedter et al., 2013) in the nomenclature provided by Völgyi et al. (2009). Figure 4 shows an example of a dye-injected W3 cell contacted by a TH2 cell. The injected cell exhibits a dense dendritic field (Fig. 4A) covering an area of 5030 μm2 (corresponding to a diameter of 80 μm), which is small compared with other ganglion cells (Völgyi et al., 2009). As was reported before (Kim et al., 2010; Zhang et al., 2012; Helmstaedter et al., 2013), the W3 cell stratifies in the middle of the IPL (31–66%), but also sends some processes into the distal IPL (Fig. 4B). W3 cell dendrites made numerous contacts with GFP-expressing TH2 cells (Fig. 4C–G′′). Contact points were often positive for NL-2 (Fig. 4C–G′′, arrowheads). Other examples of W3 cells are given in Fig. 5A–F. The cells show basically the same characteristics: a dense but small dendritic tree (mean diameter: 93 ± 8 μm for the four cells shown) and stratification right on the TH2 GFP band (28 ± 3% to 64 ± 3%) with additional processes reaching towards the border between IPL and INL. We localized gephyrin (Fig. 5G–H′), and the GABAA receptor subunits ρ (Fig. 5I–J′) and α3 (Fig. 5K–L′) at contact points between TH2 and W3 cells (Fig. 5, arrowheads). These data indicate that TH2 wide-field amacrine cells provide GABAergic inputs to W3 ganglion cells.
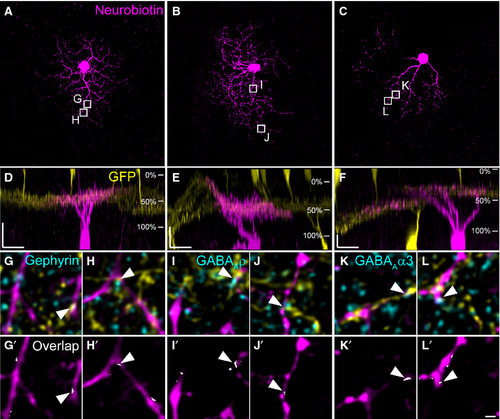
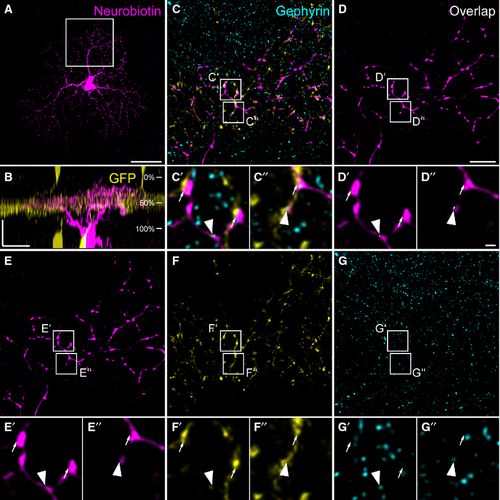
In addition to W3 cells, we also found G5 ganglion cells (Völgyi et al., 2009) to form contacts with TH2 cells in the TH::GFP mouse line (Figs 6 and 7). An example G5 cell is shown in Fig. 6: neurobiotin injection (Fig. 6A) revealed a dense dendritic field with an area of 12 380 μm2 (corresponding to an approximate diameter of 126 μm). G5 cell stratification was confined to a narrow band in the same layer as TH2 cell dendrites (Fig. 6B) where they contacted TH2 cells (Fig. 6C–G′′). Contact sites were often decorated with NL-2 immunoreactivity (Fig. 6, arrowheads). Figure 7A–F shows further examples of G5 cells, again showing a dense dendritic tree (mean diameter: 118 ± 4 μm for the four cells shown) and strict co-stratification with TH2 cell dendrites (46 ± 2%). At contact sites between TH2 amacrine cells and G5 ganglion cells, we localized gephyrin (Fig. 7G–H′), and the GABAA receptor subunits ρ (Fig. 7 I–J′) and α3 (Fig. 7K–L′), suggesting that, in addition to W3 cells, G5 cells receive GABAergic inputs from TH2 cells.
Thus, these data suggest that TH2 wide-field amacrine cells of the TH::GFP mouse retina provide inhibitory inputs to at least two different ON–OFF ganglion cells, which are both characterized by rather small and dense dendritic trees but differ in their stratification pattern and presumably in their function.
Discussion
In the mouse retina, TH2 wide-field amacrine cells were first described in animals expressing the red fluorescent protein (RFP) under the TH promoter (TH::RFP mouse; Zhang et al., 2004). This suggests that TH2 cells are catecholaminergic, but although cells with the same morphology and stratification pattern were labelled for enzymes important in catecholamine synthesis in other species (Park et al., 1986; Versaux-Botteri et al., 1986; Crooks & Kolb, 1992; Oh et al., 1999), this was never shown in mice. However, TH2 cells also appear in a second transgenic mouse line using the same promoter, TH::GFP mice (Contini et al., 2010). Recently, we described the light responses and their underlying inputs of TH2 cells in TH::GFP mice (Knop et al., 2011). Here, we used this line to analyse the spatial distribution of synapses along TH2 cell processes and to identify ganglion cells postsynaptic to TH2 cells.
TH2 cells are coupled by gap junctions containing Cx36
To determine the presence of electrical synapses on TH2 cell dendrites, we first looked for tracer coupling and found TH2 cells to form gap junctions containing Cx36. Tracer coupling was rather weak, which may be the reason why it was missed in earlier studies (Zhang et al., 2004; Knop et al., 2011). Moreover, coupling was mostly homologous, i.e. TH2 cells are coupled among each other, thereby forming a neuronal syncytium. Gap junctional coupling may provide an explanation for why stimulating TH2 cells with a spot centred on the cell body and an annulus of the same area in the periphery yielded light responses of the same size (Knop et al., 2011). Electrical coupling may compensate the expected drop in voltage by the larger field of integration (Freed et al., 1996; Knop et al., 2014).
Only rarely we observed coupled cells in the proximal INL that were not GFP-positive and potentially belong to a different amacrine cell type. These few cells may also represent TH2 cells not expressing GFP, although the even distribution of GFP-labelled TH2 cells (Fig. 1C) suggests that in TH::GFP mice the entire population is GFP-labelled. We never observed coupling to ganglion cell somata.
TH2 cells do not spatially segregate inputs from outputs
In general, signals processed by a neuron are determined by several factors, including active and passive membrane properties, the geometry of the dendritic tree, and the spatial distribution of synapses (Borst & Egelhaaf, 1994). In the vertebrate retina, a segregation of synaptic inputs and outputs has been reported for some of the wide-field amacrine cells. Polyaxonal cells, for example, receive inputs via their short dendrites and deliver outputs in the form of spikes via long axonal processes (Famiglietti, 1992; Völgyi et al., 2001; Greschner et al., 2014). In contrast, dye injections and labelling for markers of electrical, excitatory and inhibitory synapses revealed a homogenous distribution of synapses on TH2 cell dendrites, with no differences with respect to dendrite length or distance from the soma. Cx36-immunoreactive spots, indicating electrical synapses, occurred on average once per 10 μm. Excitatory synapses, revealed by the ribbon marker CtBP2, were also uniformly distributed and showed a three times higher density than Cx36-containing electrical synapses. However, excitatory inputs to TH2 cells originate from both OFF and ON bipolar cells (Knop et al., 2011), and labelling with CtBP2 does not differentiate between these two types. Thus, in principle, it is still possible that, for example, ON inputs are provided to short and OFF inputs are provided to long dendrites. Yet, it seems rather unlikely that in this case the density of excitatory synapses on short and long dendrites would be the same. Moreover, our former electrical recordings did not show a segregation of ON and OFF inputs because a small spot centred on the cell body gave an ON response of the same size as a stimulus presented in the periphery (Knop et al., 2011). Thus, we suggest that TH2 cells receive the same amount of glutamatergic input from OFF and ON bipolar cells over their entire dendritic field.
To map inhibitory synapses, injected TH2 cells were labelled with antibodies against NL-2 and the GABAA receptor subunit ρ. NL-2 represents a postsynaptic adhesion molecule located at GABAergic synapses in the retina and was shown to be necessary for the clustering of GABAA receptors containing the γ2 subunit (Hoon et al., 2009). Because lack of NL-2 does not affect the clustering of GABAA receptors containing the ρ subunit (formerly known as GABAC receptors; Hoon et al., 2009), NL-2 is presumably present at different postsynaptic sites than the ρ subunit. The density of NL-2 puncta on TH2 cell dendrites appeared to be higher (~4.5 sites per 10 μm) than for the other synaptic markers. This may be the case because NL-2-immunoreactive puncta overlapping with TH2 cell processes may represent two different types of postsynaptic sites: (1) GABAergic ‘inputs’ collected from other amacrine cells (Knop et al., 2011); and (2) GABAergic ‘outputs’ provided to bipolar, amacrine or ganglion cells. Similar to all other synaptic markers, NL-2 immunoreactivity was uniformly distributed along TH2 dendrites. But, because it is impossible to differentiate between the two types of postsynaptic sites with the limited resolution of confocal microscopy (Bolte & Cordelieres, 2006), the uniform NL-2 distribution alone is not conclusive. For this reason, we additionally labelled TH2 cells for the GABAA receptor ρ subunit, which allowed us to rather selectively label inhibitory outputs from TH2 cells to bipolar cells because the ρ subunit is almost exclusively expressed on bipolar cell terminals (Wässle et al., 1998; McCall et al., 2002) and only to a minor degree on ganglion cells (Rotolo & Dacheux, 2003). Inhibitory synapses containing the ρ subunit had roughly the same density as the CtBP2-labelled excitatory synapses from bipolar cells (~3 synapses per 10 μm) and were evenly distributed along TH2 cell dendrites. Thus, TH2 cells provide GABAergic presynaptic inhibition to bipolar cell terminals via their entire dendritic arbor. Because NL-2 labelling also showed an even spatial distribution, it seems conceivable that TH2 cells receive inhibition from amacrine cells, and provide inhibition to amacrine and ganglion cells in a spatially uniform way as well.
Taken together, in contrast to polyaxonal cells (Famiglietti, 1992; Völgyi et al., 2001) and other GABAergic amacrine cells such as starburst cells (Euler et al., 2002), TH2 cells in the TH::GFP retina do not spatially segregate synaptic output from input but mix their in- and output machinery within a multifunctional arbor (Grimes et al., 2010).
GABAergic postsynaptic inhibition to W3 and G5 cells
The vertebrate retina contains more than 30 different amacrine cell types (Masland, 2012) and a physiological function has been assigned to only a few of them (e.g. starburst, AII and A17 amacrine cells). To get closer to the function of TH2 cells in the TH::GFP retina, we dye-injected ganglion cells in the TH::GFP mouse line and looked for ganglion cells co-stratifying with TH2 cell dendrites. However, as the mingling of two cells’ dendrites does not necessarily mean that there is a synaptic contact (Helmstaedter et al., 2013), we stained retinas after injections with different markers for inhibitory synapses (NL-2, GABAA receptor subunits α3 and ρ, and gephyrin). With this approach, we identified TH2 cells to contact two different types of ganglion cells with small dendritic trees: W3 (Figs 4 and 5) and G5 cells (Figs 6 and 7). Additionally, we often found contacts to putative G4 (Fig. 8) and G14 cells (Fig. 9).
W3 cells represent a genetically defined ganglion cell type and strongly express the yellow fluorescent protein in the TYW3 mouse retina. They are characterized by a dense dendritic tree that mainly stratifies between the two choline acetyltransferase-immunoreactive bands (Kim et al., 2010), as do the dendrites of TH2 cells (Fig. 1B). Some W3 cell dendrites, however, also arborize close to the INL. This additional arborization varied in extent (cf. Figs 4 and 5). The mean dendritic field area (93 ± 8 μm) was slightly smaller than reported before (114 μm; Zhang et al., 2012). Likely, dye injection into very thin dendrites leads to slight underestimation of the dendritic tree size because the amount of dye reaching the most terminal dendrites may not be enough to resolve dendritic endings against the background. At contact sites between W3 and TH2 cells, we localized NL-2, gephyrin and GABAA receptors, indicating that TH2 cells provide postsynaptic GABAergic inhibition to W3 cells. W3 cells pool rectified inputs from ON and OFF bipolar cells, which makes them sensitive to motion in their receptive field centre (Zhang et al., 2012). However, W3 ON and OFF responses are suppressed by movement in the receptive field surround. While it was reported that this suppression is largely mediated by polyaxonal amacrine cells (Olveczky et al., 2003; Baccus et al., 2008; Zhang et al., 2012), recent connectomic data revealed synaptic contacts to amacrine cells stratifying between 43 and 49% of the IPL that do not show a polyaxonal morphology (ac43–49; Helmstaedter et al., 2013). These cells may correspond to TH2 cells because not only the stratification depth is in a similar range (49 ± 1% for TH2), but also the appearance of the dendrites in whole-mount views (cf. Figs 1 A and 2A; Helmstaedter et al., 2013; their supplementary data 6: cell 303–309). Given their wide-field nature and ON–OFF responses (Knop et al., 2011; Pottek et al., 2011), GABAergic TH2 cells are thus well suited to contribute to the suppression of stimuli in the W3 ganglion cell surround, as suggested by Helmstaedter et al. (2013) for the ac43–49 cell.
TH2 cells, however, do not exclusively contact W3 cells but also make synapses with G5 ganglion cells. G5 cells had a slightly larger dendritic field diameter (118 ± 4 μm) than W3 cells (93 ± 8 μm), co-stratified with TH2 cells and lacked dendrites reaching towards the INL shown for W3 cells. We localized NL-2, gephyrin and the two GABAA receptor subunits α3 and ρ at contact sites between G5 and TH2 cells, indicating that TH2 cells provide postsynaptic GABAergic inhibition also to these ganglion cells. The presence of the ρ subunit at contact points may imply that also in the mouse retina some ganglion cells express this GABA receptor subunit as was reported for the rabbit retina (Rotolo & Dacheux, 2003). G5 cells were suggested to be identical to the ‘transient ON–OFF ganglion cells’ (Helmstaedter et al., 2013) described in the rabbit retina (Sivyer et al., 2011). However, we did not find any evidence for bistratification that was described by Sivyer et al. (2011). Thus, as the function of the postsynaptic G5 cell remains elusive, the functional role of GABAergic inhibition from TH2 cells to G5 cells is unclear so far.
In summary, we suggest that TH2 wide-field amacrine cells of the TH::GFP mouse line do not spatially segregate synaptic output from input. Likely, they mediate presynaptic inhibition to bipolar cell terminals and provide postsynaptic inhibition to at least two ON–OFF ganglion cells with small receptive fields: W3 and G5 cells. Inhibitory contacts to W3 cells suggest that TH2 cells play a role in the suppression of moving stimuli in the surround of W3 cells and are thus important for the detection of object motion in the mouse retina.
Acknowledgements
The authors thank Ralf Enz (University of Erlangen-Nuremberg, Germany) for the generous gift of the anti-GABAA ρ antibody, and Susanne Wallenstein for genotyping the mice. This work was supported by the Deutsche Forschungsgemeinschaft (grant WE849/16-2 to K. D. and R. W.; Research Training Group 1885/1, stipend to B. B.), and the Ministry for Science and Culture of Lower Saxony (PhD program Neurosenses stipend to A. M.).
Abbreviations
-
- Cx36
-
- connexin36
-
- GABA
-
- γ-aminobutyric acid
-
- GCL
-
- ganglion cell layer
-
- GFP
-
- green fluorescent protein
-
- INL
-
- inner nuclear layer
-
- IPL
-
- inner plexiform layer
-
- NL-2
-
- neuroligin 2
-
- PB
-
- phosphate buffer
-
- RFP
-
- red fluorescent protein
-
- TH
-
- tyrosine hydroxylase


