Implementing Evidence-Based Design to Improve Adherence in Self-Administered Treatment Technology
Abstract
A low level of treatment adherence is one of the challenges facing the UK's healthcare system. An estimated 30% to 50% of patients with chronic diseases fail to adhere to prescribed medical interventions. While medical technology provides an opportunity to overcome existing challenges, poor adherence blurs this opportunity by reducing the intervention's positive impact. The spread of the Covid pandemic dramatically increased the pressure on healthcare systems and highlighted the urgency to address the low adherence problem. Various studies have investigated the underlying factors behind low adherence. However, two main gaps were identified: 1) lack of adherence frameworks that consider self-administered treatment technology, and 2) lack of a practical mechanism to help companies consider adherence factors during the design and development of the technology.
This paper introduces the development of an Adherence Framework for self-administered treatment technology and a design-focused adherence canvas used as a practical resource for companies to consider during the design process. Adherence factor data from literature and case studies were triangulated to an eDelphi study used to develop the adherence framework. The presented adherence canvas and Adherence Framework allow companies to consider adherence during the design of self-administered treatment technology.
Introduction
The healthcare system in the UK is facing increasing challenges, especially for chronic diseases (Wilson et al., 2005). These challenges include but are not limited to insufficient funding, lack of resources (Appleby et al., 2014), lack of staff (Buchan et al., 2017) and increasing demand for hospital admissions (Smith et al., 2014). These challenges became apparent during the COVID-19 outbreak that hit the world, including the UK, at the beginning of 2020 (Willan et al., 2020). The outbreak has shown the significant pressure on the healthcare systems around the world, which may suggest that a new look of the system and providing a new system paradigm is needed. This paradigm may involve a wider utilisation of medical technology and the move to self-administrated and patient-empowered interventions where both patients and clinicians move from one-way mentorship relationship to a concordance two-way communication relationship.
Several studies have shown the benefits of adopting medical technology systems, especially for treating chronic diseases (Cutler, 2007; García-Lizana & Sarría-Santamera, 2007; Mirza et al., 2008; Ganasegeran et al., 2017; Wickramasinghe et al., 2011). The self-administered treatment technology can be as effective as clinically administered treatments (Scogin et al., 1990). Additionally, medical technology can reduce medication costs (Hoppe et al., 2000; Scogin et al., 2003), hospital and General practitioners (GPs) admissions, the psychological impact of the disease, instances of surgical intervention and the side effects of using pharmaceutical treatment.
Poor adherence is a challenging problem for healthcare systems (van Dulmen et al., 2007). An estimated 20% to 30% of patients do not take their medications (Viswanathan et al., 2012). The level of non-adherence increases in chronic diseases to between 30% and 50% (Barnett, 2014; Bourbeau & Bartlett, 2008: Nunes et al., 2009; Sabaté, 2003). van Dulmen et al. (2007) reviewed 38 systematic reviews of the effectiveness of adherence interventions and defined three practices:
There are effective practices to improve adherence without a supported theoretical explanation.
There are effective adherence interventions based on behavioural theories.
Some acceptable models can define non-adherence. However, they are poorly effective in improving adherence. The findings reflect a lack of a practical mechanism to consider adherence and the absence of consideration the adherence in self-administered treatment technology.
This paper introduces the development of a design-driven Adherence Framework and Adherence Canvas for self-administered treatment technology. The literature studies were overviewed the understand the factors that affect patient adherence. Practical adherence factors were identified through interviews with five SMEs designing and developing self-administered treatment technology. The data concluded from the literature and case studies were triangulated into the eDelphi study to build and assess an Adherence Framework that can be implemented as an evidence-based design tool for companies to guide, measure and test the consideration of adherence in self-administered treatment technology.
Impact of poor adherence
The study explored the related literature from two main aspects: 1) the challenging problem of adherence and adherence frameworks, and 2) the role of design in behaviour changes and the evidence-based design models and their implementation in healthcare.
The failure to achieve a significant level of adherence can have severe consequences for patient health, including relapsing, morbidity, health status, hospitalisation and mortality (Aldeer et al., 2018; Baum et al., 2012; Viswanathan et al., 2012). Mennini et al. (2015) investigated the cost of poor adherence to antihypertensive therapy in five European countries (Italy, Germany, Spain, France and England) over ten years. The study explored cardiovascular complications associated with hypertension (i.e. stroke, heart attack and heart failure). Improving patient adherence to antihypertensive therapy to 70% could reduce the cases of cardiovascular complications by 82,235 in the five European countries combined, with 6,553 fewer cases in England alone.
Poor adherence also results in financial and workforce burdens, such as increasing healthcare costs and negatively impacting healthcare workforce productivity (Bosworth et al., 2011; Conn et al., 2016). For chronic diseases, the financial cost to the EU healthcare systems was estimated to be £77 billion in 2006, which represents around 10% of their total healthcare expenditure. In England, the drug cost is around £140–210 million. This cost includes the burden of non-adherence to the medical intervention. Improving adherence can reduce costs by an estimated £25.3 million in England (Mennini et al., 2015).
Theoretical frameworks of adherence
Several theories were presented to understand patient adherence. These theories could be categorised into factor-based, psychology-based, and stage-based theories. As the aim of this literature is to identify the factors that influence adherence, only the first two categories were discussed in this study:
Factor-Based Theories.
Factor-based theories explain adherence, focusing directly on the factors that drive the change regardless of the underlying psychological frameworks. The first factor-based model is the WHO adherence factors, defining five dimensions affecting patient adherence. (Aldeer et al., 2018, Sabaté, 2003):
The fifth factor (Patient-related factors) of the WHO model aligned with adherence variables is indicated in the National Institute for Health and Clinical Excellence (NICE) Medical Adherence Guidelines. The guidelines suggest that the causes of patient non-adherence fall into two intersecting categories: intentional and unintentional. The latter factors can be either perceptual, which motivate patients to continue the treatment (e.g. beliefs and preferences), or practical, which influence their ability to adhere to the advised treatment (e.g. limitations in capabilities and resources) (Bosworth et al., 2011; Chapman et al., 2015; Nunes et al., 2009).Social and economic factors
Healthcare team and system-related factors
Condition-related factors
Therapy-related factors
Patient-related factors
Theoretical Adherence Frameworks.
Different theories have been proposed to understand patient adherence to treatment or behaviour change (Rosenstock et al., 1988). Examples of the adherence factors frameworks are briefly highlighted to build an understanding of the influence of the literature informing the adherence factors in the study:
Stimulus Response Theory (SRT)
Stimulus response theory (SRT) focuses on the stimuli of the event rather than on the physiological drivers. SRT theory views learning as the result of events that provide ‘reinforcements’ through rewarding and punishment. For example, a person who is rewarded for a specific behaviour tends to repeat that behaviour to receive the reward or avoid the behaviour (Rosenstock et al., 1988).
Social Learning Theory (Social Cognitive Theory)
Bandura & Walters (1977) introduced social learning theory (SLT), which was later renamed social cognitive theory (SCT). In this theory, the behaviour is a result of mental processing activities (such as reasoning, decision making and problem solving). SCT points out that the drivers of behaviour reinforcements are social in nature (Bosworth et al., 2005) and behaviour is determined by two types of factor categories:
Expectations: Three types of expectations can drive behaviour: 1) expectations about environmental cues such as beliefs and the surrounding environment; 2) expectations about the consequences of the action (outcome expectancies); and 3) expectations about one's ability to perform the behaviour (self-efficacy).
Incentives: An incentive is the value of a particular object or outcome (reward and punishment). For example, relieving pain can be a reward of taking painkillers or being healthy can be a reward of physical exercise.
Some shared factors can be noticed between SR theory and SCT, represented in the reinforcement of rewards and punishments, which are described more broadly in SCT as the expectations about the consequences of the action.
Locus of Control Theory
Rotter (1966) introduced the Locus of Control Theory, which suggests that in the presence of the same information people react differently either by learning different things or responding to reinforcement. These variables can be categorised into two dimensions:
Internal locus of control: the reinforcement of the behaviour is internal to the person. For example, physical exercise rewards the person with good health.
External locus of control: external factors, such as luck, fate and chance, are the drivers of the reinforcements.
There is a shared border between the reinforcement factors in SRT, incentives in SCT theory and the Locus of Control Theory factors. Each of these three theories addresses stimuli factors from different perspectives. SR theory addresses it from a reward/punishment/reinforcement perspective. SCT presents the incentive as a broad factor that can include any stimulus to drive the behaviour change.
Self-Efficacy
Bandura & Walters (1977) suggested that social learning is not a strong enough factor to make a person behave or react to reinforcement; the person must also be confident in her ability to perform the behaviour. This aspect is known as self-efficacy. Four aspects affect self-efficacy: performance mastery, vicarious experience, social or verbal persuasion, and physiological cues perceived by the person. Self-efficacy focuses on the internal locus of control factors represented in the locus of control, which is subsequently related to the incentive factor in social learning theory.
Information, Motivation, Strategy
In this model presented by Martin and DeMattio (2013), the adherence drivers are classified into three main factors: information, motivation and strategy (I-M-S). The model addresses three main aims:
Ensure the patient has the right information related to how to adhere to the treatment.
Help the patient to believe in the treatment and commit to it.
Help the patient to overcome the barriers to treatment adherence and develop strategies for chronic disease management (DiMatteo et al. 2012).
The I-M-S model didn't focus on medical technology, especially for new companies working on delivering medical technologies. This model becomes challenging to adopt when manufacturing treatment devices and measuring adherence factors' efficiency. The second observation is that the model did not consider the other factors affecting self-administered treatments adherence.
Figure 1 presents a visualisation of examples of 1) the theoretical frameworks of adherence, 2) the factors in each theory, 3) communication-related factors, and 4) design-related factors. Furthermore, the figure links and re-orders the factors into categories as described below:
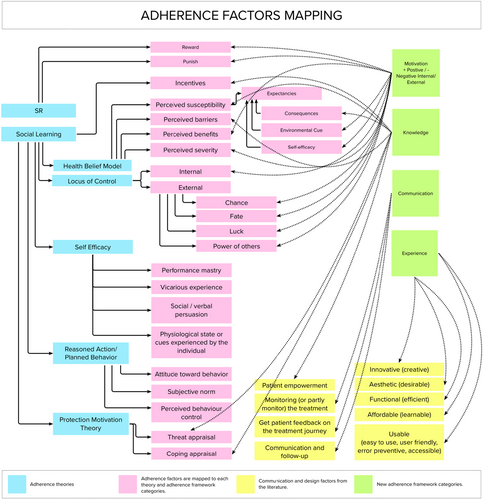
The adherence theoretical frameworks (blue) are presented on the right side. Some theories are linked to each other (grey lines). In some instances, the Social Learning theory overlaps with other theories, such as the Health Belief Model.
In linking different factors and their relationship to each other, three main categories can be identified: Motivation, Knowledge and Communications. The communication between patient and clinician can lead to a higher level of adherence as highlighted in the I-M-S model and the case studies interviews highlighted later in this paper. Factors such as the environmental cue (Social Learning) and subjective norms (Reasoned Action/Planned Behaviour) have communication aspects as they involve social interaction.
In medical technologies, the patient experience extends beyond behaviour change factors to involve design aspects (Fogg, 2009). The lack of linkage (grey lines) between the Experience category and the adherence theories confirms the design aspects' lack of consideration in physical and digital treatments.
Investigating adherence-related theories and mapping the adherence factors to the four categories highlighted in Figure 1 contributes to building the Adherence Framework that is assessed in round one of the eDelphi study highlighted in 6.0 Building the Adherence framework: Delphi Study. The framework is used in the Adherence Canvas used to evaluate companies' adherence consideration as will be discussed in 7.0 Design-Focused Adherence Canvas.
Evidence-based design
The evidence-based design practice has been recently established in the last 25 years, driven by the need for an evidence-based approach to drive the decision-making process (Ulrich et al., 2011). Sackett et al. (1996) defined evidence-based design as ‘the conscientious, explicit, and judicious use of current best evidence in making decisions. Evidence-based design is a growing trend in the healthcare system, especially in space design and hospitals design (McCullough, 2010). As this trend is relatively new, it has recently evolved to consider design elements such as environment, visual design, safety and sustainability.
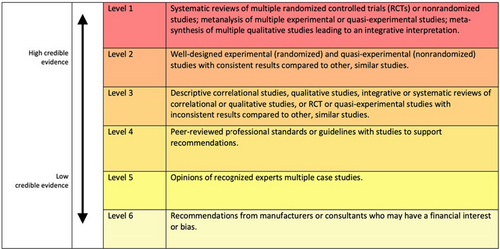
Several models have been presented to categorise the different types of evidence and measure their rigorousness. Examples of these models are the Oxford Evidence-Based Medicine Levels method and the American Institute of Architects Guidelines for Healthcare Design method. While the former method is concerned with medical interventions, the latter focuses on architecture and space design. Figure 2 shows the Health Environments Research & Design Journal (HERD) model, which consists of six levels that classify the research's rigorousness to dictate the design process (Stichler, 2010). These models guided the development of an evidence-based design tool to help companies measure adherence consideration highlighted in 7.0 Design-Focused Adherence Canvas which align with.
Case studies interviews
The second part of the research, interviews with case studies SMEs, contributed to understanding how companies consider adherence while developing self-administered treatment technology regimens. It also contributed to understanding how adherence is considered during the design process. To this goal, purposive and snowball non-probability sampling was used to select and recruit the companies. A total of 353 companies were overviewed and filtered based on the scope of the research to five SMEs. The data collected from the case studies were anonymised and replaced with randomly generated names (YMX, ESA, LW7, 3AB, Z5W and DE7).
Companies have a wide range of experience and the consideration of adherences. Companies with more extended experience in medical technology development (YMX) showed a better consideration for adherence than the other companies. Table 1 below lists the adherence factors and the companies that considered them during the treatment device design. While all the interviewees acknowledged the important role of adherence, the table below shows that most companies considered only a few factors.
| Adherence factor Companies | 3AB | DE7 | LW7 | YMX | ESA |
| Communication with patients | |||||
| Health belief (patients believes about their own health) | |||||
| Knowledge and education | |||||
| Patient empowerment | |||||
| Protective motivation | |||||
| Self-motivation | |||||
| Reasoned action | |||||
| Behaviour change |
Analysing the data from the five companies showed that while self-administered treatment technology can provide solutions to many of the healthcare system's challenges, there is a gap between the theoretical knowledge, industry application, and evaluation (clinical trials). The analysed data from the case studies is triangulated with the literature adherence theories on the first round of the eDelphi study where the panellists' consensus on the Adherence Framework factors.
Building the Adherence framework: Delphi study
The literature review and case studies interviews aimed to build a clear understanding of the problem of adherence and the factors that affect patient adherence to self-administered treatment technology. Data observed from different perspectives was triangulated and fed into a Delphi method to identify and assess the adherence factors.
The Design of the eDelphi Study
- The first round consisted of a questionnaire about the adherence factors. The triangulation of findings from the literature review and case study interviews dictated the questions in this round.
- The second round of the questionnaire posed questions based on the answers received in the first round.
- The third round was based on the second round questions, along with answers to the previous questions, to allow panellists to explore the total panel responses and revise their own if needed.
The Delphi panel included case study founders, medical professionals, founders of medical research bodies in the UK such as AHSN and NIHR, design practitioners and academics. The confirmed number of participants on the panel was 15.
Round One Questionnaire
This round's main aim was to benefit from the experts' points of view regarding the factors that influence adherence. Therefore, the questions take an open-ended qualitative form (Keeney et al., 2011).
- What are the information-related factors you would identify as impacting patient adherence in self-administered treatment? Please list these factors and add explanations where possible.
- What motivation-related factors do you think can affect patient adherence in self-administered treatment technology? Please list these factors and add explanations where possible.
- Which communication-related factors would you identify as impacting patient adherence in self-administered treatment? Please list these factors and add explanations where possible.
- What are the design-related factors you think can affect patient adherence in self-administered treatment technology? Please list these factors and add explanations where possible.
- How can adherence be considered during the development of treatment devices? Please list how adherence can be considered during the design and production of self-administered treatment devices and add explanations where possible.
- Communication
- Knowledge
- Motivation
- Patient Experience
After finalising the code analysis of round one, two inter-raters (R1 and R2) were assigned to conduct the inter-rating reliability process. The raters were asked to generate representative categories and sub-categories for the related (or similar) adherence factors. Table 3 below shows a comparison between code categories of the researcher, R1 and R1. The codes categories were mapped onto each other and the research codes. Table B presented in Appendix 1 summarise the code categories and subcategories for the researcher and both raters.
Calculation of Cohen's Kappa Agreement
The measurements were based on a binary system, with the number ‘1’ referring to an agreement with the initial code, and ‘0’ meaning disagreement with the initial code. Table B presented in Appendix 1 above shows the agreement of both the first and second raters with the initial code. The below Table 5 shows the analysis of the agreement data:
First, Pa was calculated which represents the observed agreement amongst the raters. This value may include the probability of agreement by chance.
Pa = (N00+ N11) / 24.
= (6 + 12) / 24 = 0.8.
Pa: Relative observed agreement amongst raters.
N: Total number of codes (categories and subcategories).
N00: The raters agreed with each other but disagreed with the initial (researcher) codes.
N11: Both raters agreed with the initial (researcher) codes.
Table 2 shows two chances that the raters both agree. The first chance is that they agree on the initial code created by the researcher. In this instance, they would record the same code (or a code with a similar meaning). The second chance is they agree with each other but disagree with the researcher. The second step is to calculate the probability of agreeing with each other by chance (Pe). The equation used to calculate this probability is as follows:
| Rater 2 (R2) | ||||||
| 0 | 1 | Sum | % | |||
| Rater 1 (R1) | 0 | 6 | 3 | 9 | 0.4 | R10 |
| 1 | 3 | 12 | 15 | 0.6 | R11 | |
| Sum | 9 | 15 | 24 | |||
| % | 0.4 | 0.6 | ||||
| R20 | R21 | |||||
Pe = (R10 /N) * (R20 /N) + (R11 /N) * (R21 /N).
= 0.4 * 0.4 + 0.6 * 0.6 = 0.6.
Pe: Hypothetical probability of chance agreement.
R10: Total disagreed codes by the first rater | R11: Total agreed codes by the first rater.
R20: Total disagreed codes by the second rater. | R21: Total agreed codes by the second rater.
Based on the above equation, there is a 0.6 probability that two raters will agree with each other by chance alone. Therefore, the final Cohen's Kappa value is:
K = (Pa-Pe) / (1-Pe).
= (0.8–0.6) / (1–0.6) = 0.5.
Cohen's Kappa value ranges from 0 to 1, where 0 means no agreement occurs without chance and 1 means that there is a full agreement between the raters without any probability of chance. According to this rate, the results show the value of 0.5 (Table 3). This value means there is 50% of agreement between the raters due a chance. To evaluate the value of data reliability in Cohen's Kappa, Landis and Kock (1977) method was used to measure the outcome of Kappa's equation. According to the right side of the below table, the value of 0.5 refers to a moderate level of reliability (Cohen, 1960; Hruschka et al., 2004).
| Value of reliability | Strength of agreement |
|---|---|
| <0.00 | Poor |
| 0.00–0.20 | Slight |
| 0.21–0.40 | Fair |
| 0.41–0.60 | Moderate |
| 0.61–0.80 | Substantial |
| 0.61–0.80 | Almost perfect |
Round one of the eDelphi study presents a triangulation between adherence literature, the findings of the case studies' interviews and the input from the panellists. The agreement between the raters indicates a moderate agreement on the naming of the categories and their representation to the adherence factors. These categories present the Adherence Framework that will be used in the development of evidence-based design tool which is the Adherence Canvas highlighted in Design-Focused Adherence Canvas section.
Delphi Round Two
The questionnaire (four questions) was based on the Likert Scale question type to afford the chance to measure the importance of every subcategory collected from round one. Each category identified in round one required one matching Likert scale question. Each question presented a category from round one's content analysis for adherence factors. The rating scale included five levels, in ordinal scale, for the importance of the factors. The levels were: Very High (5), High (4), Moderate (3), Low (2), and Very Low (1).
The N/A option was available for panellists who thought that the factor was not applicable.
A comments section let panellists provide further thoughts about the rating system. While these comments may have contributed to guiding the third round, their main purpose was to get the opportunity to collect further opinions from the panellists which could be used to build the final Adherence Canvas.
Results overview and analysis
The data analysed has showed a rough agreement on the level of importance between the panellists. The figures (3, 4, 5 and 6) provide a visual overview of the answers and how the majority of the answers fell on the right side of the scale (High and Very High).

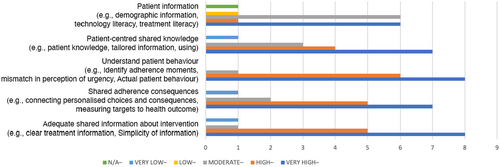
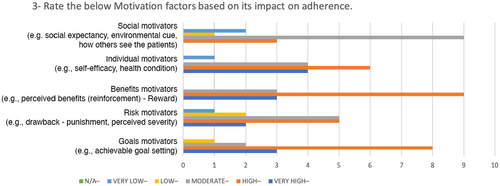

In Table 4, the SD values reveals there is high agreement on some of the factors such as: understanding of patient behaviour, benefits motivators, patient-centred design and design research. For these values, the minimum level of importance is 2 and the maximum level is 5.
| Round 2 SD | Round 3 SD | |
|---|---|---|
| Patient-Clinician Relationship | 0.74322 | 0.63994 |
| Communication Effectiveness | 0.72375 | 0.63994 |
| Clinician-Side Implementation | 0.86189 | 0.70373 |
| Intervention Usage | 0.78446 | 0.79881 |
| Confidentiality and Privacy | 1.01419 | 1.03280 |
| Adequate Shared Information about Intervention | 1.09978 | 0.74322 |
| Shared Adherence Consequences | 1.12546 | 0.73679 |
| Understand Patient Behaviour | 0.63994 | 0.63246 |
| Patient-Centred Shared Knowledge | 1.16292 | 0.81650 |
| Patient Information | 1.09945 | 0.96115 |
| Goals Motivators | 1.29099 | 0.74322 |
| Risks Motivators | 1.11270 | 1.12122 |
| Benefits Motivators | 0.65465 | 0.65465 |
| Individual Motivators | 1.08233 | 0.74322 |
| Social Motivators | 0.91548 | 0.79881 |
| Product Design Characteristics | 0.67612 | 0.70373 |
| Patient-Centred Design | 0.61721 | 0.63994 |
| Design for Adherence | 0.91026 | 0.91026 |
| Design Research | 0.61721 | 0.70373 |
| Device Usage | 0.82808 | 0.51640 |
| Valid N (listwise) | 15 | 15 |
| N | Mean Ranking | Sum of Rankings | ||
|---|---|---|---|---|
| Round_3_SD - Round_2_SD | Negative Rankings | 11a | 8.73 | 96.00 |
| Positive Rankings | 3b | 3.00 | 9.00 | |
| Ties | 1c | |||
| Total | 15 | |||
- a Round_3_SD < Round_2_SD.
- b Round_3_SD > Round_2_SD.
- c Round_3_SD = Round_2_SD.
- a Wilcoxon Signed Ranks Test sing the Z statistic.
- b Based on positive ranks.
| Category | Sub-category | Level of importance |
|---|---|---|
| Collaboration and Partnership | Patient–clinician relationship (e.g. monitoring tech, consistency, follow-ups, feedback, confidentiality, adaptability) | 5 |
| Effective communication (e.g. suitable language, style of communication) | 5 | |
| Clinician side implementation (e.g. clinical implementation, clinical trials feedback) | 4 | |
| Usage intervention (e.g. support, reduced communication) | 4 | |
| Confidentiality and privacy (e.g. reliability, trust) | 5 | |
| Knowledge and Information | Adequate information shared about intervention (e.g. clear treatment information, simplicity of information) | 5 |
| Shared adherence consequences (e.g. connecting personalised choices and consequences, measuring targets fpr the health outcome) | 5 | |
| Understand patient behaviour (e.g. identifying adherence instances, mismatch in perception of urgency, actual patient behaviour) | 4 | |
| Patient-centred shared knowledge (e.g. patient knowledge, tailored information, usage) | 5 | |
| Patient information (e.g. demographic information, technology literacy, treatment literacy) | 3 | |
| Motivation | Goals (e.g. setting achievable goals) | 4 |
| Risks (e.g. perceived severity (suffering–drawbacks) | 4 | |
| Benefits (e.g. perceived benefit (reinforcement–reward) | 4 | |
| Individual (e.g. self-efficacy, health condition) | 4 | |
| Social (e.g. social expectancy, environmental cues, how others perceive the patient) | 3 | |
| Patient Experience | Product design characteristics (e.g. aesthetic, packaging and usage process) | 4 |
| Patient-centred design (tailoring) (e.g. usability, patient characteristics, psychological factors) | 5 | |
| Design for adherence (e.g. compliance measurement, concordance, patient participation in treatment process, guidance on factors influencing adherence) | 5 | |
| Design research (e.g. field research and testing, prototyping iteration) | 4 | |
| Device usage (e.g. practicality, affordability, comfortability, self-administration of treatment, social support, facilitation) | 5 |
The analysis overview has shown evidence of a level of agreement between the panellists; this observation is supported by the value of the standard deviation around the mean of each factor. Therefore, the third round of the Delphi process aimed to identify the consensus between the panellists on the results from round two.
Delphi Round Three
In this round, the same questionnaire from round two was circulated amongst the panellists. This time, they were able to see the combined answers from round two showing the overall rating from the panellists. Also, they were able to see their previous answers in case they forgot their inputs in round two. The procedure aimed to allow the panellists to check the panel answers and provide them with the chance to change their minds.
Results Overview and Analysis
The comparison between round two and round three showed that the panellists modified their answers in a manner which led to a reduction in the SD around the mean (Table 4), which reflects an agreement between the panellists on the level of importance of each factor for improving adherence. Most of the values were biased to the centre and left side of the scale (Very important, Important and Moderate). The importance ratings for two factors had a SD of 1 or more (Confidentiality and Privacy, and Risk Motivators).
Application wilcoxon signed-rank test
- The sample has been randomly selected from the population it represents
- The original scores obtained for each of the ranked objects are in the format of interval/ratio data, and
- The underlying population distribution is symmetrical (Sheskin, 2003).
In Table 6, the values showed negative rankings, which means that the SD values in round three were lower than round two. Three of the values have been ranked positive, which means that the SD increased from round two. One of the values is ranked as a tie, which means that the value in rounds two and three is the same. Table 4 shows that the level of consensus between the panellists has improved in round three compared with round two.
In this study's Wilcoxon test, the null hypothesis is defined as: ‘there is no change in SD in round two and round three, and the difference between round two and three follows a symmetric distribution around zero’. Table 6 below shows the test statistics:
In Table 6 above, the assumption of significance is 0.006, which is lower than the significance level standard (ϴ = 0.05) (Wilcoxon, 1947). Accordingly, the null hypothesis (agreement due to chance) is rejected and there is a significant change between the SD in round two and round three. Round three showed significant agreement between the panellists on the level of importance of the adherence factors for self-administered treatment devices, which is a contribution to knowledge as there is a lack of literature studies which discuss the adherence factors related to medical technology. Table 7 shows the adherence factors, categories, sub-categories and their importance levels based on final results of round 3.
The results from round two and three presents a consensus of the panellists on a generic Adherence Framework used in the Adherence Canvas to guide companies to address adherence factors during the development of the health technology.
Design-Focused Adherence Canvas
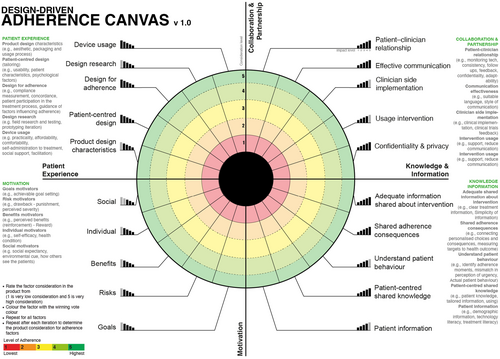
The Design-Focused Adherence Canvas is a one-page Likert Scale Radial Graph.
that allows companies to evaluate how adherence is considered in the treatment device during and after the design process. It evaluates the consideration of the general factors which affect adherence. There are two versions of the Adherence Canvas:
Design-Focused Adherence Canvas
The generic model is based on the consensus of Delphi process (Figure 7) on an Adherence Framework for treatment technology including the factors affecting patient adherence and the importance of each factor. It can be used in to address major diseases, evaluate new products and by companies who do not know the exact adherence factors affecting their treatment intervention are.
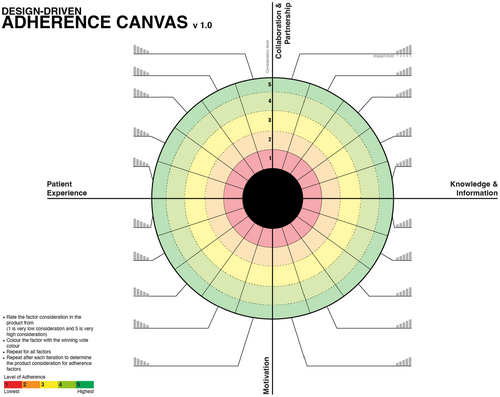
Advanced Design-Focused Adherence Canvas:
This model does not include any factors nor any levels of importance. It can be used by experienced companies who have a clear idea of the factors which affect their patients' adherence (Figure 8).
How the Adherence Can it be Used?
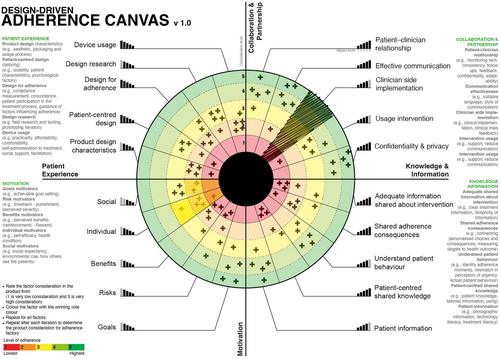
The below example provides a visual guide to the usage of the Design-Focused Adherence Canvas. This example will use placebo (dummy data) answers in the Adherence Canvas to visualise how it works in a real organisational setup.
The voting process
The company needs to determine the voting method to use. Usually, there are two methods: 1) Voting using dots and counting the dots, or 2) If anonymity is required, using a simplified version of the eDelphi method consisting of two rounds.
- The team facilitator codes the factor by colouring it based on its consideration. Irrelevant factors are coded with the colour black (Figure 9).
- The team votes on how adherence factors are considered in the design idea. In Figure 7, the votes are marked with an X.
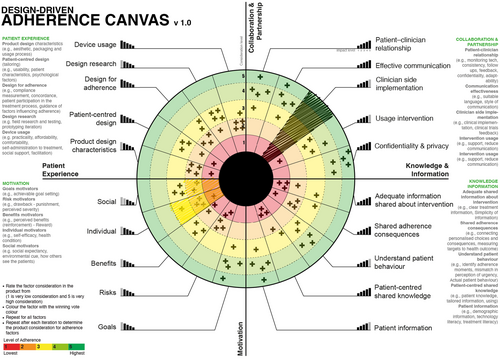
- After finishing the first round, the team votes again in a second round, this time with the ability to see each-others' votes. If more than one consideration level shares the same importance, the voters should repeat the voting by considering that each level should have a unique level of importance (Figure 10).
Post the voting process
The results of the first round of voting are used to iterate the product to improve adherence consideration. The process is repeated in different stages to improve the product, then the team can visualise the different votes to overview how the adherence factors were considered in each prototype (Figure 11 and Figure 12).
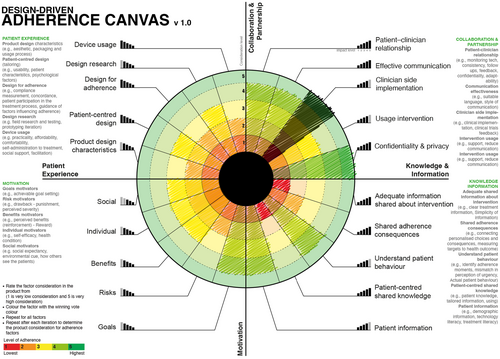
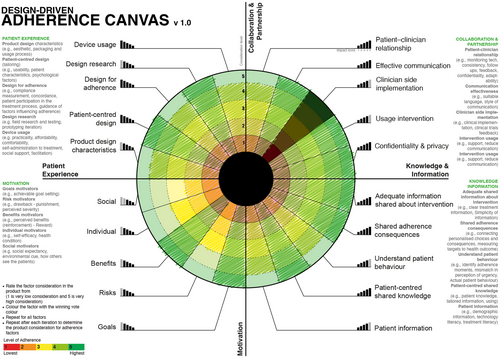
The Adherence Canvas help and documentation are available for companies through a dedicated website: https://www.adherencecanvas.com. The Adherence Canvas can be downloaded and used under the creative common: Attribution-ShareAlike 4.0 International.
Conclusion
Poor adherence presents one of the challenges facing the healthcare system in the UK and worldwide. This poor adherence level increases in chronic diseases and self-administered treatments. While there is a gap in considering factors that affect self-administered treatment technology, this paper introduces an Adherence Framework and Adherence Canvas to evaluate, measure and improve the consideration of adherence in self-administered treatment technology. The study presents an Adherence Framework and the Adherence Canvas to 1) guide companies to consider adherence factors, especially new companies or companies developing new technology and 2) help companies evaluate the consideration of adherence factors during the design and development of the treatment technology intervention. The improvement of patient adherence can have significant benefits for the healthcare system, including improving patient health, increasing the intervention's effectiveness, and reducing the cost and the stress on the healthcare system.
Theoretical frameworks of adherence and interviews with five SMEs case studies were investigated to explore the factor-based and psychological-based theories, and design factors that affect behaviour change were investigated. Five SMEs were interviewed to understand the consideration of adherence during the treatment technology design and development. The factors were mapped into motivation, knowledge, communication, and experience categories.
The data was triangulated and assessed using the eDelphi method by panellists from the healthcare system and health technology designers. The eDelphi method involved three rounds. The process aimed to explore the panel's consensus on the Adherence Framework. The first round was analysed using content analysis and validated using inter-rater reliability. The agreement between raters was moderate based on Cohen's Kappa's Landis and Kock Agreement measure showing the possibility of 50% agreement based on chance. The final questionnaire was evaluated using the Wilcoxon test resulting in the assumption of a significance of 0.006, which means that the ratio of chance agreement is lower than the significance level standard (ϴ = 0.05).
Further research will test the Adherence Framework and Adherence Canvas in self-administered treatment technology for chronic diseases. This research's contribution to knowledge includes identifying the gap between knowledge and practice related to adherence to self-administered treatment technology, which opens the door for further research in this domain.
Appendix 1:
Table A Content analysis and categorisation for Delphi round one questionnaire.
| Categories | Subcategories | Codes | Participants | Item Count |
|---|---|---|---|---|
| Communication | Patient-clinician relationship | Acknowledge change in physician role | 1 | 1 |
| Replace communication with monitoring tech | 1 | 1 | ||
| Consistence communication | 1 | 1 | ||
| Communication effectiveness | Effective communication and feedback | 9 | 16 | |
| Follow-up and reminders | 3 | 4 | ||
| Language used suitability | 1 | 3 | ||
| Right style of communication | 1 | 1 | ||
| Promotional communications | 1 | 1 | ||
| Clinician side implementation | Clinical implementation | 1 | 1 | |
| Clinical trials feedback | 1 | 1 | ||
| Intervention usage | Intervention support | 3 | 3 | |
| Confidentiality and privacy | Reliability and trust | 7 | 10 | |
| Knowledge | Adequate shared information about intervention | Clear treatment information | 7 | 12 |
| Simplicity of information | 3 | 4 | ||
| Shared adherence consequences | Connecting personalised choices and consequences | 1 | 1 | |
| Measuring targets of health outcome | 1 | 1 | ||
| Effective treatment testing | 3 | 3 | ||
| Understand patient behaviour | Mismatch in perception of urgency | 1 | 1 | |
| Perceived susceptibility – Belief selection | 5 | 6 | ||
| Actual patient behaviour | 1 | 1 | ||
| Identify adherence moments | 1 | 1 | ||
| Patient information | Patient demographic information | 1 | 1 | |
| Technology literacy | 4 | 4 | ||
| Treatment literacy | 3 | 7 | ||
| Patient-centred shared knowledge | Considering patient knowledge | 9 | 16 | |
| Tailored information | 2 | 4 | ||
| Media used in sharing information | 3 | 3 | ||
| Motivation | Goals motivators | Achievable goal setting | 3 | 4 |
| Risk motivations | Drawback – Punishment | 4 | 4 | |
| Perceived severity – Punishment | 3 | 5 | ||
| Benefits motivators | Perceived benefits (reinforcement) – Reward | 9 | 15 | |
| Internal motivators | Self-efficacy | 4 | 5 | |
| Health condition | 1 | 1 | ||
| Environmental motivators | Subjective norm – Environmental cue | 5 | 5 | |
| Patient Experience | Product design characteristics | Aesthetic | 5 | 5 |
| Packaging and usage process | 1 | 1 | ||
| Patient-centred design (tailoring) | Considers patient characteristics | 10 | 16 | |
| Psychological factors | 3 | 3 | ||
| Inclusive | 1 | 1 | ||
| Usability | 8 | 14 | ||
| Adherence consideration | Compliance measurement | 2 | 2 | |
| Concordance – Participation | 5 | 8 | ||
| Considering adherence during development | 3 | 7 | ||
| Guidance of factors influencing adherence | 1 | 2 | ||
| Design research | Field research and testing | 5 | 7 | |
| Design prototyping iteration | 3 | 5 | ||
| Device usage | Practicality | 1 | 1 | |
| Affordability | 1 | 1 | ||
| Comfortability | 3 | 3 | ||
| Self-administration to treatment | 4 | 4 | ||
| Social support – Facilitation | 8 | 13 |
Table B: Summary of the code categories and subcategories for the researcher and both raters.
| Researcher | R1 | R2 | R1 | R1 |
|---|---|---|---|---|
| Communication | Communication | Communication: | 1 | 1 |
| Patient-clinician relationship | Patient-clinician relationship | Facilitated physician-patient relationship | 1 | 1 |
| Communication effectiveness | Communication effectiveness | Adequate communication about device usage | 1 | 1 |
| Clinician-side implementation | 0 | 0 | ||
| Intervention usage | Communication about device credentials | 0 | 1 | |
| Confidentiality and Privacy | 0 | 0 | ||
| Knowledge | Knowledge | Information: | 1 | 1 |
| Adequate shared information about intervention | Treatment information | Appropriate delivery of information | 1 | 1 |
| Shared adherence consequences | Adherence information | Comprehensive content of information | 1 | 1 |
| Patient-centred shared knowledge | 0 | 0 | ||
| Understand patient behaviour | 0 | 0 | ||
| Patient information | Patient information | 1 | 0 | |
| Motivation | Motivation | Motivation factors for adherence | 1 | 1 |
| Goals motivators | Behaviour motivation | Motivating features of treatment | 1 | 1 |
| Risk motivations | 0 | 0 | ||
| Benefits motivators | Positive expectations from treatment | 0 | 1 | |
| Environmental motivators | 0 | 0 | ||
| Internal motivators | Physiological Factors | Patient acceptance of condition and treatment | 1 | 1 |
| Patient Experience | Patient Experience | Product design considerations: | 1 | 1 |
| Product design characteristics | Product design characteristics | Product characteristics | 1 | 1 |
| Patient-centred design (tailoring) | Patient-centricity | 0 | 1 | |
| Adherence consideration | Adherence consideration | 1 | 0 | |
| Design research | Design research | Iterative design process | 1 | 1 |
| Device usage | Device usage | 1 | 0 |
-
The colouring of Table 3 was used to clearly overview the agreement between the raters. This step was made to make the process of calculating each case individually easier. The colour code is as follows:
Both raters disagreed with the initial code
 Both raters agreed with the initial code
 Only R1 agreed on the initial code
 Only R2 agreed on the initial code
Biographies

Dr Rafiq Elmansy is a lecturer in Graphic Digital and Communication Design at the School of Design, University of Leeds. His area of research is design for health with a focus on patient adherence and behaviour change in self-administered health technology and how to use design thinking in patient empowerment.

Dr Stuart English is Associate Professor in design-led innovation at Northumbria University. His work on multiple-perspective problem framing has initiated new methods, new products and new intellectual property focussed specifically in self-administered health technologies.


