Parental social consequences of having a child with cerebral palsy in Denmark
Abstract
Aim
To analyse the social situation of parents who have a child with cerebral palsy (CP).
Method
This was a population-based longitudinal study with linkage to public registries. Parents of children with CP (n=3671) identified in the Danish CP Registry were compared with 17 983 parents of children without CP. Employment, income, cohabitation status, and presence of additional children were factors analysed during a follow-up period of 28 years. We followed parents from before their child was born and up to the age of 43 years of the child.
Results
Mothers of children with CP under the age of 10 were less often employed: odds ratio [OR] of employment at age 5y 0.45 (95% confidence interval [CI] 0.36–0.57), but only 11% left the labour market. Mothers of children without CP had higher incomes: ratio full-time working 1.11 (95% CI 1.07–1.15). The risk of not living together was not increased among parents of children with CP: at age 5 years OR 1.04 (95% CI 0.84–1.28). Parents of children with CP as the first born postponed or more seldom had subsequent children: hazard ratio [HR] 0.75 (95% CI 0.68–0.83).
Interpretation
The Danish welfare system seems to have succeeded in keeping parents in the labour market and living together with their child. Special attention needs to be paid to the financial situation of families with children with CP under 10 years of age.
What this paper adds
- Most parents in Denmark stay in the labour market after the birth of a child with cerebral palsy (CP).
- Parents of children with CP do not stop living together more often than parents of children without CP.
- Mothers of children aged 0 to 10 years with CP are more often not employed and have a lower income.
This article is commented on by Horridge on pages 704–705 of this issue.
Having a child with cerebral palsy (CP) changes the lives of parents. Speculation on the future of the child and how CP will affect everyday life is inevitable. Parents might stay at home and constantly support the child to ensure optimal development. The resources allocated to the child might be substantially more than expected. Less time and energy are left for personal care,1 marital activities, and siblings. Parents of children with CP have higher levels of stress2 and worse physical and psychological health,3 compared with parents of children without disabilities. Research indicates that the burden of care is a matter of socio-structural constraints rather than emotional distress,4 and that parents of severely disabled children continually create and sustain their personal resources in the early years of the child's life.5 The sparse literature about the process parents go through after having a children with CP, indicates that parental adaptation might change during childhood and adolescence.6
The function and well-being of parents is crucial to a child with CP (and to the parents themselves).7 Few studies have quantitatively explored how caring for a child with CP or any other childhood disability affects the social situation of parents,8 and the limited results available are inconsistent. Studies, mainly in North America, agree that mothers of children with disabilities are less likely to be employed;8, 9 if they are employed are more likely to work fewer hours;3 and are more likely to divorce.10 In Scandinavia, a Danish study found a higher risk of parental relationship termination in families with a child with disability or chronic illness,11 while a Norwegian study finds that parents of a child with disability are more likely to live together.12 A British study found that children with a disability were more likely to grow up in poverty; however, this was not evident when taking personal and social resources into account.13 Many studies are small, cross-sectional, or include children of different ages and with different types of disabilities from selected populations.
CP is the most common motor impairment in childhood, with a birth prevalence of 2 per 1000 live births.14 It is often accompanied by difficulties in cognition and communication, epilepsy, and impairment of hearing or vision.15 As a consequence, CP is representative of a range of childhood disabilities.
The purpose of this population and register-based longitudinal study was to analyse the influence of having a child with CP on parental education, employment, income, cohabitation status, and additional children. Socio-economic data on the parents were analysed before the children were born, during childhood, and into adulthood.
Method
Population
Parents of all 1856 children born during 1965 to 1990, registered in the Danish Cerebral Palsy Registry, and living in East Denmark at 6 years of age were included. For each 6-year-old child with CP living in East Denmark, five age- and sex-matched children without CP were randomly selected from the Danish Civil Registration System. Of the children without CP, 24 were subsequently found to be registered in the Danish Cerebral Palsy Registry so were excluded, leaving a group of 9256 children.
In total 99% of biological parents of children with CP were identified with a valid record in Statistics Denmark (n=3671 [99%]) and participated in the study. At least one parent was identified for 98% of the children with CP (1824 children) and both parents were identified for 94%. In total 97% of biological parents of children without CP were identified with a valid record in Statistics Denmark (n=17 983 [97%]) and participated in the study. At least one parent was identified for 99% of children without CP (n=9156), and both parents were identified for 95%.
Registers
Annual data on the education, employment, income, and cohabitation status of parents was obtained from Statistics Denmark from 1980 to 2008, and data on siblings was obtained from 1980 to 1999. The parents of children who died or emigrated were included in the study up until that point in time.
The Danish Cerebral Palsy Registry is a population-based registry including children with congenital CP. Details on data collection and validity are described elsewhere.16, 17 Statistics Denmark holds a range of public registries concerning the social situation of all citizens in Denmark. Registries are linked, based on a unique personal identifier in the Danish Civil Registration System. The data sources are educational institutions, workplaces, and local authorities obligated by law to deliver information to Statistics Denmark.
The definition of CP is as agreed in the European collaboration of cerebral palsy registries, Surveillance of Cerebral Palsy in Europe (SCPE).14 Children with CP in this study were categorized into four groups of severity, which took into account walking ability and intellectual impairment, both estimated from medical records, when the child was around 6 years old. Unfortunately, older children in the register were not classified according to the Gross Motor Function Classification Scale (GMFCS), so we used the older classification of ability to walk without aids. The four groups are (1) ‘slight impairment’, including children with an estimated IQ>85 and walking without aids (grossly corresponding to GMFCS level I and II); (2) ‘mainly motor impairment’, including children with an estimated IQ>85 but not able to walk without aids (grossly corresponding to GMFCS level III, IV, and V); (3) ‘mainly intellectual impairment’, including children with an estimated IQ<85 but able to walk without aids; and (4) ‘motor and intellectual impairment’, including children with an estimated IQ<85 and not able to walk without aids. Only a few medical files included results from a psychological evaluation, and if not presented, the level of cognitive development was estimated from clinical assessment based on neuropaediatric conclusions.
Income was based on annual pre-tax income adjusted to 1980 prices. Tax-free benefits received by the parents were not included in annual income; these are typically benefits to pay for specific extra expenses occurring as a result of the disability. Based on the main income source, parents were categorized as either employed or not employed, and based on work insurance, categorized as working full-time (>30h/wk), working part-time (9–30h/wk), working unknown hours, or not working. Parents ‘not working’ included all parents who didn't have employment as the main income source, for example parents who were unemployed, under education or receiving pension. Income was analysed separately for three groups: working full-time, working part-time, and not working. Cohabitation was measured by comparing address codes. Siblings were defined as children with the same biological parents as the child being studied.
Statistical methods
The education, employment, and cohabitation status of parents (mothers and fathers analysed separately) was analysed using logistic regression, with being a parent of a child with or without CP used as the explanatory variable in the model. For each age of the child and outcome we performed two analyses: one analysis compared parents of children with and without CP, regardless of severity of CP, and another analysis compared parents of children without CP with the four levels of severity of CP. Ratios between incomes of parents of children with and without CP were calculated annually. Income was analysed using linear regressions as the log (income) of three groups of employment: working full-time, part-time, or not working. All analyses included four levels of severity of CP and were performed at 2 years before the birth of a child and then at age 5, 10, 15, 20, and 25 years, and controlled for possible confounders (Table 1) the year before birth. Parents working an unknown number of hours and/or with extremely low or high incomes were left out of the analyses of income.
| n | 2y before birth | n | 5y | n | 10y | n | 15y | |
|---|---|---|---|---|---|---|---|---|
| Mother's educationa | No higher education | No higher education | No higher education | No higher education | ||||
| Children without CP | 3329 | 1 | 2759 | 1 | 2746 | 1 | 2716 | 1 |
| All children with CP | 667 | 1.49 (1.19–1.88) | 568 | 2.00 (1.04–3.86) | 554 | 1.49 (0.94–2.36) | 532 | 1.04 (0.74–1.48) |
| Children without CP | 3329 | 1 | 2759 | 1 | 2746 | 1 | 2716 | 1 |
| CP and slight impairment | 235 | 1.44 (1.00–2.06) | 205 | 1.85 (0.62–5.56) | 200 | 1.13 (0.56–2.29) | 196 | 0.92 (0.54–1.57) |
| CP and mainly motor | 53 | 1.22 (0.63–2.38) | 43 | 4.32 (0.52–36.09) | 41 | 2.34 (0.50–11.00) | 41 | 1.04 (0.37–2.99) |
| CP and mainly intellectual | 112 | 1.16 (0.69–1.98) | 102 | 1.68 (0.35–8.01) | 102 | 3.48 (0.80–15.26) | 99 | 1.56 (0.64–3.78) |
| CP and motor and intellectual | 258 | 1.84 (1.27–2.67) | 216 | 1.84 (0.69–4.91) | 209 | 1.32 (0.67–2.61) | 194 | 1.00 (0.58–1.72) |
| Mother's employmentb | n | Employment | n | Employment | n | Employment | n | Employment |
|---|---|---|---|---|---|---|---|---|
| Children without CP | 3318 | 1 | 3481 | 1 | 3155 | 1 | 3300 | 1 |
| All children with CP | 662 | 0.84 (0.65–1.07) | 673 | 0.45 (0.36–0.57) | 598 | 0.58 (0.44–0.56) | 617 | 0.78 (0.60–1.00) |
| Children without CP | 3318 | 1 | 3481 | 1 | 3155 | 1 | 3300 | 1 |
| CP and slight impairment | 235 | 0.87 (0.58–1.30) | 254 | 0.92 (0.61–1.39) | 224 | 1.34 (0.80–2.24) | 236 | 0.79 (0.53–1.17) |
| CP and mainly motor | 53 | 4.17 (0.98–17.75) | 59 | 0.21 (0.11–0.40) | 49 | 0.41 (0.17–0.95) | 53 | 0.79 (0.32–1.92) |
| CP and mainly intellectual | 111 | 0.89 (0.51–1.53) | 114 | 0.63 (0.37–1.09) | 104 | 0.51 (0.29–0.89) | 110 | 0.62 (0.37–1.04) |
| CP and motor and intellectual | 254 | 0.70 (0.50–0.99) | 243 | 0.27 (0.19–0.38) | 219 | 0.37 (0.26–0.54) | 215 | 0.86 (0.57–1.29) |
| Parents’ cohabitationc | n | No cohabitation | n | No cohabitation | n | No cohabitation | n | No cohabitation |
|---|---|---|---|---|---|---|---|---|
| Children without CP | 3199 | 1 | 3458 | 1 | 3406 | 1 | 3338 | 1 |
| All children with CP | 632 | 1.22 (1.00–1.48) | 663 | 1.04 (0.84–1.28) | 654 | 0.97 (0.80–1.18) | 630 | 0.87 (0.72–1.05) |
| Children without CP | 3199 | 1 | 3458 | 1 | 3406 | 1 | 3338 | 1 |
| CP and slight impairment | 226 | 1.00 (0.73–1.37) | 248 | 0.87 (0.62–1.23) | 245 | 0.97 (0.72–1.32) | 242 | 0.85 (0.63–1.14) |
| CP and mainly motor | 49 | 0.92 (0.47–1.81) | 54 | 0.68 (0.31–1.49) | 52 | 0.60 (0.29–1.23) | 52 | 0.52 (0.26–1.04) |
| CP and mainly intellectual | 106 | 1.07 (0.69–1.66) | 116 | 1.15 (0.74–1.80) | 115 | 1.11 (0.74–1.69) | 111 | 0.92 (0.61–1.40) |
| CP and motor and intellectual | 243 | 1.57 (1.17–2.10) | 247 | 1.24 (0.91–1.69) | 239 | 0.99 (0.74–1.13) | 222 | 0.96 (0.71–1.30) |
- aAnalyses of mother's education were adjusted for sex and birth year of child, number of siblings the year before the child was born, age of mother and except in analyses 2y before the child was born adjusted for highest education of mother the year before the child was born and cohabitation of parents the year before the child was born. bAnalyses of mother's employment were adjusted for sex and birth year of child, number of siblings the year before the child was born, age of mother and except in analyses 2y before the child was born adjusted for employment status and highest education of mother the year before the child was born and cohabitation of parents the year before the child was born. cAnalyses of parents' cohabitation were adjusted for sex and birth year of child, number of siblings the year before the child was born, age of mother and father and except in analyses 2y before the child was born adjusted for highest education of mother the year before the child was born and cohabitation of parents the year before the child was born. Figures in bold are statistically significant results when comparing the large number of children with and without CP.
Time to birth of next younger biological sibling was analysed using Cox's proportional hazards model for parents with or without children with CP and with or without older siblings. The model included sex and birth year of the child and the age of the mother as explanatory variables. OR, ratio, and HR are reported with a 95% confidence interval in brackets.
Ethics
The Danish Data Protection Agency approved this study. The civil registration number of each participant was delivered to Statistics Denmark, and an identification number replaced each civil registration number immediately after being linked to other registries. All analyses are based on this number, and identifying specific individuals is neither possible nor legal. Only Statistics Denmark knows the link between the civil registration number and the new identification number.
Results
Table 1 shows the effect of having no higher education, being employed, and not cohabitating on mothers of children with CP compared with children without CP 2 years before the child was born and at ages 5, 10, and 15 years. Analyses after the child was born are adjusted for parents’ sociodemographic situation before the child was born as described in the table.
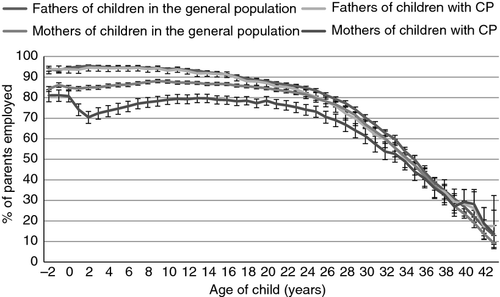
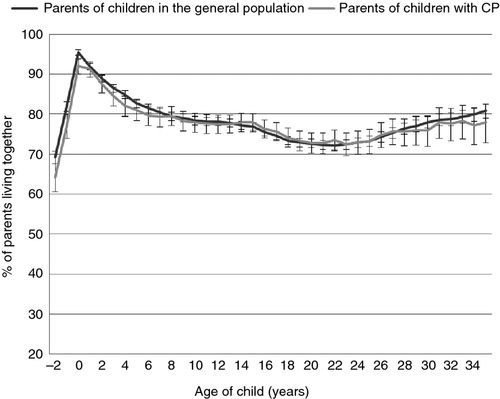
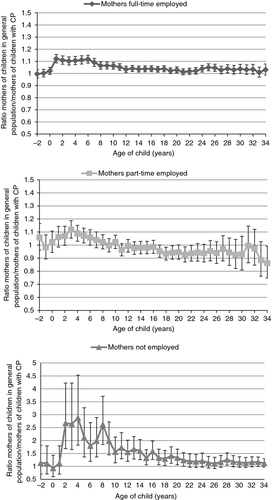
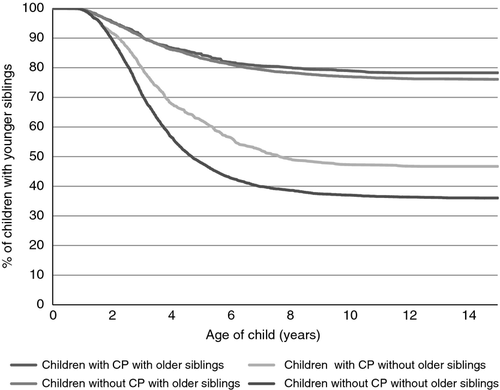
Figures 1 and 2 show raw frequency of employment and cohabitation, and Figure 3 presents raw ratios of annual pre-tax income. All figures compare parents of children with and without CP. Results are shown for all ages of the child and from before the child was born. Sample sizes for each estimate of employment or cohabitation at a certain age of the child include a minimum of 500 persons with CP and 3400 persons without CP up to the ‘child’ age of 30. For ages older than 30 years, sample sizes include a minimum of 50 persons with CP (sample sizes are only lower than 200 persons at >40y) and 300 persons without CP. Sample sizes of estimates of income of full-time working mothers include a minimum of 400 persons with CP and 2400 without CP; for part-time working mothers include a minimum of 10 with CP and 50 without CP; and for not working mothers include a minimum of 70 with CP and 400 without CP. Figures show unadjusted results. Figure 4 shows the percentage of children with and without CP with younger siblings.
Employment and education
Two years before the birth of their child, fewer mothers of children with CP had received a higher education compared with mothers of children without CP (Table 1). This was especially evident in mothers of children with a combined intellectual and motor impairment. The difference was still evident when the child was 5 years old, taking into account the mother's education before the child was born. However, at the age of 10 the difference in the educational level between mothers of children with and without CP was no longer significant, and by the time the child was 15 years old the difference had disappeared. We found no significant difference in the level of education between fathers of children with or without CP: OR of having no higher education 2 years before the child was born 1.19 (95% CI 0.94–1.49), and OR when the child was 5 years old 1.06 (95% CI 0.63–1.78).
We found no overall significant difference in employment rates between mothers of children with and without CP 2 years before the child was born (Table 1). However, significantly fewer mothers of 5- to 10-year-old children with CP were employed. At child age 15 the difference was no longer significant, and at the age of 20 it had disappeared. Figure 1 shows the proportion of mothers and fathers employed from before the child was born and into adulthood. Two years before having a child most mothers were employed, and most seemed to remain in employment after having their child. In total, 11% of mothers of children with CP left the labour market after having a child with CP. Cross-sectional analyses suggested that most mothers became re-employed when the child was around 15 years old.
Employment varied according to severity of CP (Table 1). Mothers with children with only slight impairments did not have significantly lower chances of employment at any time. The risk of being outside the labour market when the child was 5 and 10 years old was highest among mothers of children with motor impairments.
The birth of a child, with or without CP, did not affect the employment status of fathers. Parents of children with CP did not seem to withdraw earlier from the labour market compared with parents of children without CP (Fig. 1).
Mothers of children with CP more often worked part-time than mothers of children without CP (p<0.001 at age 5y). When the child was 5 years old, we found 62% of mothers of children with CP worked full-time, 28% worked part-time, and 10% worked unknown hours. This was compared to 74% of mothers of children without CP who worked full-time, 18% worked part-time, and 9% worked unknown hours. Of the employed fathers of children with and without CP, 1% worked part-time (p=0.48 at age 5y).
Income
We found that no overall difference in incomes between mothers of children with and without CP 2 years before the child was born: income for full-time working mothers with children without CP ratio 1.00 (95% CI 0.97–1.03), part-time working ratio 1.06 (95% CI 0.97–1.16), and not working ratio 1.80 (95% CI 0.88–3.67). However, at age 5, mothers of children without CP had a higher pre-tax annual income compared with mothers of children with CP of the same age: ratio of full-time working mothers with children without CP 1.11 (95% CI 1.07–1.15), part-time working ratio 1.11 (95% CI 1.04–1.19), and not working ratio 2.31 (95% CI 1.21–4.42). In children aged 15 years, no significant difference was seen in income between mothers of children with and without CP who worked either full-time or were not working: ratio full-time working mothers with children without CP ratio 1.02 (95% CI 1.00–1.06) and not working ratio 1.44 (95% CI 0.98–2.12). Part-time working mothers of children without CP had a lower income compared with mothers of children with CP: ratio 0.82 (95% CI 0.72–0.93). Analyses were adjusted for age and sex of the child, age of the mother and education, cohabitation, and older siblings before the child was born.
Mothers of children without CP who were in working full-time earned 11% more when the child was 5 years old and 6% more when the child was 10 years old, compared with mothers of children with CP (Fig. 3). Mothers of children without CP working part-time earned 7% more when the child was 5 years old, but this difference disappeared as the child grew up (Fig. 3). Mothers of 5-year-old children without CP who were not working earned 112% more than mothers of 5-year-old children with CP who were not working, and they tended to earn at least 50% more in the first 15 years of their child's life, but not later (Fig. 3). Fathers of children without CP earned 3% to 5% more compared with fathers of children with CP, but the difference in income was already present 2 years before the child was born: ratio income full-time working fathers of children with CP 1.04 (95% CI 1.00–1.07).
Cohabitation
Two years before their child was born, parents of children with CP and a combined motor and intellectual impairment were less likely to be living together (Table 1). However, the incidence of not living together was not increased among any parents of children with CP at any age of the child, taking into account the status of cohabitation the year before the child was born. Figure 2 shows the proportions of parents living together from before the child was born and into adulthood. Parents who had never lived together were excluded from the figure. More parents of children with CP than without had never lived together, including the 2 years before the child was born. In total 11% of children without CP had parents who had never lived together, compared with 20% of children with CP (p=0.0487). When the child was 15 years old, 64% of parents of children with CP and 69% of children without CP lived together (p=0.15).
Siblings
At 15 years old nearly 75% of children with CP had biological siblings, compared with 83% of children without CP (p<0.001). Parents of children with CP were less likely to have subsequent children, but the presence of older siblings had a great impact (p<0.001). Parents of children with CP who also had older siblings, did not wait longer to have additional children, HR 0.92 (95% CI 0.79–1.06), while parents of children with CP who were first born postponed or desisted from having further children, HR 0.75 (95% CI 0.68–0.83).
Discussion
Overall, we found little or no social differences between parents having a child with or without CP in Denmark. Most parents continued to work, they lived together, and had subsequent children. To the best of our knowledge, this is the first large population-based study with a longitudinal design, enabling a report of changes in socio-economic position of parents of children with CP from before birth, during childhood, and into adulthood.
Literature on the social consequences for parents of having a child with CP is sparse and, as concluded in a commentary, ‘population-based research particularly on demographic or economic outcomes is scant’.8
We found that mothers of children with CP had received a shorter education before the child was born compared with mothers of children without CP. This was mainly evident in children with combined motor and intellectual impairments, which is in line with a UK study finding the highest deprivation gradient in parents of children with severe intellectual impairment.18
Our finding that the mothers of children with CP are less often employed and more often in a low-income group than mothers of children without CP is in accordance with other studies. In a Canadian study from 2004, 66% of caregivers of children with CP were in paid employment versus 81% of those in a population survey.3 The figures in our study are higher, and this might reflect a higher employment rate among women in Denmark. As found in our study, the Canadian caregivers were more often in the low-income group. A Swedish study from 1992 found differences according to severity of impairment on employment, as we did.19 A Nordic study from 1994 on children with myelomeningocele20 found that 66% of mothers of the disabled children were working or studying full-time versus 77% of the mothers of children without disability. It is remarkable that the social welfare systems in the Nordic countries and Canada seem to succeed in keeping employment high for mothers even after they have given birth to a child with a disability.
Mothers in Denmark who are not employed have a legal right to be paid a public subsidy instead of receiving income by employment. In addition, social regulations allow parents of children with severe disabilities to leave their job for a time to take care of their child until 18 years of age. Being aware of a mother's social situation and supporting her return to the labour market, if desired, is important. In the last couple of years – and after data collection of this study – the structure of region and municipalities, as well as part of the Danish Social Support system, has changed. Some grants for parents of disabled children in Denmark have been reduced, for example the level of subsidy received for taking care of a child at home. New studies are planned evaluating the effects of this and of the financial crises in 2008.
We found no differences in parental cohabitation between parents of children with CP and parents of children without CP; however, the literature is inconsistent. A meta-analysis of six North American studies found a small but significant increased rate of divorce in parents of children with disabilities compared with parents of children without disabilities.10 Our study differed in that we measured cohabitation regardless of marriage. A Danish study likewise based on cohabitation found an increased risk of termination of relationships in parents of children with parent-reported disability or chronic illness.11 We found fewer parents of children with CP living together 2 years before the child was born. Taking this difference into account, we found no differences in cohabitation after the child was born between the parents of children with and without CP.
A Norwegian study found no increase in parents of a disabled child not living in the same household up to the child age of 10. If anything, they report a tendency towards the parents of children with disabilities living together.12 However, although longitudinal, the study is based on a population recruited from rehabilitation services and with a participation rate of around 50%. It is reassuring that we did not find differences in cohabitation when the child grew into adulthood, by which time most will live independently or in residential care.
It is also positive that most children with CP were found to have siblings. Educational and social support systems need to be aware of these children who grow up in a family with special demands from children other than themselves.
The strengths of our study are that the children with CP were recruited from the Danish Cerebral Palsy Registry which minimizes selection bias, compared with recruitment from hospitals or rehabilitation centres. At least one parent was identified for nearly all children, and we consider the parents of children with CP that were included to be close to a representative sample of parents in Denmark of children with CP, aged 0 to 43 years old. A weakness in the longitudinal design is that the parents can only be followed from 1980 when registers became available, and consequently no parents were followed for the entire period from before the child was born to age 43. As a result, comparing outcomes of varying ages of the child might be affected by birth year. Furthermore, we have no information on psychological stress affecting the parents as reported in other studies.2
Acknowledgements
We are grateful to Ludvig & Sara Elsass Foundation, the Health Insurance Foundation, and the Ministry of Social Affairs for funding this study. The funders were not involved in design of the study, data collection, data analysis, manuscript preparation, or publication decisions. The authors have stated that they had no interests that might be perceived as posing a conflict or bias.


