Designing weed containment strategies: An approach based on feasibilities of eradication and containment
Abstract
Aim
To refine strategies for the containment of weed invasions.
Location
World-wide, but primarily Australia and Galapagos Islands.
Methods
By employing theoretical and semi-quantitative models, we estimated conditions under which barrier zones should be established and maintained around core infestations and when eradication of outliers should be attempted. Reference was made to published information on generic dispersal distances and the biological characteristics of a wide variety of weeds, including the targets of well-documented successful and failed eradication programmes.
Results
When weeds generate fat-tailed dispersal distance distributions having relatively high median values, search efficiency will be compromised if barrier zones are employed. The theoretical model developed supports the non-use of barrier zones in management strategies targeting tree weeds that are predominantly wind dispersed, or any species that are dispersed by birds or larger wild mammals. Many weeds that have major impacts on natural ecosystems fall within these categories. Eradication of outliers generally should not be considered where weeds have short juvenile phases and long-lived seeds. Four containment substrategies are distinguished on the basis of whether barrier zones around core infestations are established and whether the eradication of outliers is attempted. The suitability of individual substrategies is indicated for weeds of a variety of growth forms, occurring in a range of land uses, and a decision tree is presented for categorical assignment.
Main conclusions
A structured approach to the development of weed containment strategies will help to promote the efficient use of limited resources. Targeted species vary according to both the relative ease with which core populations can be contained and outlier populations eradicated – containment strategies should be designed accordingly. This study shows that semi-quantitative models can be powerful adjuncts to their theoretical counterparts in support of decision-making for the management of weed invasions.
Introduction
If successful, pro-active management may be a very cost-effective way to avoid or minimize impacts that can arise subsequent to the naturalization of a weed. As a category of invasive alien species, weeds pose a major threat to biodiversity (Gaertner et al., 2009; Hejda et al., 2009; Powell et al., 2011; Vilà et al., 2011), ecosystem services (Pejchar & Mooney, 2009; Ehrenfeld, 2010; Vilà et al., 2011) and agricultural production (Mack et al., 2000; Pimentel, 2002). Post-border coordinated weed management programmes (i.e. programmes with objectives of either eradication or containment of new weed invasions) have targeted weeds that impact on both agricultural production (Panetta & Dodd, 1987; Eplee, 2001; Panetta & Lawes, 2007) and natural ecosystems (Gardener et al., 2010; Moore et al., 2011ab; Panetta et al., 2011; Rentería et al., 2012; Howell, 2012).
Considerable effort has been devoted to the question of whether and when it is best to target ‘satellite’ versus ‘core’ populations, following Moody and Mack's (1988) landmark paper on the spatial allocation of effort to manage plant invasions (see Epanchin-Neill and Hastings (2010) for an excellent summary). The relative merits of targeting the two types of population appear to depend upon their respective growth rates and strengths as sources of dispersal, as well as the costs associated with search and control (Epanchin-Neill & Hastings, 2010). However, two studies, which are the only ones to take damages resulting from invasions into account, indicate that control should be applied to both core and satellite (hereafter ‘outlier’) populations (Whittle et al., 2007; Blackwood et al., 2010).
While research has explored the rationale for controlling these different types of populations, no guidance exists on the best strategy. For example, it has been noted that eradication may have a role to play in containment, particularly in the management of outliers (Hulme, 2006), but it stands to reason that if a weed has previously proven to be a difficult target for eradication, this may not be favoured as a component of a containment strategy. Moreover, a significant proportion of the cost of eradication arises from the need to manage weed seed banks to exhaustion (Panetta, 2004, 2009a). The question of when eradication is a feasible component of a containment programme needs to be addressed.
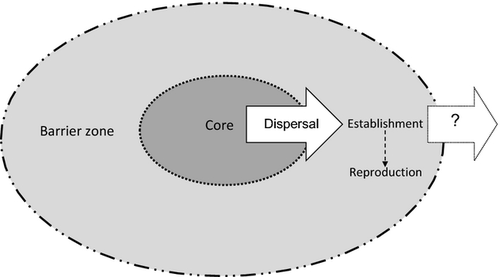
Similar issues need to be considered in relation to how core populations are managed. Where absolute containment is the management objective, spread is commonly regarded in terms of movement relative to a containment line and a barrier zone beyond this (Sharov & Liebhold, 1998; Harris et al., 2009; Panetta, 2012; Fig. 1). However, maintenance of barrier zones entails costs associated with repeated search and control activities to ensure that a weed does not spread beyond the zone. If a barrier zone is breached frequently, this approach to containment will represent wasted or, at least, inefficient investment.
Panetta and Cacho (2012) have argued that when a weed has a low feasibility of containment, the scope for reducing its rate of spread becomes critically dependent upon achieving substantial reductions of propagule production (i.e. fecundity control). They modelled feasibility of containment in terms of the area that needed to be searched to detect a weed, the effort required for detection within this area and the potential for a weed to establish beyond the search area, that is to escape. In this paper, we first use the basic equations from Panetta and Cacho (2012) for: (1) the search effort required to achieve a given detection probability, and (2) the probability of escape from the search area, to gain insights regarding the applicability of barrier zones in weed containment. We then apply the concept of eradication impedance (the combined effect of factors that may increase the difficulty of eradication; Panetta & Timmins, 2004) to provide guidance on when to attempt to eradicate outliers. Finally, we present a scheme of containment substrategies, provide a decision tree for substrategy selection and apply the approach to a broad range of case studies.
Materials and methods
Core and outlier populations
For all of the attention that has been paid to the topic of managing core versus outlier populations, there appear to be no accepted definitions for these population types. Moody and Mack (1988) simply assumed that the radii of outliers (in total) were much smaller than the radius of the core and did not specify a minimum distance from the core for an infestation to be regarded as an outlier. Lawes and Grice (2007) later highlighted the difficulty involved in assigning individuals to core or outlier populations, particularly where invasive plants form many small, patchy populations. While their definitions of core and outlier populations were based upon an analysis of spatial patterns of different size classes of Parkinsonia aculeata L., they recognized that their rules of assignment were essentially arbitrary.
In the present exercise, we consider an infestation to be an independent population if its gross area (area that must be searched for the target weed; Rejmánek & Pitcairn, 2002) does not overlap the gross area of another. The gross area of an infestation will be determined by the dispersal characteristics of the targeted weed and will correspond to a distance falling within a nominated percentile of the dispersal kernel (Westcott & Dennis, 2006; Hardesty et al., 2011).
Core population size can be expected to vary considerably, so the size of an outlier cannot readily be defined relative to the core. As an alternative, we consider that an outlier will remain so until it grows to the stage where its gross area overlaps with that of a core infestation, at which point it will become absorbed into the core. In an operational context, however, the distinction between core and outlier may be difficult to maintain in some cases. For example, an ‘outlier’ that is situated very far from a core infestation may be defined as a ‘core’ in its own right if it occurs in a different jurisdiction and requires separate management.
Modelling
Size and effectiveness of barrier zones
Panetta and Cacho (2012) developed a model that combines a dispersal kernel with the search model of Cacho et al. (2006) to identify the main factors that affect feasibility of containment. Briefly, the probability of detecting a target is defined as ZT = 1 − e−λsw, where λ is the detectability of the target (in m), s is search speed (m s−1) and w is the intensity of search (in s m−2). The detectability measure (λ) is based on the concept of effective sweep width, a search-theory term explained in Cacho et al. (2006). To represent dispersal, a Cauchy kernel was used for two reasons: it accounts for the presence of longer-distance dispersal events (Kot et al., 1996), and it is defined by a single parameter β (median dispersal distance), allowing a simple yet realistic representation of the general problem. The formula for the dispersal kernel is presented in equation 1 of Panetta & Cacho (2012). Below we extend their model to derive useful decision rules.
 (1)
(1) (2)
(2) (3)
(3)The parameters λ, s and β are determined by the features of the weed, the environment where it grows and the search strategy used (e.g. searching by air vs. searching on ground).
 (4)
(4)The analysis consists of testing the effects of detectability (λ) and median dispersal distance (β) in a full factorial design based on the solution of equations 3 and 4. The two decision variables, ZT (target probability of detection) and PT (target probability of capture) were set to desired values. This automatically determined the effort required (E) and the probability of escape (pe) for the given parameter values λ, β, s, h, and np (Table 1).
| Symbol | Definition |
|---|---|
| P T | Target probability of propagule capture within search area |
| Z T | Target probability of detection of established plant |
| β | Median dispersal distance |
| λ | Detectability (m) |
| s | Search speed (m s-1) |
| h | Habitat suitability (probability that a propagule landing on site will become established) |
| n p | Number of viable propagules produced per plant |
| E | Search effort (hours) |
To represent weeds having different dispersal modes and plant traits, values for β were taken from Vittoz and Engler (2007) (Table 2). We have previously argued that containment is most feasible where dispersal is mostly human mediated (Panetta & Cacho, 2012), because it is possible to regulate and thereby manage dispersal pathways involving humans and their agents. While the median dispersal distance for anthropochory (seed dispersal by humans; Vittoz & Engler, 2007) is very large (Table 2), we assume that effective management for this type of dispersal is in place; our analysis therefore relates to managing the residual risk arising through the contribution to spread made by other dispersal vectors within the weeds' ‘vector suites’ (Panetta & Cacho, 2012).
| Dispersal distance (m) | Dispersal mode | Species |
|---|---|---|
| 1 | Explosively dispersed | Jatropha gossypiifolia |
| 2 | Wind-dispersed, winged seeds (herbs) | |
| Ant-dispersed | ||
| Wind-dispersed, seeds with efficient plumes (forest) | ||
| Externally transported (small mammals) | ||
| 10 | Wind-dispersed, seeds with efficient plumes (openland) | |
| 40 | Wind-dispersed, winged seeds (trees) | Rhododendron ponticum |
| 400 | Internally transported (seeds eaten by birds and large vertebrates) | Cinnamomum camphora, Celtis sinensis, Ligustrum lucidum, L. sinensis, Miconia calvescens |
| Externally transported (large mammals) | ||
| 500 | Human-mediated dispersal | Bromus diandrus, Lolium rigidum, Orobanche ramosa, Parthenium hysterophorus |
Vittoz and Engler do not consider dispersal via water, owing to the potentially extreme variation in median dispersal distance for plants where this ‘dispersal syndrome’ (Cousens et al., 2008) is involved. We note that species that are predominantly water-dispersed may not, in general, be good candidates for the establishment of barrier zones, but qualify this with reference to the spatial distribution of potentially suitable habitat (see 4).
A simple rule for the application of barrier zones to the containment of weed invasions was generated on the basis of the effort required for single search operations targeting weeds in generic dispersal mode/plant type categories (Table 2).
Management of outliers
All weeds, including those with very short-lived propagules (both vegetative and sexual reproductive structures, hereafter referred to collectively as ‘propagules’ for the sake of simplicity), will require repeated search and control efforts to ensure eradication. The total effort required will be a function of both seed persistence and the potential for ‘reproductive escape’ (Panetta, 2004), that is, seed production that occurs in spite of management efforts. Reproductive escape will be a function of detectability (which is captured in our model), but also will depend upon the occurrence of reproductive events in the intervals between site visits. The latter will vary according to time to reproduction: for example, annuals that are capable of reproducing relatively quickly are more likely to produce seeds between visits than are perennials that have long juvenile phases. Note that when outliers are not eradicated, spread can still be stopped by preventing reproductive escape.
We used two parameters (seed persistence and time to reproduction) from the semi-quantitative scheme of Panetta and Timmins (2004) (Table 3) to assess the appropriateness of eradication as a strategy for managing outliers. The original scheme comprised four categories of factors (logistic, detectability, biological and control) that contribute to the difficulty (impedance) of weed eradication. Unweighted scores for each of the categories were summed to give an overall value for impedance (I). In this instance, the main interest was in the biological component of impedance (Ib), as for outliers the differences in effort (cost) between eradication and control are driven by whether or not an attempt is made to eliminate the seed bank. The ease by which seed banks can be exhausted will be determined directly by seed persistence (B3), but also indirectly by the time to reproduction (B2), which will set the minimum site visitation frequency required to prevent further inputs to the seed bank (Panetta, 2004). Coding for B3 is largely consistent with the categories of seed persistence proposed earlier by Thompson et al. (1998), namely transient (< 1 year), short-lived (1–5 years) and long-lived (> 5 years). The only differences are that Panetta & Timmins (2004) extended the upper bound of transient seed banks to 2 years and created an additional category for highly persistent (> 10 years) seeds. The only other biological parameter (ability to reproduce vegetatively; B1) from Panetta and Timmins was not used, because all propagule types are considered in our theoretical model.
| (B2) For species that reproduce by seeds or vegetative propagules, what is the minimum length of the pre-reproductive period? |
| < 1 month = 6 |
| 1–12 months = 4 |
| 1–2 years = 2 |
| > 2 years = 0 |
| (B3) What is the maximum longevity of seeds or vegetative propagules?a |
| > 10 years = 6 |
| 5–10 years = 4 |
| 2–5 years = 2 |
| < 2 years = 0 |
- a Default in the absence of information = 4 for seed-producing species; 0 for those producing vegetative propagules.
Model application
Fourteen weed species that represented different combinations of growth form, dispersal syndrome and habitat were scored for biological impedance (Ib; Table 4). These included three (Bassia scoparia, Orobanche ramosa and Parthenium hysterophorus) for which either success or failure of an eradication programme has been documented. Although values of median dispersal distance (β) and detectability (λ) are not available in the literature, β can be approximated based on the dispersal mode of the species (Table 2) and λ can be approximated based on general detectability estimates for given growth forms (Brown et al., 2004). We assumed detectabilities of 20 m for large trees, 10 m for shrubs and small trees, and 5 m for herbaceous perennials and annual plants. These are plausible values (see Brown et al., 2004; Cacho et al., 2006) that provided a basis for calculating the effort (E) required to maintain barrier zones in relation to propagule dispersal.
| Species | Growth form | Dispersal mode | β | λ | E (hr) | B2 | B3 | I b |
|---|---|---|---|---|---|---|---|---|
| Celtis sinensis | T | B | 400 | 20 | 130,278 | 0 | 0 | 0 |
| Cinnamomum camphora | T | B | 400 | 20 | 130,278 | 0 | 0 | 0 |
| Rhododendron ponticum | T | Wi | 100 | 10 | 16,285 | 0 | 0 | 0 |
| Tamarix ramosissima | T | Wi, Wa* | 40 | 10 | 2606 | 2 | 0 | 2 |
| Ligustrum lucidum | T | B | 400 | 5 | 521,113 | 2 | 0 | 2 |
| L. sinense | S | B | 400 | 5 | 521,113 | 2 | 0 | 2 |
| Jatropha gossypiifolia | S | A, E, Wa* | 5 | 10 | 41 | 2 | 2 | 4 |
| Bassia scoparia | A | Wi (tumble) | 5 | 15 | 27 | 4 | 2 | 6 |
| Bromus diandrus | A | H | 5 | 5 | 81 | 4 | 2 | 6 |
| Lolium rigidum | A | H | 5 | 5 | 81 | 4 | 2 | 6 |
| Miconia calvescens | T | B | 400 | 20 | 130,278 | 0 | 6 | 6 |
| Gymnocoronis spilanthoides | H | Wa | 400 | 5 | 521,113 | 4 | 6 | 10 |
| Parthenium hysterophorus | A | Wi, Wa* | 40 | 5 | 5211 | 6 | 4 | 10 |
| Orobanche ramosa | A | H | 5 | 5 | 81 | 6 | 6 | 12 |
 (5)
(5) (6)
(6)Bayesian simulation was used to estimate credible intervals around equation 5 (see Appendix S1 in Supporting Information). Unfortunately, inconsistent recording of infested area (in terms of net versus gross infested area; Rejmánek & Pitcairn, 2002) precluded the use of this factor as a predictor of programme outcome.
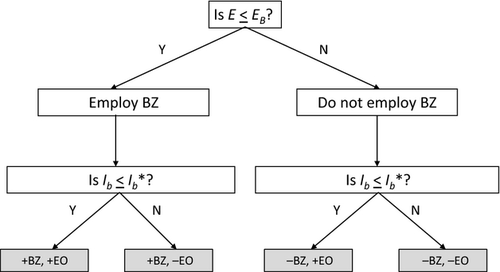
A decision tree (based on results from the dispersal model and the logistic regression) relating to the utilization of barrier zones and eradication of outliers was constructed and applied to the species listed in Table 4.
Results
Both median dispersal distance (β) and detectability (λ) have a strong influence on the search effort required for any given set of capture probability (PT) and detection probability (ZT) values. Detectability and median dispersal distance interacted strongly to greatly increase required search effort at values of 10 m or below for λ and at values of 40 m and above for β (Fig. 2). Comparing plants with median dispersal distances of 40 and 100 m (Table 2), the area needed to be searched when a barrier zone is utilized increases from 2037 to 12,730 ha respectively. This increase in area searched as β increases represents an increase of effort from 2606 to 16,285 h per year with detectability λ = 10 m, or from 5201 to 32,570 h per year when λ = 5 m. These values equate to between 1.4 and 17 people working full time 40 h a week, 48 weeks per year to maintain the barrier zone.
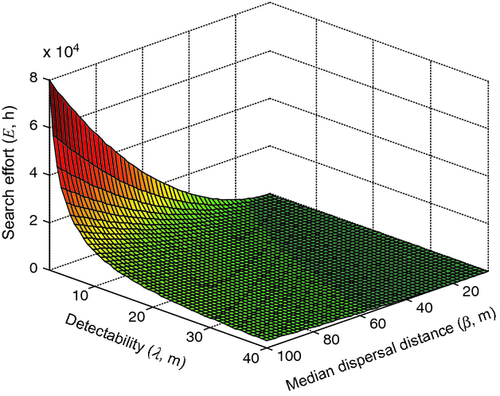
The gradients ΔE/Δβ (> 0) and ΔE/Δλ (< 0) become steeper at higher values of β and lower values of λ, the latter reflecting diminishing returns to search (Cacho et al., 2006).
Management thresholds may be derived in an operational sense by considering on-ground search effort. For any particular targeted species, the amount of search effort that can be allocated will depend, inter alia, upon the anticipated costs of damage should the weed escape containment: greater investments in search effort will be acceptable for highly damaging species (see 4).
When to use barrier zones?
We used E = EB, the amount of effort that can be supported by the available budget, as the decision point for this stage in the decision-making process, using a broad range of 14 weed species (Table 4) to illustrate how the value of search effort (EB) may be set when detectability (λ) and median dispersal distance (β) are known. The estimated effort required to maintain a barrier zone around a core infestation ranges from 27 h to over 5000 h (Table 4) depending on growth form and dispersal mode of the weed. These values translate to a range of between 0.01 and 271 full-time workers per year. There is a clear cut-off point between plants with E ≤ 81 h year−1 and those with E > 2606 h year−1. The rankings based on expected effort match closely with the rankings obtained using semi-quantitative impedance values (Table 4).
When to eradicate outliers?
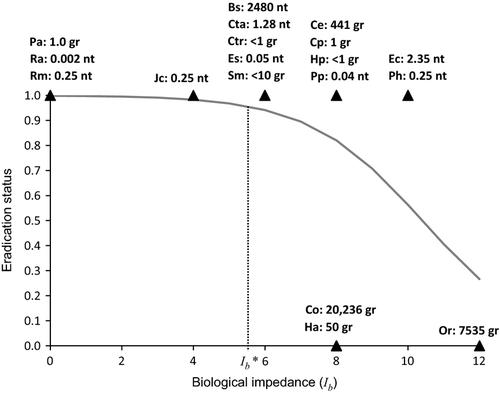
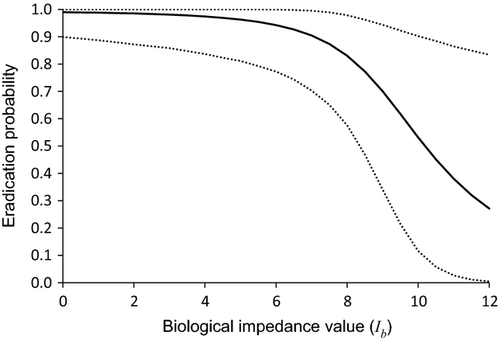
The case histories selected spanned the range (0–12) of biological impedance scores (Table 4). For illustration, the mid-range value (6) was employed as a threshold for Ib, with higher values indicating species for which eradication of outliers would generally not be a favoured option. While some eradication programmes targeting species with Ib values greater than this threshold were successful, infested areas were generally very small (Fig. 3). At present, there is limited empirical support for the use of this value (Fig. 3; see Table S1). While the estimate of the slope parameter (b1) in the logistic regression of probability versus biological impedance (Ib) was non-significant (P = 0.12), the resulting plot (see regression curve in Fig. 3) is consistent with theoretical expectations and provides a means of selecting cut-off points based on biological impedance but referring back to eradication probability. The dotted line in Fig. 3 illustrates how this could be done when the aim is to obtain an eradication probability of 0.95 – the Ib value corresponding to this probability is c. 5.7. The wide variation in eradication probability obtained through Bayesian simulation (Fig. 4) indicates that refinement of the cut-off value in the decision tree (Fig. 5) will require additional factors to be included in the regression.
Containment substrategies
Factorial combinations of management options for core and outlier populations yield four containment substrategies, depending on whether barrier zones are utilized to manage core infestations and eradication is attempted for outliers (Fig. 5). Examples of representative species for each substrategy are discussed in the following section.
Employ barrier zones and eradicate outliers
For selection of this substrategy, evidence is required that eradication feasibility is high, in particular that there is low biological impedance to eradication. The invasion of Western Australia by Bassia scoparia (L.) A.J.Scott constitutes the largest weed invasion ever to be eradicated in its entirety (Dodd, 2004; Panetta, 2009b). B. scoparia is an annual species that produces relatively short-lived seeds (Dodd, 2004), and as it is a ‘tumbleweed’, the establishment of physical barriers (i.e. erection of fences around infestations) prevented its spread.
Annual grass weeds of cropping in southern Australia, such as Lolium rigidum L. (Chauhan et al., 2006) and Bromus diandrus Roth (Kleemann & Gill, 2009), are characterized by relatively low seed persistence (< 3 years) and poor non-human-mediated dispersal. In fact, many agricultural weeds have evolved no specialized dispersal mechanisms (‘barochory’; Benvenuti, 2007), and their spread is thus highly dependent upon human-mediated dispersal.
Employ barrier zones and control outliers
Weeds in this subcategory are not easily eradicable and their spread occurs through short-distance dispersal or human-mediated dispersal. For example, Orobanche ramosa L. is an annual parasitic species that produces tiny, dust-like seeds and develops a highly persistent seed bank (Panetta et al., 2011). It has been considered previously to be highly containable (Panetta, 2012; Panetta & Cacho, 2012). A number of other agricultural weeds having long-lived seeds and predominantly human-mediated dispersal would also belong to this subcategory.
Do not employ barrier zones but eradicate outliers
For these weeds, eradication feasibility is high and long-distance dispersal (LDD) is both prominent and largely non-human-mediated. Examples can be found among woody growth forms, where species often have short-lived seeds and are bird-dispersed. Some (for example Celtis sinensis Pers. and Cinnamomum camphora (L.) Presl) combine long juvenile periods (> 3 years in both cases; Panetta, pers. obs.) with short-lived seeds (< 2 years in both cases; Panetta, 2001). While reaching reproductive maturity more quickly, other bird-dispersed shrubs and small trees (for example Ligustrum sinense Lour. and L. lucidum W.T.Ait.) have relatively transient seed banks (< 5% of seeds persisting for 12 months for both Ligustrum spp.; Panetta, 2000). All of these species are serious invaders of natural ecosystems (Cronk & Fuller, 1995; Csurhes & Edwards, 1998).
Miconia calvescens D.C. is a tree weed that has a juvenile phase lasting c. 4 years (Meyer, 1998). It is highly fecund, producing bird-dispersed seeds that can persist for > 15 years (J.-Y. Meyer, pers. comm.). Overall, M. calvescens has been categorized as having a low feasibility of containment (Panetta & Cacho, 2012). It poses a considerable threat to rainforest environments throughout wet tropical regions and is currently targeted by an eradication programme in northern Queensland (Hester et al., 2010).
Do not employ barrier zones but control outliers
These weeds are not easily eradicable and exhibit relatively high levels of LDD, effected largely through non-human-mediated means. Gymnocoronis spilanthoides (D.Don) DC is an emergent aquatic weed that is considered to be an established or newly invading serious weed in most of its introduced range (Panetta, 2009b). It has very long-lived seeds: predicted times to 1% viability were 16 and 3.8 years for buried and surface-situated seed respectively (Panetta, 2009b). However, for this species spread via seed dispersal may be less important than that achieved through vegetative fragmentation; seeds are not pappus-bearing and are not adapted for dispersal by water. Spread via fragmentation occurs when any part of a stem that has a node breaks away from a parent plant and is moved via water.
Difficult to categorize
Some weeds are containable under most circumstances, but significant episodes of LDD are triggered by major floods or storms. Parthenium hysterophorus (L.) King and Robinson is a rapidly-maturing annual, capable of producing seeds as rapidly as four weeks post germination (Trounce & Gray, 2004). Seed persistence may be high, especially when seeds achieve burial (Navie et al., 1998b). For both of these reasons, P. hysterophorus would appear not to be easily eradicable, although very small infestations have been eradicated on occasion (Anon., 2003). P. hysterophorus was previously categorized by Panetta and Cacho (2012) as having ‘medium’ containment feasibility; while its spread is largely dependent upon human-mediated dispersal, seeds of P. hysterophorus are dispersed over very wide areas in Australia during extreme flood events. Its ability to attain high densities in Australian and other grasslands is well-documented (Navie et al., 1998a; Fensham, 1999).
Jatropha gossypiifolia Linn. is a shrub that is dispersed both ballistically and by ants, but has undergone significant extensions in distribution following major rainfall events (Bebawi et al., 2009). Seeds persist for < 6 years under field conditions (Bebawi et al., 2012). Invasion by J. gossypiifolia results in a loss of biodiversity and wildlife habitat, altered fire regimes, increased soil erosion and destabilization of banks of watercourses (Bebawi et al., 2009). Tamarix ramossisima Ledeb. is a long-lived tree that produces very short-lived seeds, dispersed primarily by wind but also by water (DiTomaso, 1998; Pearce & Smith, 2003). Significant episodes of spread are again associated with flooding, and its invasion of riparian ecosystems of the United States has been reported to be ‘ecologically disastrous’ (Lindgren et al., 2010). Rhododendron ponticum L. is a small tree that combines a very long juvenile phase (> 10 years) with wind-dispersed, short-lived seeds that may be dispersed to long distances by large storms (Harris et al., 2009). It is a significant weed of woodland and other natural or semi-natural habitats in Europe (Cronk & Fuller, 1995).
Discussion
A designated barrier zone (Fig. 1) is an area that must be subjected to repeated search-and-control operations, and must be sufficiently large to encompass most dispersal from the core infestation. The required search effort in this zone will be determined by the detectability of the weed, search speed and the coverage of the search needed to obtain an acceptable level of detection (Cacho et al., 2006). Targeted weeds will vary in terms of both detectability and cost of control. All activities will incur ongoing management costs related to barrier zone area. These may be justifiable only where significant effective dispersal (i.e. dispersal leading to recruitment) does not occur beyond barrier zone boundaries. In the latter situation, a greater investment in fecundity control may be called for (Panetta & Cacho, 2012), combined with enhanced investment in passive (unstructured) surveillance (Cacho et al., 2010).
Our analysis indicates that barrier zones should not contribute to strategies targeting tree weeds that are predominantly wind dispersed, or any species that are dispersed by birds or larger wild vertebrates (with median dispersal distances of c. 40 and 500 m respectively; Table 2), particularly when the detectability of young adults is low within the invaded environment. As exemplified by the weed case histories above, these categories include a number of weeds that have major impacts upon natural ecosystems. It should be noted, however, that any threshold marking the abandonment of the barrier zone approach will depend on the combined cost of surveillance and treatment relative to the available budget. This cut-off may differ between regions or countries, depending on the cost of labour, which is the main input required in surveillance and an important component of treatment cost.
The notion of a cut-off with respect to biological impedance (Ib) and its application to the management of outliers both require further consideration. It stands to reason that, given a sufficiently small infestation, eradication would be feasible whatever the value of Ib (see Fig. 3). In practice, it may be tempting to attempt to eradicate smaller outliers, even though this is counter indicated. We suspect that it would be more expedient to target all outliers of a species similarly, rather than to introduce another decision point, with another cut-off (i.e. for infestation size).
Given the myriad reasons for failure of a weed eradication programme (Panetta, 2009a), one could expect some programmes targeting species with low Ib to fail. For Department of Conservation eradication programmes targeting 90 environmental weeds in New Zealand, Howell (2012) found that the strongest determinant of progress towards eradication was the identity of the administrative area, for reasons that could not be established. All four of the successful programmes had net infestation areas of < 1 ha, but Howell noted that many programmes of a comparable size were not successful. Clearly, more case histories are required, but further data may not accumulate quickly, as many years are required to gain reasonably certain outcomes in weed eradication programs, and a lack of proper assessment/documentation (especially of failed efforts) is still common.
The cost of escape
Our framework is a first-pass decision support tool that does not take into account the costs and benefits of the various management strategies. However, damages will be implicit in the budget (EB in Fig. 5), as higher budgets should be related to higher damage. Rigorous application of a cost/benefit approach to the problem is beyond the scope of the present exercise, but an economic approach should focus on minimising the consequences (i.e. costs) of making the wrong decision (Regan et al., 2006). The damage caused by a weed that escapes a barrier zone depends on the types of environments that are invaded and the activities or industries that are affected. The rate of spread determines how fast these damages increase over time. If the potential damage trajectory through time is known, it is possible to estimate the cost of weed escape in present-value terms (Cacho et al., 2008). Let this cost of escape be denoted by Ce, the expected damage is then given by Cepe, where pe is the probability of escape as defined in equation 4.
The cost of maintaining the barrier zone is related to the numbers of surveillance hours (E in equation 3) required for the given target performance of probabilities of propagule capture (PT) and detection (ZT). The annual cost can be approximated by multiplying the dollar rate per hour of surveillance. Let this cost of surveillance (in present-value terms) be denoted by CS, the cost of the barrier zone is then given by CSE.
 (7)
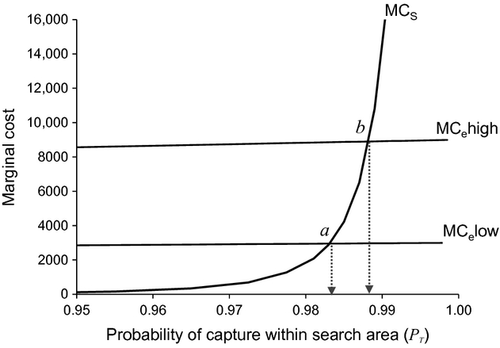
(7)An application of equation 6 is shown in Fig. 6. In this example, tripling the cost of escape from 3000 in point a to 9000 in point b resulted in an increase of 0.005 in the optimal value of PT. This low sensitivity suggests that a rough idea of the cost of escape is good enough to set the value of PT, which corresponds to the percentile of the dispersal kernel that we aim to capture.
Conclusions
While much attention has been paid to the relative merits of targeting outlier versus core populations when the overall objective is to slow spread, little guidance exists on how to manage these different population types. The approach that we have adopted is particularly suited to situations where the optimal strategy is to target outlier and core populations simultaneously (Whittle et al., 2007; Blackwood et al., 2010), but the basic principles remain applicable in situations where the two infestation types are targeted either singly or sequentially. Even in situations where neither the establishment of barrier zones nor outlier eradication is recommended, a weed may still be containable, given a combination of effective fecundity control and surveillance.
Semi-quantitative models can be very powerful tools, as long as key parameters are identified and are well-coded (Kahneman, 2011, p. 226). In many circumstances, predictions arising from such ‘improper linear models’ have proven superior to those made on the basis of expert opinion (Dawes, 1979). Moreover, equal weighting of parameters (as we have used for scoring the biological component of eradication impedance) has been shown to be very robust for making such predictions (Dana & Dawes, 2004). Parameterization of theoretical models is critically important, yet often difficult to achieve (Doak et al., 2005; Jeltsch et al., 2008). Further research on detectability (see Moore et al., 2011a,2011b) would assist greatly in parameterizing our mathematical model. That said, we have again (see Leung et al., 2012) shown that semi-quantitative models can be used to advantage with their theoretical counterparts in support of decision-making.
Acknowledgements
We thank Mark Gardener for supplying previously unpublished values for Ib parameters for some of the examples presented in Table S1. Comments made by Tony Pople, S. Raghu, Andy Sheppard and John Wilson helped to improve the paper. A number of anonymous reviewers helped along the way. OC was a recipient of funding from the Australian Centre of Excellence for Risk Analysis. FDP thanks Biosecurity Queensland for support when this work was commenced.
References
Biosketches
F. Dane Panetta is a weed ecologist who has a special interest in the coordinated management of weed invasions.
Oscar J. Cacho is an environmental economist whose research interests include the application of bioeconomics to invasive species, management of renewable resources and climate policy.
Author contributions: F.D.P and O.J.C conceived the ideas; O.J.C developed the theoretical model; F.D.P and O.J.C jointly wrote the paper.


