Streptolysin-induced endoplasmic reticulum stress promotes group A Streptococcal host-associated biofilm formation and necrotising fasciitis
Abstract
Group A Streptococcus (GAS) is a human pathogen that causes infections ranging from mild to fulminant and life-threatening. Biofilms have been implicated in acute GAS soft-tissue infections such as necrotising fasciitis (NF). However, most in vitro models used to study GAS biofilms have been designed to mimic chronic infections and insufficiently recapitulate in vivo conditions along with the host–pathogen interactions that might influence biofilm formation. Here, we establish and characterise an in vitro model of GAS biofilm development on mammalian cells that simulates microcolony formation observed in a mouse model of human NF. We show that on mammalian cells, GAS forms dense aggregates that display hallmark biofilm characteristics including a 3D architecture and enhanced tolerance to antibiotics. In contrast to abiotic-grown biofilms, host-associated biofilms require the expression of secreted GAS streptolysins O and S (SLO, SLS) that induce endoplasmic reticulum (ER) stress in the host. In an in vivo mouse model, the streptolysin null mutant is attenuated in both microcolony formation and bacterial spread, but pretreatment of soft-tissue with an ER stressor restores the ability of the mutant to form wild-type-like microcolonies that disseminate throughout the soft tissue. Taken together, we have identified a new role of streptolysin-driven ER stress in GAS biofilm formation and NF disease progression.
1 INTRODUCTION
Group A Streptococcus (GAS) causes infections ranging from superficial and self-limiting, such as impetigo and pharyngitis, to life-threatening and highly invasive diseases such as streptococcal toxic shock syndrome and necrotising fasciitis (NF; Carapetis, Steer, Mulholland, & Weber, 2005; Sims Sanyahumbi, Colquhoun, Wyber, & Carapetis, 2016). In NF, the infection usually starts as a superficial skin lesion and is rapidly followed by massive bacterial accumulation in the form of dense aggregates that spread along the fascial planes (Olsen & Musser, 2010). The dissemination of GAS into soft tissue causes severe damage that often results in the mortality of the patient despite prompt medical intervention (Olsen & Musser, 2010).
Biofilm formation is one of many pathogenic strategies that bacteria employ for disease progression and persistence in hosts (Fiedler, Köller, & Kreikemeyer, 2015). Bacterial biofilms are densely packed microbial communities, encased in a self-produced matrix, that are often recalcitrant to antibiotic or immune clearance (Costerton et al., 1987). The presence of GAS communities embedded in a glycocalyx in a murine model of impetigo (Akiyama, Morizane, Yamasaki, Oono, & Iwatsuki, 2003) and in a zebrafish model of myositis (Cho & Caparon, 2005) suggests that GAS forms tissue-associated microcolonies during the course of infection. Furthermore, 3D GAS biofilm-like structures were observed in a chinchilla middle ear model of human otitis media by scanning electron microscopy (SEM; Roberts, Connolly, Doern, Holder, & Reid, 2010). Antibiotic treatment failure against susceptible clinical GAS isolates has been attributed to biofilm formation, given the increased tolerance of biofilm bacteria to antibiotics (Baldassarri et al., 2006; Conley et al., 2003). Indeed, dense clusters of GAS microcolonies have been observed within the soft tissue of NF patients (Hidalgo-Grass et al., 2004) and GAS isolated from human necrotising soft tissue infections appeared as multilayered fibrous biofilms that persisted despite prolonged antibiotic therapy (Siemens et al., 2016). However, despite evidence of biofilm-like communities during GAS infection, most research on the contribution of biofilms to the pathogenesis of GAS disease has been performed in vitro, where infection-associated environments are not fully recapitulated (Wilkening & Federle, 2017).
In the current study, we developed an in vitro model of GAS biofilm formation on mammalian cells to study acute, biofilm-associated infection. We demonstrate that, when cultured on mammalian cells but not on abiotic surfaces, the expression of streptolysin O or S (SLO or SLS) elicits endoplasmic reticulum (ER) stress in the host cells, which promotes host-associated GAS biofilms. We have shown that GAS infection induces ER stress in mouse embryonic fibroblasts (MEFs) that in turn activates the unfolded protein response (UPR) causing the release of a mammalian factor that supports host-associated biofilm formation. Furthermore, using a mouse model of human NF, we show that the streptolysin null mutant is significantly diminished in its ability to form biofilm-like microcolonies and to spread within soft tissue when compared with the wild-type (WT) strain. Most importantly, pretreatment of mice with thapsigargin (TG), a pharmacological inducer of ER stress, restored the ability of the streptolysin null mutant to form microcolonies and spread in the soft tissue, underscoring the essential role of streptolysin-mediated ER stress in biofilm formation during acute GAS biofilm-associated infections.
2 RESULTS
2.1 GAS forms biofilms on mammalian cells
To examine the potential host–pathogen interactions involved in GAS biofilm establishment during acute infection, we infected MEFs with GAS at a multiplicity of infection (MOI) of 10, using the clinical strain JS95 (M14 serotype; Hidalgo-Grass et al., 2004). We monitored GAS biofilm biomass accumulation over time by quantifying the biomass using a crystal violet (CV) staining protocol that distinguishes bacteria from mammalian cells (Negri et al., 2010; Figure 1a) and by enumerating colony forming units (CFUs; Figure 1b). Both assays revealed a significant increase in GAS biomass accumulation from 24 to 72 hr postinfection (hpi) and a steady decrease thereafter (Figures 1a,b). To ascertain whether GAS JS95 biomass accumulation represents a common trait during GAS–host interaction, we tested MEFs, human foreskin fibroblasts (HFFs) and human keratinocytes (HaCaTs) as well as GAS strains of other M-types for their ability to form cell-associated biofilms. Both HFFs and HaCaTs supported GAS biomass formation albeit with different kinetics than observed for MEFs (Figure 1c). Furthermore, both GAS MGAS5005 and JRS4 strains, of M1T1 and M6 serotypes, respectively, were able to form biofilms on MEFs (Figure 1d). Thus, the ability of GAS strain JS95 to accumulate biomass on top of mammalian cells may represent a general phenomenon in GAS–host interaction, although the biofilm formation kinetics is different among strains.

To examine the biofilm properties of mammalian cell-associated GAS, we first immunostained GAS infected MEFs with antibodies specific to GAS and imaged them by confocal laser scanning microscopy (CLSM) to study their spatial and temporal organisational dynamics (Figure 2a). GAS biofilm biomass on MEFs increased progressively between 24 and 72 hpi and decreased thereafter (Figure 2a), consistent with the biomass levels detected by CV staining and CFU enumeration (Figures 1a,b). Moreover, GAS biomass growing on MEFs at 72 hpi displayed a 3D architecture indicative of mature biofilms (Figures 2a and S1C,E; Monds, 2009), similar in appearance to GAS microcolony structures observed in pustule skin lesions from impetigo patients and in a mouse model of superficial human GAS skin infections (Akiyama et al., 2003). In addition, SEM revealed that GAS biofilms on MEFs appear in chains within thick and multilayered aggregates (Figure 2b), similar to previous reports of GAS biofilms in vivo (Roberts et al., 2010; Siemens et al., 2016). Although JS95 is capable of forming biofilm on polystyrene tissue culture plates (referred hereafter as plastic), biofilms on this abiotic substratum accumulate less biomass compared with biofilms on MEFs, display different developmental kinetics, and have a 3D architecture distinct from MEF-associated biofilms (Figs. S1A, B, C, D, E). Additionally, SEM images of abiotic-grown biofilms show reduced aggregation (Figs. S1F) compared with their MEF-grown counterparts (Figure 2b).
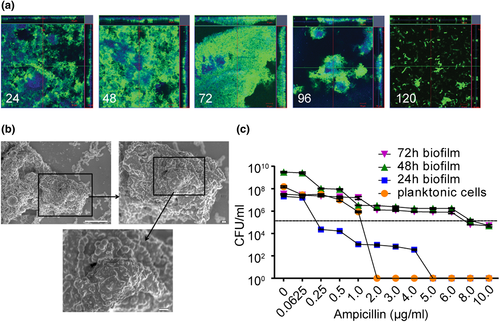
We next tested whether GAS growing on MEFs exhibited increased tolerance to antibiotics, a characteristic of biofilms (Baldassarri et al., 2006; Stewart & Costerton, 2001). We exposed preformed GAS biofilms growing on MEFs, or planktonic bacteria (both seeded with an initial inoculum of 1 × 10⁵ CFU), to increasing concentrations of ampicillin and enumerated CFU after 24 hr of antibiotic exposure. GAS biofilms were significantly more tolerant to ampicillin compared with planktonic cells (Figure 2c). Taken together, these observations show that GAS forms dense host-associated biofilms during acute infection that may contribute to disease progression by enhanced tolerance towards antibiotic treatment.
2.2 GAS streptolysin expression promotes biofilm formation on host cells
To identify GAS determinants important for biofilm formation on host cells, we examined the ability of isogenic mutants of JS95 WT to form biofilms on MEFs. The mutants chosen are defective in the expression of GAS virulence factors (Hynes & Sloan, 2016; Olsen & Musser, 2010; Walker et al., 2014), some of which have also been implicated in GAS biofilm formation (Fiedler et al., 2015; Young, Holder, Dubois, & Reid, 2016). We observed that deletion of emm14 encoding the M14 antiphagocytic surface protein and inactivation of the cysteine protease speB enhanced biofilm formation on MEFs (Figure S2A). This is consistent with previous studies where speB was shown to be associated with increased biofilm dispersal (Connolly, Braden, Holder, & Reid, 2011; Roberts et al., 2010). By contrast, inactivation of hasA, essential for hyaluronic acid capsule production, decreased biofilm formation significantly (Figure S2A). In addition, a strain lacking the expression of both SLO and SLS (Δslo,sagI−) was the most highly attenuated mutant for biofilm formation on MEFs (Figure S2A). To explore whether attenuated biofilm formation in the streptolysin and hasA mutants was related, we assessed streptolysin expression in a hasA− mutant background by reverse transcription polymerase chain reaction. We observed that sagA, sagB, and slo were all expressed approximately 75% less in the hasA− strain compared with WT background (Figure S2B). Thus, it is possible that a decrease in streptolysin activity in the hasA mutant is indirectly responsible for its attenuation in biofilm biomass. Because of this marked defect of the streptolysin-null strain, we focused the remainder of our study on the role of SLO and SLS in host-associated biofilm formation.
We next compared biofilm formation by JS95 (WT) and the streptolysin null mutant (Δslo,sagI−) over time on MEFs versus plastic. The amount of biomass produced on MEFs by WT biofilms was significantly higher than that produced by Δslo,sagI− biofilms at all the time points examined (Figure 3a). By contrast, on plastic, Δslo,sagI− produced significantly more biomass at 48 and 72 hpi compared with WT (Figure 3a). To ensure that both strains exhibit similar rates of growth in their planktonic state, we also enumerated CFU of WT and Δslo,sagI− in the culture supernatants (nonbiofilm fraction) while growing on MEFs and observed no defect in planktonic growth (Figure S2C). To test whether GAS internalisation is responsible for reduced biofilm biomass of the double mutant, we quantified the internalisation of WT and Δslo,sagI− bacteria every 2 hpi. In contrast to studies of an slo deletion mutant in GAS strain 188 (a derivative of the M type 3 WT strain 95077; Hakansson, Bentley, Shakhnovic, & Wessels, 2005) that displayed enhanced internalisation into keratinocyte lysosomes, we observed that internalisation of the double mutant into MEFs is abrogated as compared with WT JS95, and we conclude that reduced extracellular biofilm formation by the streptolysin null strain is not correlated with increased internalisation (Figure S3).
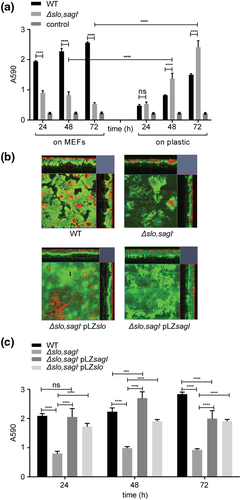
To gain more spatial insight into GAS biofilms on MEFs, we next examined the architecture of biofilms formed by WT, Δslo,sagI−, or Δslo,sagI− harbouring plasmids complementing either slo or sagI. CLSM revealed that while WT GAS aggregation on MEFs was dense, Δslo,sagI− displayed sparse aggregates on MEFs (Figure 3b). However, the corresponding complemented mutants expressing either SLO or SLS developed biofilm biomass similar to that of the WT, demonstrating that either SLO or SLS is sufficient to complement Δslo,sagI− for biofilm formation (Figures 3b,c), indicating their redundant role in host-associated biofilms.
To determine whether the role of streptolysins in biofilm formation was strain or serotype-specific, we also examined streptolysin mutants in two additional GAS strains, M1 854 (Pinho-Ribeiro et al., 2018) and MGAS5005 (Baruch et al., 2014) of the M1 and M1T1 serotypes, respectively, that commonly cause acute infections. For both genetic backgrounds, we observed a significant decrease in biofilm biomass in the absence of the streptolysins, consistent with our previous observations in the M14 JS95 strain, and suggesting that our findings are not limited to the relatively rare M14 serotype (Figure S4).
2.3 Streptolysin-induced ER stress contributes to GAS biofilm formation on host cells
SLO and SLS are well-characterised cytotoxins secreted by GAS (Goldmann, Sastalla, Wos-Oxley, Rohde, & Medina, 2009). Lactate dehydrogenase (LDH) release into the culture media as a measure of streptolysin-mediated cytotoxicity revealed progressive cell death of WT-infected MEFs starting at 4 hpi. By 10 hpi, greater than 90% cell cytotoxicity was observed (Figure S5). By contrast, the Δslo,sagI− mutant caused only 30% cytotoxicity in MEFs at the same time point (Figure S5). Consistent with this, we observed that WT-infected MEFs displayed markers of apoptosis as early as 6 hpi and necrosis by 8 hpi (Figure S6). By contrast, neither apoptosis nor necrosis occurred in MEFs infected with Δslo,sagI− during the initial 12 hr of infection (Figure S6), indicating that these early cellular events influence later outcomes of biofilm formation. MEFs infected with the double mutant eventually undergo apoptosis at 24 hpi; however, this arises as a result of media acidification as a consequence of GAS proliferation and metabolism (data not shown).
GAS streptolysins SLO and SLS were earlier shown to cause ER stress in host cells leading to the release of asparagine (ASN) into the culture media, which GAS JS95 can sense and use to regulate its gene expression and rate of proliferation (Baruch et al., 2014). Because SLO or SLS contribute to biofilm formation, we hypothesised that streptolysin-mediated ER stress, which eventually leads to apoptosis (Li, Lee, & Lee, 2006), could similarly be involved in host cell-associated biofilm formation.
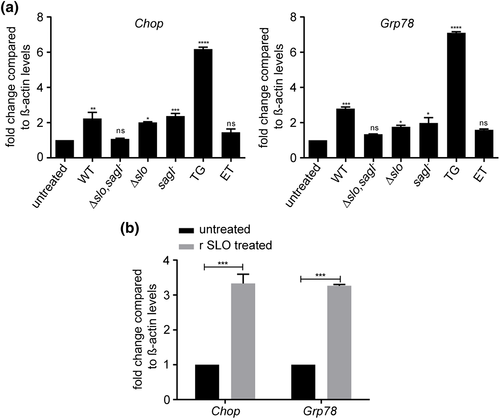
To test if ER stress is induced in GAS host-associated biofilms, we performed gene expression analysis of the ER stress markers Chop and Grp78 (Oslowski & Urano, 2011; Senft & Ronai, 2015; Zhang & Kaufman, 2008) in MEFs infected either with GAS or treated with the pharmacological ER stressor TG as a positive control (Shiraishi, Okamoto, Yoshimura, & Yoshida, 2006) or etoposide (ET), a DNA topoisomerase inhibitor that causes ER stress-independent apoptosis as a negative control (Jamil, Lam, Majd, Tsai, & Duronio, 2015). We observed more than a 2.5-fold increase in both Chop and Grp78 expression upon infection with WT GAS or single mutants Δslo or sagI− (Figure 4a). However, Chop and Grp78 expression in MEFs infected with the streptolysin null mutant Δslo,sagI− were not statistically different from untreated control cells, suggesting a redundant role of the two streptolysins in ER stress induction (Figure 4a). Furthermore, treatment of MEFs with purified recombinant SLO (r SLO) for 12 hr was sufficient to induce Chop and Grp78 (Figure 4b).
2.4 An ER stress-induced host-associated factor(s) contributes to GAS biofilm formation on host cells
GAS streptolysins SLO and SLS cause ER stress in host cells leading to the release of ASN into the culture media, which GAS JS95 can sense and use to regulate its gene expression and rate of proliferation (Baruch, Hertzog, et al., 2014). To determine if ER stress induction resulted in the release of a biofilm-promoting factor that could restore biofilm formation to the attenuated Δslo,sagI− strain, we supplemented the double mutant with cell-free conditioned media (CM) from MEFs infected with GAS WT and streptolysin single and double mutants and assayed for biofilm formation. We observed a significant recovery in MEF-associated biofilm in the presence of CM obtained from MEFs infected with the WT and Δslo and sagI−strains but not the Δslo,sagI− double mutant whereas CM obtained from untreated MEFs did not affect biofilm formation (Figure 5a). CM from r SLO treated MEFs was sufficient to restore biofilm formation to the double mutant strain (Figure 5b).
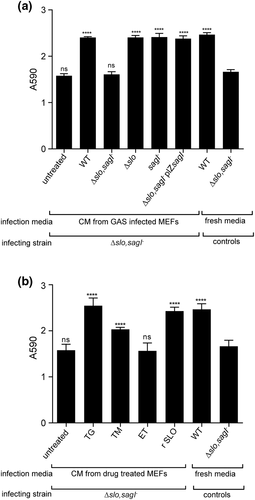
To examine if apoptosis of MEFs per se was responsible for promoting MEF-associated biofilm formation, we treated MEFs with TG (which induces ER stress-dependent apoptosis) and ET (which induces ER stress-independent apoptosis; R. Kim, Emi, & Tanabe, 2005) and tested if drug-treated CM were sufficient to restore biofilm formation to Δslo,sagI− biofilms. CM of TG-treated MEFs, but not of ET-treated MEFs, promoted biofilm formation (Figure 5b), suggesting that ER-stress in particular, and not apoptosis in general, leads to the release of a host-associated biofilm promoting factor or factors that aids biofilm formation.
TG is a specific inhibitor of the ER lumen-associated SERCA pump that causes ER stress by Ca2+ dysregulation (Szegezdi, Logue, Gorman, & Samali, 2006). To confirm a role for ER stress in biofilm formation, we also tested tunicamycin, which induces ER stress by inhibiting protein glycosylation (Szegezdi et al., 2006). We observed that tunicamycin treatment, similar to TG treatment, generated a CM that could restore biofilm formation to the Δslo,sagI− strain (Figure 5b). To further demonstrate the role of ER stress in biofilm formation, we pretreated MEFs 2 hr prior to GAS infection with the chemical chaperone 4-phenyl butyric acid (4-PBA) that protects cells from ER stress (H. J. Kim et al., 2013; Wiley et al., 2010). Under our assay conditions, 4-PBA pretreatment resulted in a delay in MEF cell death (Figure S7A). At 6 hpi, we observed fewer dead MEFs after pretreatment with 4-PBA compared with untreated cells. However, by 24 hpi, all MEFs were dead, indicating that early ER stress inhibition can delay MEF cell death but not abolish it. Nonetheless, we observed that GAS biofilms were modestly yet significantly reduced in biomass with 4-PBA pretreatment, suggesting that early ER stress inhibition may translate to lower biomass accumulation at 24 hpi (Figure S7B).
Because ASN is released by host cells upon induction of ER stress by SLO and SLS resulting in enhanced GAS proliferation (Baruch, Belotserkovsky, et al., 2014), we tested whether ASN is involved in MEF-associated biofilm formation. However, addition of increasing concentrations of ASN did not restore Δslo,sagI− biofilm formation, indicating that under these assay conditions ASN is insufficient for complementation and that other host factors may be involved (Figure S8).
2.5 Streptolysin-mediated ER stress promotes GAS microcolony formation and spread in vivo
To assess the contribution of streptolysin-mediated ER stress in GAS microcolony and/or biofilm formation in vivo, we used a mouse model mimicking human GAS NF (Ashbaugh, Warren, Carey, & Wessels, 1998; Hidalgo-Grass, Dan-Goor, et al., 2004). We injected GAS subcutaneously and assessed bacterial burden and spread across the infected soft tissue at 12 hpi. Infection with WT resulted in high titre infection of more than 1 × 10¹⁰ CFU/g in the soft tissue (Figure 6a). To obtain high-resolution imaging of the bacteria and surrounding host tissue, we serially sectioned infected tissue biopsies, performed immunostaining, and visualised the stained sections by CLSM across the transverse anatomical plane. In WT-infected mice, GAS microcolonies were concentrated predominantly in the fascia (Figures 6b and S10A). By contrast, in tissues from mice infected with Δslo,sagI−, we recovered significantly fewer CFU and most commonly observed only sporadic bacteria in the fascia (Figures 6a,b). However, more extensive examination of multiple sections across the Δslo,sagI− infected tissue revealed the presence of fascial microcolonies in only a few discrete regions of the tissue biopsy, whereas most other sections were entirely devoid of microcolonies (Figures 6c and S9A). This suggested that the streptolysin null mutant was unable to spread throughout the infected soft tissue and instead displayed localised aggregation. To quantify the lateral spread of microcolonies across the tissue, we measured the mean fluorescence intensity (MFI) from immunostained microcolonies in evenly spaced sections across the biopsied tissue from five mice. In contrast to WT-infected tissue in which GAS was evenly spread across the examined tissue, Δslo,sagI− remained localised and did not spread (Figures 6d,e, S9A, and S10A).
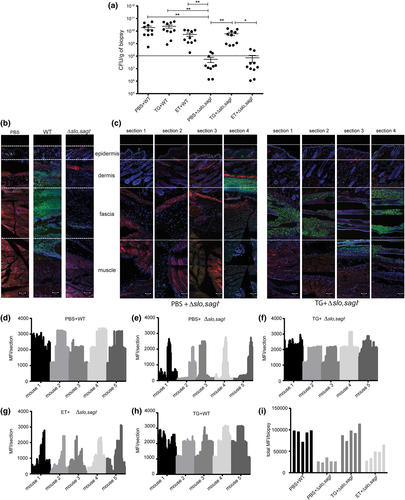
Next, to address whether SLO- and SLS-induced ER stress contributes to microcolony formation in the host, we tested whether preinduction of ER stress in the infection site using TG promoted microcolony formation in soft tissue in vivo. Subcutaneous injection with TG administered 12 hr prior to inoculation with Δslo,sagI− resulted in a ~100-fold increase in the number of viable bacteria recovered 12 hpi (Figure 6a) and restored the ability of Δslo,sagI− to form microcolonies that could now disseminate laterally across the fascia (Figures 6c,f and S9B). Pretreatment with TG did not significantly alter the lateral or transverse distribution of WT GAS microcolonies (Figures 6h and S10B). However, pretreatment with TG increased the depth of microcolony spread across the transverse plane, from the fascia into the deep muscle region for Δslo,sagI− (Figures 7a and S9B). Pretreatment of mice with ET did not affect CFU recovered from the soft tissue of WT or Δslo,sagI− infected mice, compared with the recovery of those strains from phosphate-buffered saline (PBS)-pretreated mice (Figure 6a). In ET-pretreated mice, WT microcolonies and only few Δslo,sagI− microcolonies were visible in the fascia and upper muscle region, respectively, and ET did not promote lateral spread of Δslo,sagI− microcolonies (Figure 6g), although compared with the PBS-pretreated sections, there are more Δslo,sagI− microcolonies present in the fascia (Figure 7a). ET (an apoptosis inducer) also causes host-tissue damage prior to GAS infection that may facilitate better GAS spread compared with PBS treatment alone. However, ET-associated spread is not as significant as when TG is preadministered (Figures 6f,g and 7a). Moreover, the total MFI / biopsy values as a combined measure of bacterial load across the entire lateral fascial span of each tissue biopsy showed that the WT-infected tissue had significantly greater bacterial load compared with streptolysin null-infected tissue. Upon TG, but not ET, pretreatment, we observed restoration of mutant-infected tissue MFI values to WT levels (Figure 6i).
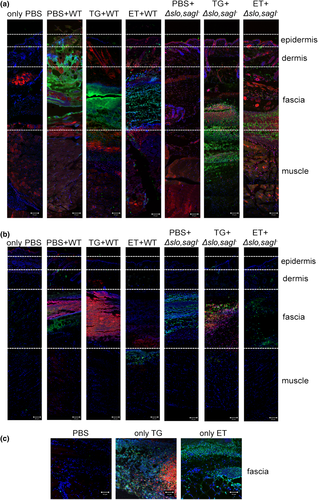
Finally, to confirm that both GAS- and TG-induced ER stress followed by apoptosis were associated with infection in vivo, we stained adjacent tissue sections for bacteria and for markers of ER stress and apoptosis. Using antibodies against the ER stress marker protein CHOP (Li et al., 2006) or by performing TUNEL staining (Mockel et al., 2012), we observed that GAS, ER stress, and apoptosis predominated in the fascia in WT-infected mice (Figures 7a,b). In mice infected with Δslo,sagI−, we only detected apoptotic cells in the fascial tissue, with no sign of ER stress (Figure 7b). Pretreatment of mice with TG, followed by injection with WT GAS intensified the ER stress staining, which partially masked the few apoptotic cells present underneath (Figure 7b). Pretreatment with TG followed by challenge with Δslo,sagI− increased the presence of ER stress markers and apoptotic cells in the fascia, together with the restoration of microcolony formation (Figures 7a,b). By contrast, pretreatment with ET followed by challenge with the WT or Δslo,sagI− resulted in apoptotic cells in the upper layer of the muscle and the fascia, respectively, and little to no indication of ER stress, as expected (Figure 7b). The fascia of control mice injected with TG or ET, in the absence of GAS infection, stained positively for CHOP and TUNEL or for TUNEL only, respectively (Figure 7c). These findings show that markers of ER stress and apoptosis co-localize with sites of GAS microcolony formation. Together, these results establish that streptolysin-induced ER stress is important for GAS microcolony aggregation, distribution, and spread during the course of soft tissue infection in vivo.
3 DISCUSSION
The contribution of biofilms to GAS pathogenesis has primarily been linked to persistence and carriage states of the bacterium (Fiedler et al., 2015; Marks, Mashburn-Warren, Federle, & Hakansson, 2014; Young et al., 2016). Nonetheless, the presence of dense GAS microcolonies, displaying attributes of biofilm, was identified in soft tissues of patients with acute infections such as impetigo and NF (Akiyama et al., 2003; Hidalgo-Grass et al., 2004; Siemens et al., 2016). Moreover, the presence of GAS microcolonies has also been observed in soft tissue derived from animal models of acute human GAS infections (Connolly, Roberts, Holder, & Reid, 2011; Neely, Pfeifer, & Caparon, 2002; Taylor Jr et al., 1999). Therefore, it is highly plausible that biofilm formation by GAS plays an important role in the development and progression of acute GAS infections such as NF. However, very little is known about the host-associated pathways and GAS determinants involved in this process.
Here, we established a model of biofilm formation on mammalian cells and showed that it recapitulates GAS microcolony formation in soft tissue during invasive GAS disease in a mouse model of human NF. Both cell-associated biofilm and host-associated microcolony formation required the expression of either SLO or SLS, and a mutant deficient for both cytolysins (Δslo,sagI−) was strongly impaired in the ability to form biofilm or produce microcolonies in vitro or in vivo, respectively. By contrast, GAS biofilm formation in vitro on an abiotic plastic surface did not require SLO and SLS, demonstrating that streptolysins are GAS factors that specifically promote host-associated biofilms. This demonstrates that GAS biofilm formation is highly dependent on the microenvironment and that in vitro analyses of biofilm on abiotic surfaces may be lacking cues normally present in the host environment. These findings underscore the need for using physiologically pertinent models of biofilm-associated infection. In addition, we show that GAS biofilms and microcolonies induce ER stress in an SLO- and SLS-dependent manner in vitro and in vivo in a mouse model of NF, respectively. Pharmacological induction of ER stress in vivo restored the ability of Δslo,sagI− to produce microcolonies in mice, suggesting that streptolyin-induced ER stress contributes to the generation of a host microenvironment that promotes soft tissue infection. We speculate that induction of ER stress elicits the release of a nutritional factor that enhances growth and biofilm biomass accumulation, much like ASN promotes planktonic GAS proliferation (Baruch, Hertzog, et al., 2014). These observations strongly support a model in which both ER stress induction and microcolony formation involve a similar host–pathogen interaction.
SLO and SLS are pore forming toxins (Molloy, Cotter, Hill, Mitchell, & Ross, 2011; Palmer, 2001). Depending on their local concentrations and the type of host cells with which they interact, these toxins trigger a variety of host cellular responses ranging from ER stress to apoptosis and to necrotic cell death (Baruch, Hertzog, et al., 2014; Cywes Bentley, Hakansson, Christianson, & Wessels, 2005; Flaherty, Puricelli, Higashi, Park, & Lee, 2015; Goldmann et al., 2009; Lin, Loughman, Zinselmeyer, Miller, & Caparon, 2009; Molloy et al., 2011; Timmer et al., 2009).
Adding to the diversity of cellular responses to streptolysins, we have demonstrated that secreted streptolysins induce significant upregulation of ER stress markers, indicating that streptolysins trigger ER stress in the host. Purified SLO has been used to induce selective permeabilisation of various mammalian cell lines cells resulting in ER stress and an upregulation in UPR mediators (Hayashi & Su, 2007; Huang et al., 2006; Kokame, Agarwala, Kato, & Miyata, 2000). This finding is consistent with previous studies where SLO secreted by GAS was shown to induce ER stress via calcium dysregulation by forming transmembrane pores by staining with calcium-indicator Fluo3-AM to indicate the calcium flux and for calnexin-labelled vacuoles indicative of ER stress (Cywes Bentley et al., 2005).
ER stress can be sensed by three transducers that initiate UPR: PERK, IRE1, and ATF6 (Ho, Xu, & Thibault, 2018; Szegezdi et al., 2006). Previous reports demonstrated that asparagine synthetase (ASNS), which is activated downstream of the PERK-eIF2α-ATF4 pathway (Gjymishka, Su, & Kilberg, 2009) is induced by GAS exposure to MEFs (Baruch, Belotserkovsky, et al., 2014; Baruch, Hertzog, et al., 2014). Because CHOP is a pro-apoptotic marker that is generally induced as a consequence of activation of the PERK-eIF2α-ATF4 pathway (Ho et al., 2018; Szegezdi et al., 2006) and because we observe Chop induction in response to GAS streptolysin exposure, our data suggests that the PERK-eIF2α-ATF4 pathway is activated when GAS secretes the two streptolysins during infection. In addition, we observe transcriptional upregulation of Grp78, which can occur as a result of IRE1 or ATF6 activation, as well as via of cooperative and interdependent interactions between the three UPR pathways (Takayanagi, Fukuda, Takeuchi, Tsukada, & Yoshida, 2013; Ye et al., 2000; Yoshida, Matsui, Yamamoto, Okada, & Mori, 2001). Therefore, multiple UPR pathways may respond to streptolysin-mediated ER stress.
Thus, upon infection of the host with GAS, several cellular processes occur and progress simultaneously in a time- and space-dependent manner. Although it is challenging to pinpoint which of these cellular processes is responsible for biofilm and microcolony formation, our data show that ER stress is required to initiate the process, because pretreatment of mice with TG but not ET restored the ability of Δslo,sagI− to form microcolonies. Consistent with this, immunostaining of soft tissue sections of mice for apoptotic and ER stress markers revealed that while apoptotic markers were solely present in the fascia of mice challenged with Δslo,sagI−, both ER stress and apoptotic markers were identified in the infected fascia of TG pretreated mice. Similarly, exposure of MEFs to ER stress inducing drugs, or purified toxin and concomitant ER stress, was required to generate a conditioned medium that restored the ability of a streptolysin null GAS mutant to form biofilm. Taken together, these findings suggest that events associated with the progression of host ER stress to apoptosis may be required for host-associated microcolony and biofilm formation.
Importantly, we discovered that in vivo triggering of ER stress not only promotes GAS proliferation and microcolony formation but also enhances GAS invasiveness into deeper tissue and lateral spread from the injection site. TG-mediated ER stress induction significantly increased the number of viable GAS recovered from soft tissue of mice infected with the Δslo,sagI− mutant. Additionally, TG pretreatment enhanced the lateral as well as the transverse spread of Δslo,sagI− microcolonies from fascia to deeper muscle, compared with non-TG treated animals. TG pre-treatment did not further augment WT microcolony distribution, presumably because WT GAS-induced ER stress is already sufficient for maximal infection and spread. However, to our knowledge, this is the first report that implicates SLO and SLS with these events and demonstrates that the host ER stressed microenvironment promotes favourable conditions for GAS microcolony formation, proliferation and dissemination.
4 EXPERIMENTAL PROCEDURES
See Data S1 for additional details.
4.1 Bacterial strains and growth conditions
All bacterial strains used in the study are described in Table S1. See Data S1 for GAS growth and culture conditions.
4.2 Cell culture and media
The cell lines used in this study were MEFs (Baruch, Hertzog, et al., 2014), HFFs (House, Vyas, & Sapolsky, 2011), and HaCaT human keratinocytes (Chan et al., 2017). Cells were cultivated in Dulbecco's modified eagle medium (DMEM + high glucose; Gibco, New York, USA) with 10% fetal bovine serum (FBS; PAA, Pasching, Austria) at 37 °C in 5% CO2 in 24-well polystyrene plastic cell culture plates (Corning, New York, USA).
4.3 Cultivation of biofilms
Overnight cultures (16–18 hr) of GAS strains grown in Todd Hewitt yeast extract medium (Todd-Hewitt medium [Sigma-Aldrich, Missouri, USA] supplemented with 0.2% yeast extract (Becton, Dickinson, San Jose, USA) were diluted 20-fold in a 4:1 mixture of Todd Hewitt yeast extract media and DMEM supplemented with 10% FBS and grown until early log phase (OD600 = 0.2). The bacterial cells were centrifuged at 5,000 g for 10 min, and the resulting pellet was washed twice in 1× PBS and then resuspended in 1× PBS to an OD600 of 0.8, equivalent to 1 × 10⁸ CFU/ml. Finally, 5 × 10⁵ CFU of bacteria were seeded into 24-well polystyrene plastic cell culture plates (Corning, New York, USA) containing DMEM with 10% FBS for growth on the abiotic surface. To observe GAS growth on biotic surface, MEFs seeded at a density of 5 × 10⁴ MEFs/well in 24-well plates were infected with the same bacterial inoculum, at a multiplicity of infection of 10. The plates were incubated for static GAS growth at 37 °C with 5% CO2 for the indicated times, with media change after every 24 hr to prevent accumulation of toxic metabolic byproducts released during cellular growth.
4.4 Biofilm quantitation
Biofilm biomass was quantified using CV staining of adherent biofilms on plastic, as previously described (Thenmozhi, Balaji, Kumar, Rao, & Pandian, 2011) with minor modifications for biofilms growing on mammalian cells (Negri et al., 2010). The detailed protocol is described in Data S1.
4.5 Immunofluorescence and microscopy
GAS biofilms were grown on 35-mm ibiTreat surface μ-Dishes (ibidi, Munich, Germany), either directly on the plastic surface or on MEFs seeded at 5 × 10⁴ cells/μ-Dish and immunostained with commercial antibodies, described in Data S1. All confocal microscopy was performed with an LSM 780 inverted laser scanning confocal microscope (Carl Zeiss, New York, USA), using a ×20 Plan-Apo 0.8 NA or ×63 Plan-Apo 1.4 NA oil immersion objective. Epifluorescence images were acquired with the Axio Observer Z1 Inverted Widefield microscope (Carl Zeiss, New York, USA) using a 20×/0.50 DICII and 63×/1.25 DICIII oil immersion objective. 3D reconstruction of biofilm images and quantification were performed using the Zen Black imaging software (Carl Zeiss, New York, USA).
4.6 Image analysis
Imaris (Bitplane AG, Belfast, United Kingdom) Version 8.4 was used to calculate biovolume of the biofilm. ImageJ (NIH, Maryland, USA) was used to quantify mean florescence intensity (MFI) of biopsy sections after immunostaining.
4.7 Cell death assays
Cell cytotoxicity was assessed using the LDH cytotoxicity determination kit (Clonetech, California, USA) according the manufacturer's directions. See Data S1 for additional details. Cell death was also assessed using a NucView 488 and RedDot 2 Apoptosis and Necrosis Kit (Biotium, California, USA). Culture media was removed from infected MEFs at the indicated time points, cells were washed with 1× PBS, and stained according to the manufacturer's protocol.
4.8 Animal experiments
GAS WT or Δslo,sagI− mutant strains were injected in a mouse model of soft-tissue infection as described previously (Hidalgo-Grass et al., 2002; Hidalgo-Grass et al., 2006; Hidalgo-Grass, Dan-Goor, et al., 2004). TG or ET were injected subcutaneously into mouse soft tissue 12 hr prior to the bacterial infection. See Data S1 for additional details. All procedures were approved and performed in accordance with the Institutional Animal Care and Use Committee (IACUC) of National University of Singapore (NUS; IACUC protocol no: R14–0575) and Nanyang Technological University (NTU), School of Biological Sciences (ARF SBS/NIE [A0327]).
4.9 Statistical analysis
All experiments were repeated independently at least three times, with three technical replicates each (unless otherwise stated). Statistical significance for data from all experiments was determined using the GraphPad Prism software (Version 6.05 for Windows, California, United States). Data are expressed as mean ± SEM (unless stated otherwise), and p < 0.05 was considered significant (p < 0.05 (*); p < 0.01 (**); p < 0.001 (***); p < 0.0001 (****); “ns” denotes no statistical significance.
ACKNOWLEDGEMENTS
The authors acknowledge financial support from the Singapore Centre for Environmental Life Sciences Engineering (SCELSE), whose research is supported by the National Research Foundation (NRF) Singapore, Ministry of Education (MOE), Nanyang Technological University (NTU), and National University of Singapore (NUS), under its Research Centre of Excellence Programme. This work was supported by: the National Research Foundation under its Singapore NRF Fellowship programme (NRF-NRFF2011-11); the National Medical Research Council under its Clinical Basic Research Grant (NMRC/CBRG/0086/2015); and by the National Research Foundation, Prime Minister's Office, Singapore under its “Campus of Research Excellence and Technological Enterprise (CREATE) programme.”
We thank Assoc. Prof. Ajai Vyas (NTU, Singapore) and Assoc. Prof. Tan Nguan Soon Andrew (NTU, Singapore) for the kind gifts of human foreskin fibroblasts and human keratinocytes, respectively. We extend our gratitude to Dr. Michael Wessels (Harvard Medical School) for his kind gift of the GAS M1 854 and its streptolysin null mutant strain. We are thankful to Chong Kian Long Kelvin for helping us extensively with the animal work. We thank Ho Foo Kiong for construction of the streptolysin null mutants in the MGAS5005 background. We also thank Catherine Chen Youting (CREATE, NUS, Singapore) for technical assistance and discussions, as well as Goh Hwee Mian Sharon (SCELSE, NTU, Singapore) for assistance with in vitro biofilm assays. We thank Baruch B. Herzog, Miriam Ravins, and Yael Kaufman (HUJ, Israel) and Artur Matysik and Ho Foo Kiong (SCELSE, NTU, Singapore) for their critical review of this paper. We are also indebted to Asst. Prof. Guillaume Thibault (NTU, Singapore) for his critical review of this paper.
CONFLICT OF INTEREST
The authors declare no conflict of interest.


