Wincladtree: Publication-quality tree-diagrams with TNT scripts
Abstract
This note describes the implementation and use of wincladtree, a TNT script to plot publication-quality tree-diagrams. This is intended to assist analysis of morphological datasets, where displaying the synapomorphies for the different groups in a compact “Hennigian” style is the norm.
This note describes the implementation, using TNT's scripting language, of routines to produce publication-quality tree-diagrams. This is intended to facilitate the production of compact diagrams including synapomorphies on the branches in a “Hennigian” style, which is particularly important for morphological phylogenetics. The script described is called wincladtree, and is available at https://www.lillo.org.ar/phylogeny/tnt/scripts/wincladtree.run. The main motivation for this script is that, although several programs for producing publication-quality tree-diagrams exist (e.g. TreeView, Page, 1996; FigTree, Rambaut, 2009; Dendroscope, Huson and Scornavacca, 2012; Mesquite, Maddison and Maddison, 2023), none of them includes easy options to plot synapomorphies on tree branches. The two programs that can easily produce tree-diagrams with synapomorphies plotted on the branches are TNT (Goloboff et al., 2008; Goloboff and Catalano, 2016; Goloboff and Morales, 2023) and Winclada (Nixon, 2008). Reporting the synapomorphies of the different groups is an essential component of morphological phylogenetics, and being able to display them in a compact and visually informative manner is equally important. Although TNT can display lists of synapomorphies, its native options only include plotting synapomorphies on tree-diagrams in successive lines, parallel to the lines subtending each clade. This produces large, very tall trees, and is often not the most convenient way to display the results. Winclada, on the other hand, can display synapomorphies from the trees calculated by TNT in a more compact and visually pleasing manner, but using an external program requires exporting the dataset and trees, with the risk of inadvertently producing plots with settings or methods different from those used to identify the most parsimonious trees. One such example would be in the use of TNT's options for inapplicable or continuous characters (including landmarks), which Winclada cannot optimize as such.
TNT is not capable of natively producing diagrams that are both as compact and informative as those of Winclada, but its scripting language can be easily used to produce such diagrams. As TNT can save tree-diagrams in SVG format, preserving the coordinates of the different nodes for subsequent additions to the graphic, the scripting language can be used to place the branch labels (whether they are labels with lists of synapomorphies, or the labels produced by the user with e.g. support values or character-state mappings) at their corresponding locations. The script has been called “wincladtree” as a tribute to Nixon's famed Winclada. As TNT scripts are a high-level interpreted language (i.e. simpler instructions than actual code, executed by TNT as they are read), they consist of text files that can be examined and modified by the user.1 Goloboff (2022, Chapter 8) provided a general overview of TNT's scripting language, which can assist users in interpreting and modifying the script. As the scripts are interpreted by TNT itself, the potential problem of inconsistent assumptions or methods created by using external programs disappears. An inconvenience of scripts is that they need to be located at a specific directory for TNT to easily execute them from the command line, but the rdir command of TNT (for “run directory”) can be used to specify any directory as a script repository—so that the scripts effectively become “extensions” of TNT's set of commands. As the wincladtree script can produce long branch labels (with the full list of synapomorphies for every node), it is advisable to allocate enough memory prior to reading the data, e.g. including a taxname+500 command (for total labels of up to 500 characters, or more if needed) in the file itself, preceding the xread command that defines the dataset.
Output of wincladtree
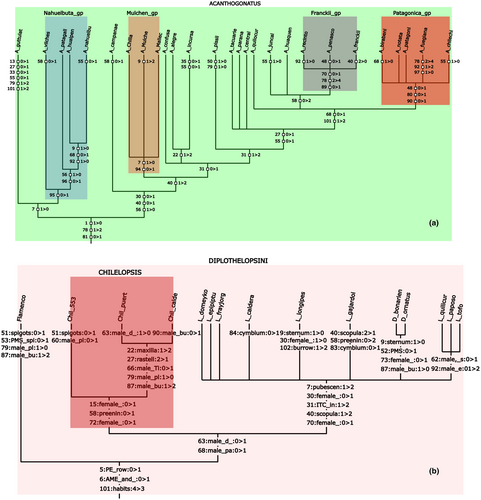
(optimal trees are assumed to be already present in memory for this example). “Acanthogonatus” is the name of a group of taxa defined in the data file itself (with the agroup command of TNT); with the display option of wincladtree, different parts of the tree can be displayed. With the options shown, wincladtree produces a file called image.svg with the lists of synapomorphies and frames for higher taxa, shown “as is” in Fig. 1a.tnt*> wincladtree image.svg colorfile cladecolors display Acanthogonatus;

The list of synapomorphies is produced with TNT's command apo>, which optimizes all the trees and displays on the branches of the consensus the synapomorphies shared by all the trees in memory. This process is intended to remove ambiguity as much as possible, including as “synapomorphies” only those changes that occur in every possible most parsimonious reconstruction, and on every one of the trees. The list is always produced by mapping characters on the full trees; if only some taxa are displayed, they are eliminated only from the display, after the trees are optimized and the synapomorphy lists have been produced.
The file indicated with colorfile (in this case, cladecolors) contains the colour definition for each taxonomic group to be indicated in the tree; this is a text file, with a list of groups and colours:
| ACANTHOGONATUS | 0,255,0,25 |
| Nahuelbuta_gp | 10,20,220,20 |
| Mulchen_gp | 255,0,0,30 |
| Franckii_gp | 100,0,100,30 |
| Patagonica_gp | 255,0,0,50 |
| CHACO | 80,0,255,30 |
For each group, the first three numbers are the RGB code, and the fourth number is the opacity. If the file contains groups not defined in the reference taxonomy, they are ignored (i.e. a single file can be used for defining colours of groups that are in different datasets); if a name defined in the reference taxonomy is not found in the file, the default colour (either 255,0,0,7, or the one set with colorfile, see below) is used.
When character and state names have been defined, wincladtree can also produce lists of synapomorphies using names instead of numeric codes (Fig. 1b). This naturally requires more space, being less compact than the trees using only numeric codes, but avoids the work of having to work through lists of characters to see the diagnostic character(s) for the groups, and is still more compact and elegant than the trees produced natively by TNT. The maximum width of the columns can be specified by the user (Fig. 1b was produced with the default of 14), and if using appropriately compact character names they can be recognizable from the first few characters.
One of the options is not aligning the terminal taxa (noalign), so that the tree is somewhat more compact and the frames indicating the higher groups are placed at their own heights (as in Fig. 2a). With noalign, the length of the terminal branches is proportional to their numbers of synapomorphies (which is not the case when the tree is displayed with the default align). With the shade option (together with the default use of squares) the homoplasy of the characters is indicated with five shades of grey2 (white represents no or very low homoplasy; there are only a few such synapomorphies in Fig. 2a). Homoplasy is defined formally, as the difference between the optimized length and the minimum possible length. Note that, for each character, wincladtree calculates the homoplasy on the first tree in memory; other trees may have different amounts of homoplasy, so that the colour is only a rough approximation.3

If the user has defined some tree-tags, the tree-diagram can be made to display those instead of a list of synapomorphies. Then, by first connecting tree-tags (with the ttag = command or the Trees > Multiple Tags > Store Tree Tags menu option) and then calculating e.g. group supports, the tree-diagram can display the supports. Alternatively, one of the trees in memory can be displayed without marks on the branches, which (possibly with the labeling of higher taxa) can be used to produce summaries of results.
The trees can be drawn bottom-up (by default, as in the figures shown in this paper), or optionally from left to right (like Winclada; this is set from the command line with the rotate option, or the “Tree orientation” button in the graphic dialogue, see Fig. 2b). Other options determine the use of usertags, names, labels, or the font size for terminal taxa, legends and higher taxa (taxsize, marksize, and labelsize). The default colour for the labels of higher taxa is defined with fillcolor followed by RGB and opacity in the same format as indicated above for colorfile (values of opacity of 15–30 work well if there are not many overlapped labels of higher taxa). Alternatively, as discussed above, the colour for each category can be indicated separately with colorfile. Higher taxa not included in colorfile are coloured with the default colour (or the colour defined with fillcolor). If the fillcolor has an opacity of 0 (i.e. transparent), then only the higher taxa whose names have been defined in the colorfile are framed.
Usage
To run wincladetree, you need to have either optimal trees in memory (to produce the synapomorphy lists or plotting a tree) or existing tree-tags (produced by the user). The script must be placed in a directory named without spaces or blanks. When the script is invoked with help as the first argument, it displays the full list of options implemented. If wincladtree is invoked with command-line arguments (i.e. wincladtree arg1 arg2 … argN), then it runs and produces the diagram directly, with no further questions asked. The first argument given to wincladtree must be the name of the SVG file; the rest of the arguments are optional.
In versions with a Graphic User Interface (GUI, in Windows or GTK), invoking wincladtree with no arguments (e.g. by opening it with File > Open Input File) automatically opens a graphic dialogue (as in Fig. 2b). This dialogue includes all the options implemented so far in wincladtree, making its use much simpler. It is defined with the scripting language of TNT (see Torres et al., 2021 for other examples of scripts with a graphic interface), and therefore can be modified relatively easily by the user.
Acknowledgements
I wish to acknowledge support from the National Science Foundation (award no. 2148768 for Morphobank, with Tanya Berardini as principal investigator), CONICET (PUE 0070 and PIP 11220200102052 to PAG, and PICT-2021-I-A-01112 to Claudia Szumik), as well as the continued support by the Willi Hennig Society for developing TNT. I also thank Evgeny Shcherbakov for discussion on compact lists of synapomorphies, Claudia Szumik, Ward Wheeler and an anonymous reviewer for comments on the manuscript, and Martín Morales for help with SVG commands.
References
- 1 TNT itself is distributed only in binary form, but even if it were distributed as open code, compilation of its (as of January 2024) 220 000 lines of code is far more complex than modifying a simple text file like a script. In particular, many idiosyncrasies in the code for drawing trees would make modifications rather difficult.
- 2 I first considered the use of 50, which I quickly discarded when I realized the implication.
- 3 As different trees used to produce the list of synapomorphies could have different amounts of homoplasy, one would have to choose the maximum, minimum or average, and there seems to be no general justification for a choice (specific cases may call for one or the other). It is better to just consider the shading as an approximation.


