The influence of vertical ridge augmentation techniques on peri-implant bone loss: A systematic review and meta-analysis
Abstract
Introduction
The primary aim of this systematic review was to investigate and compare the outcomes of different vertical ridge augmentation (VRA) techniques in relation to peri-implant bone loss (PBL), after at least 12 months of functional loading.
Material and methods
The search was conducted to find all the studies about VRA and measurements of PBL with at least 12 months follow-up. Three pairwise meta-analysis (MA) was performed to completely evaluate the outcomes.
Results
A total of 42 studies were included, of which 11 were randomized clinical trials (RCTs). RCTs were available only for guided bone regeneration (GBR), onlay, and inlay techniques. The weighted mean estimate (WME) of PBL value was found to be 1.38 mm (95% confidence interval [95% CI]: 1.10–1.66) after a mean follow-up of 41.0 ± 27.8 months. GBR, Inlay, Onlay, osteodistraction, and SBB represented in weight 32.9%, 30.6%, 25.0%, 7.6%, and 3.9%, respectively; and their WME (95% CI) were 1.06 (0.87–1.26) mm, 1.72 (1.00–2.43) mm, 1.31 (0.87–1.75) mm, 1.81 (0.87–1.75) mm, and 0.66 (0.55–0.77) mm, respectively. Among the secondary outcomes, the analysis was conducted for vertical bone gain, healing complication rate, surgical complication rate, implant survival, and success rate.
Conclusions
The primary findings of the meta-analysis, based on the changes between final and baseline values, showed that the peri-implant bone loss could be influenced by the type of intervention but there is a need to evaluate in RCTs the behavior of the peri-implant bone levels after long-term follow-up for all techniques.
Summary Box
What is known
- Vertical ridge augmentation techniques give significant and predicable vertical bone gain (VBG), associated with high complications.
- Many systematic reviews reported data regarding VBG and/or complication rates.
What this study adds
- Although most of systematic reviews reported data related to peri-implant bone loss (PBL) of implants placed in augmented sites using different approaches, none was conducted considering PBL as the primary outcome.
- The aim of this systematic review was to investigate and compare the outcomes of different vertical ridge augmentation techniques in relation to PBL, after a follow-up of at least 12 months.
1 INTRODUCTION
It is well known that tooth loss triggers progressive bone resorption and three-dimensional alveolar bone loss.1 Indeed, the alveolar ridge is rapidly reabsorbed during the first 6 months after dental extraction and several factors such as the presence of periodontal disease, periapical pathology, or trauma, can increase resorption even before tooth loss.2 The residual bone volume after extractions may not be sufficient for the placement of standard implants.3-6
Commonly, an atrophic or severely deficient edentulous ridge will require bone augmentation either simultaneous to implant placement or in a staged approach.7 High predictable results, low complication rates, and an implant survival rate of 97%–100% have been reported for horizontal bone augmentation procedures.7, 8 However, vertical ridge augmentation (VRA) is a more technically and biologically challenging technique and has been associated with higher complication rates and less predictable results, due to its high sensitivity.9-11
For this reason, other approaches, such as short dental implants, have been proposed.12, 13 However, on many occasions, the bone height is insufficient for the placement of short implants14 and they are not normally used in the anterior maxillary region because of the high aesthetic demands of this area.15
For these reasons, VRA techniques are used to provide adequate bone volume and to achieve an adequate aesthetic result in various clinical situations.16
Many systematic reviews about VRA reported data regarding vertical bone gain (VBG) and/or complication rates and/or implant survival using the different surgical approaches: Guided Bone Regeneration, inlay graft, onlay graft, distraction osteogenesis, or split bone block technique.17-23
During the consensus report on Bone Regeneration in 2018, Jepsen et al. stated that VRA is a high technique-sensitive surgical intervention where the key elements are appropriate graft/barrier stabilization, the appropriate flap management, and soft tissue closure. The results of the systematic review showed a weighted mean clinical VBG of 4.16 mm (95% confidence interval [95% CI: 3.72–4.61 mm). The weighted mean complication rate was 16.9% (95% CI: 12.5–21), influenced by the type of procedure with a 47.3% complication rate for distraction osteogenesis, 12.1 % guided bone regeneration, and 23.9% for the use of blocks. The weighted mean bone loss of studies with at least 12 months follow-up, was 1.01 mm (distraction osteogenesis showed a bone loss of 1.4 mm, guided bone regeneration of 0.99 mm, and autologous bone blocks of 0.77 mm).
Although most of systematic reviews reported data related to peri-implant bone loss (PBL) of implants placed in augmented sites using different approaches, none has been done primarily about this issue, considering PBL as the primary outcome.11
Since the patient, intervention, comparison, outcome (PICO) question and primary outcomes are strictly related together and they strongly influence the selection of the studies and the data collected from them, the lack of a dedicated search strategy on PBL is the rationale of the present systematic review and meta-analysis (MA).
Furthermore, a systematic review dedicated to PBL can draw more consistent data on implant survival and success rates, that are closely related to PBL and follow-up.
The first objective of this systematic review was to evaluate if there are significant differences between the different VRA techniques in relation to the PBL over time, considering results after three different follow-up periods (short term, medium term, and long term). The secondary objectives were to assess whether any differences exist between VBG, complication rates, and implant survival and success.
2 MATERIALS AND METHODS
This systematic review fully adhered to guidelines of Preferred Reporting Items for Systematic Reviews and Meta-analyses (PRISMA)24 and was registered at the PROSPERO platform under code number CRD4201912958 (https://www.crd.york.ac.uk/prospero/display_record.php?RecordID=129587).
The criteria for selecting studies to be included in the systematic review were based on PICO strategy. The focused question is: Which is the VRA technique having less PBL over the years?
Population: Patients over 18 years of age, showing good general health, with different vertical deficiencies. Intervention: Treatment of vertical deficiencies by means of different VRA techniques. Comparison: guided bone regeneration (GBR; nonresorbable, resorbable membranes and titanium mesh), Onlay graft (ONLAY), not covered and covered with a resorbable membrane), Inlay graft (INLAY), Distraction Osteogenesis (DISTR), and Split bone block technique (SBB). Outcomes of interest: the changes of crestal bone levels around implants placed in vertically augmented alveolar ridges.
2.1 Search strategy
MEDLINE (PubMed), EMBASE, and Web of Science were systemically searched from January 1996 to January 2021 (a total of 25 years). References from the included studies were manually checked to identify any other additional studies.
The searches were independently performed by two researchers (FM and GAP), using the following search string including medical subject headings (MeSH) and related keywords: “(Bone augmentation OR Alveolar ridge augmentation OR Vertical ridge augmentation OR Vertical bone regeneration OR Vertical bone reconstruction OR Vertically augmented sites OR Vertical bone gain) AND (Peri-implant Bone loss OR Crestal bone loss OR Marginal bone loss OR Bone resorption OR Peri-implant Bone level OR Crestal bone level OR Marginal bone level).”
Moreover, to ensure a thorough screening process, a manual search of articles published in the same time frame and concerning the same issue, was conducted in the following journals: Clinical Implant Dentistry and Related Research, Clinical Oral Implants Research, European Journal of Oral Implantology, International Journal of Oral Implantology, International Journal of Oral and Maxillofacial Implants, International Journal of Oral and Maxillofacial Surgery, Journal of Oral Implantology, Journal of Clinical Periodontology, Journal of Periodontal Research, Journal of Periodontology, and International Journal of Periodontics & Restorative Dentistry, Implant Dentistry.
In addition, the reference lists of all selected articles (bibliography) related to the topic were subjected to scrutiny to raise the number of eligible articles in the present review.
2.2 Study selection
After electronic and manual research, all titles, abstracts, and keywords were screened and the following inclusion/exclusion criteria were applied.
The Inclusion criteria were: study published in an international peer-reviewed journal; study published in English; study with an involved number of patients ≥10 for each surgical technique analyzed; studies aiming at vertical bone regeneration evaluating the effectiveness of interventions; studies evaluating the effectiveness of VRA procedures using radiographs; studies with a minimum follow-up of 12 months after definitive loading; randomized clinical trial (RCT), nonrandomized clinical trial, prospective cohort studies (PROS), and retrospective cohort studies (RETR).
The Exclusion criteria were in vitro studies, animal studies, case series and case reports (including the articles reporting, case series and case reports, in the title or in the text); studies concerning bone regeneration aimed only at horizontal bone regeneration; studies published prior to 1996.
Afterwards, the full texts of all articles selected during the screening stage were retrieved and independently assessed for inclusion by both researchers. Any disagreements were solved by discussion.
- “GBR” group (GBR), that included all approaches based on the application of biological barriers as cell-selective and space-making device;
- “Onlay graft” group (ONLAY), based on the application of external bone blocks;
- “Inlay graft” group (INLAY), based on the application of internal bone blocks after osteotomy and immediate expansion;
- “Distraction Osteogenesis” group (DISTR), based on the application of distractor after osteotomy and progressive expansion;
- “Split bone block technique” group (SBB), based on the application of bone block lamina after bone block splitting.
Since GBR procedures can be performed using three different types of “barrier,” that is (i) PTFE membranes (PTFE), (ii) collagen membranes (COLLAG), and (iii) titanium meshes (MESH), data related to these surgical approaches were considered separately.
In this review split bone block (SBB) and inlay graft (INLAY) were considered two different surgical techniques and their results were separately evaluated although both include bone splitting. The reasons were that the SBB consists in the stabilization of two split autologous bone blocks to the ridge, with microscrews, that are always obtained either from the mandibular symphysis or ramus. The void that has been created between the blocks is filled with particulate autogenous bone.25
2.3 Outcomes of interest
The primary outcome of the systematic review is PBL, defined as the difference between peri-implant bone level at follow-up and peri-implant bone level at baseline. The peri-implant bone level (or crestal bone level) is defined as the distance between the implant shoulder and the first bone-implant contact measured at both the mesial and distal aspects.26
- VBG: defined as change in the clinical vertical alveolar ridge dimension, as determined by direct linear measurements between baseline and re-entry11;
- Healing complications rate (HCR), which indicates the percentage of complications involving loss of graft integration, like flap dehiscence, graft or membrane exposure, local infection;
- Surgical complications rate (SCR), which specifies the complications rate that does not involve loss of graft integration, such as vascular damage, paresthesia/dysesthesia, and prolonged pain;
- Implant survival and success rate (SURV and SUCC), that were assessed according to the criteria described in Buser et al.27 as modified by Albrektsson and Zarb28;
- Patient-reported outcome measures (PROMs), such as pain, discomfort, and satisfaction;
- Probing pocket depth (PPD) and Gingival or Bleeding indexes (GI or BI);
- Mucositis and peri-implantitis rates (%) (MPR), defined as the occurrence of mucositis (BOP with or without increased PPD and without radiographic bone loss) and/or peri-implantitis (BOP with or without increased PPD and with radiographic bone loss.29
2.4 Data extraction
Data extraction was performed independently by two researchers (MF and PGA). The following information was extracted for each included article: author(s), publication year, study design; number of patients; jaw of interest; type of edentulism; type of procedure (surgical technique); treatment definition and implant positioning (simultaneous or staged); membrane/mesh brand(s); healing time; number of implants (at baseline and at the end of follow-up); implant brand(s); implant surface (rough or machined); Implant connection; follow-up time of implants; and PBL over time. In case of missing data or where required information could not be retrieved from the full texts of included studies, the two researchers contacted the authors by e-mail.
- short-term follow-up: between 12 and 24 months (≥12 months; <24 months);
- medium-term follow-up: between 24 and 60 months (≥24 months; <60 months);
- long-term follow-up: 60 months or longer (≥60 months).
Based on the data reported in the included articles, it was possible to calculate a numerical coefficient that indicates the final PBL in relation to the VBG, giving information about the stability of the augmented bone using the different techniques.
It was calculated as the ratio between the mean values of PBL and VBG stated into the included studies. The results were broken down by surgical technique and stratified according to the follow-up periods, as given in Table 1.
| Author and pubblication year | Study design | Number of patients baseline (final) | Jaw of interest/edentulism | Type of procedure (graft presentation) | Treatment definition test (staged, simultaneous) | Membrane/mesh brand | Healing time | Number of implants baseline (final) | Implant brand (surface) | Follow-up time (months) | Peri-implant bone loss over time (mm) |
|---|---|---|---|---|---|---|---|---|---|---|---|
| Simion et al.30 | RETR | 11 (11) | Post. or ant. man or max/part. | GBR (partic.) | PTFE-e Ti-reinf. memb. + homologous partic. (simultaneous or staged) | GORE-TEX Regenerative Membrane, Titanium Reinforced; W.L. Gore & Associates, Flagstaff, AZ, USA | 6–12 months | 26 (26) | Brånemark (Machined) | T1: 12 T2: 24 T3: 36 T4: 48 |
1.87 ± 0.85 |
| 32 (32) | Post. or ant. man or max/part. | GBR (partic.) | PTFE-e Ti-reinf. memb. + autologous partic. (simultaneous or staged) | GORE-TEX Regenerative Membrane, Titanium Reinforced; W.L. Gore & Associates, Flagstaff, AZ, USA | 6–12 months | 82 (82) | Brånemark (Machined) | T1: 12 T2: 24 T3: 36 T4: 48 |
1.70 ± 0.98 | ||
| Nyström et al.31 | PROS | 30 (23) | Post. or ant. max./tot | ONLAY (Bone block) | Apposition of autologous bl. oss. (simultaneous) | No membrane | 6 months | 177 (129) | Nobel Biocare, Goteborg, Sweden (Rough) | T1: 12 T2: 24 T3: 36 T4: 48 T5: 60 T6: 120 |
T1: 1.42 ± 0.39 T2: 1.74 ± 0.35 T3: 2.66 ± 0.36 T4: 2.70 ± 0.33 T5: 2.73 ± 0.33 T6: 2.71 ± 0.34 |
| Chiapasco et al.32 | PROS | 37 (36) | Post. or ant. man. or max./part. and tot. | DISTR (no graft) | Intrabone distractor (staged) | No membrane | 2–3 months | 138 (40) | Branemark implants (Nobel Biocare, Goteborg, Sweden); 3i Osseotite implants (3i, Palm Beach, FL); Screw-type ITI implants; Xive Friadent (Mannheim, Germany (Rough) |
T1: 12 T2: 24 T3: 36 T4: 48 |
T1: 0.8 ± 0.4 T2: 1.1 ± 0.5 T3: 1.2 ± 0.4 T4: 1.4 ± 0.4 |
| Hallman et al.33 | RETR | 11 (11) | Post. or ant. max./tot | INLAY (Bone block) | Interp. autologous bl. oss, after Le Fort 1 osteotomy (staged) | No membrane | 6 months | 84 (73) | Brånemark System®, Nobel Biocare AB, Göteborg, Sweden (Machined) | 60 | 2.3 ± 0.8 |
| 11 (11) | Post. or ant. max./tot | INLAY (Bone block) | Interp. autologous bl. oss, after Le Fort 1 osteotomy (staged) | No membrane | 6 months | 72 (68) | TiOBlast®, Astra Tech AB, Mölndal, Sweden (Rough) | 60 | 2.4 ± 1.4 | ||
| Polo et al.34 | PROS | 10 (10) | Post. mand. /part. | DISTR (no graft) | Intrabone distractor (staged) | No membrane | 3 months | 34 (32) | Master Conect, Conexão, São Paulo, Brazil (Rough) | 12.1 ± 3.8 | 2.6 ± 1.0 |
| Chiapasco et al.35 | PROS | 39 (33) | Post. or ant. max/tot | INLAY (Bone block) | Interp. autologous bl. oss, after Le Fort 1 osteotomy (staged) | No membrane | 4–8 months | 281 (8) | Nobel Biocare, Goteborg, Sweden; Friadent, Mannheim, Germany; ITI Straumann Dental Implant System, Basel, Switzerland (Rough) |
T1: 12 T2: 24 T3: 36 T4: 48 T5: 60 T6: 72 T7: 84 T8: 96 T9: 108 |
T1: 0.97 ± 0.50 T2: 1.25 ± 0.70 T3: 1.47 ± 0.90 T4: 1.38 ± 0.90 T5: 1.4 ± 0.80 T6: 1.3 ± 0.60 T7: 1.3 ± 0.60 T8: 1.19 ± 0.60 T9: 2.21 ± 0.30 |
| Pieri et al.36 | PROS | 16 (16) | Post. or ant. man. or max./part. | GBR (partic.) | Titanium mesh + autologous and heterologous partic. (staged) | Modus 1.5 Mesh, Institute Straumann, Waldenburg, Switzerland | 8–9 months | 44 (44) | XiVE plus, DENTSPLY-Friadent, Mannheim, Germany (Rough) | T1: 12 T2: 24 |
T1: 1.26 ± 0.30 T2: 1.36 ± 0.31 |
| Marchetti et al.37 | RETR | 12 (12) | Post. or ant. max./tot | INLAY (Bone block) | Interp. autologous bl. oss, after Le Fort 1 osteotomy (staged) | No membrane | 4–5 months | 104 (93) | MK II implants, Nobel Bio Care, Göteborg, Sweden (Machined) Frialit-2 System implants, TPS surface, Dentsply Friadent, Mannheim, Germany (Rough) |
T1: 12 T2: 24 T3: 36 T4: 48 T5: 72 T6: 96 T7: 120 T8: 144 |
2.82 ± 0.81 |
| Canullo et al.38 | RETR | 10 (10) | Post. or ant. man. or max./part. | GBR (partic.) | PTFE-e Ti-reinf. + heterologous partic. (simultaneous) | GORE-TEX Regenerative Membrane, Titanium Reinforced; W.L. Gore & Associates, Flagstaff, AZ, USA | 6–8 months | 24 (24) | Defcon Implant System, Barcellona, Spain (Rough) | 36 (24-54) | 1.4 ± 0.4 |
| Urban et al.39 | RETR | 35 (33) | Post. or ant. man. or max./part. and tot. | GBR (partic.) | PTFE-e Ti-reinf. + autologous partic. (simultaneous or staged) | GORE-TEX Regenerative Membrane, Titanium Reinforced; W.L. Gore & Associates, Flagstaff, AZ, USA | 6–9 months | 82 (7) | Acid etched Steri-Oss implants, Nobel Biocare Yorda Linda, CA; Anodized-surface Brånemark TiUnite Nobel Biocare; Anodized-surface Replace TiUnite Noble Biocare implants (Rough) | T1: 12 T2: 24 T3: 36 T4: 48 T5: 60 |
T1: 1.40 ± 1.10 T2: 1.35 ± 1.38 T3: 1.41 ± 1.56 T4: 1.39 ± 1.69 T5: 1.40 ± 1.82 |
| Corinaldesi et al.40 | RETR | 13 (13) | Post. or ant. man. or max./part. | GBR (partic.) | Titanium mesh + autologous partic. (simultaneous) | ACE Titanium Micro Mesh, ACESurgical Supply Company; Modus 0.9 Mesh, Medartis | 8–9 months | 20 (20) | Spline Twist MTX; Centerpulse Dental Spline Twist MTX; Zimmer Dental (Rough) | 61.92 ± 19.2 (36-96) | 1.55 ± 0.44 |
| 11 (11) | Post. or ant. man. or max./part. | GBR (partic.) | Titanium mesh + autologous partic. (staged) | ACE Titanium Micro Mesh, ACESurgical Supply Company; Modus 0.9 Mesh, Medartis | 8–9 months | 36 (36) | Spline Twist MTX; Centerpulse Dental Spline Twist MTX; Zimmer Dental (Rough) | 61.92 ± 19.2 (36-96) | 1.59 ± 0.45 | ||
| Nyström et al.41 | PROS | 26 (23) | Post. or ant. max./tot | INLAY (Bone block) | Interp. autologous bl. oss., after Le Fort 1 osteotomy (staged) | No membrane | 6 months | 167 (143) | Brånemark (Machined) | T1: 12 T2: 24 T3: 36 T4: 48 T5: 60 T6: 120 |
T1: 2.54 ± 0.09 T2: 2.90 ± 0.10 T3: 2.89 ± 0.09 T4: 3.17 ± 0.13 T5: 3.02 ± 0.10 T6: 3.13 ± 0.10 |
| Felice et al.42 | RCT | 10 (10) | Post. mand./part. | INLAY (Bone block) | Interp. autologous bl. oss. + pericardium memb. (staged) | Bio-Guide®, Geistlich Pharma | 3–4 months | 20 (20) | Biomet 3i implants, Palm Beach, FL, USA; XiVe implants, Friadent-Dentsply, Mannheim, Germany; (Rough) | 18 (13–22) | 0.72 ± 0.80 |
| 10 (10) | Post. mand./part. | ONLAY + res. memb. (Bone block) | Apposition of autologous bl. oss. + nat coll. memb. (staged) | Bio-Guide®, Geistlich Pharma | 3–4 months | 23 (23) | Astra implants, Astra Tech AB, Mölndal, Sweden; Biolok implants, Biolok, Deerfield, FL, USA; Alpha Bio implants, Alpha-Bio Tec Ltd., Petak-Tikva, Israel (Rough) | 18 (13–22) | 2.88 ± 1.13 | ||
| Merli et al.43, 44 | RCT | 11 (11) | Post. or ant. man or max/part. | GBR (partic.) | Nat. coll. memb. + autologous partic. (simultaneous) | Bio-Gide, Geistlich Pharma, Wolhusen, Switzerland | 5 months | 42 (42) | XiVE S Plus, Dentsply/Friadent (Rough) | T1: 12 T2: 36 T3: 72 |
T1: 0.51 ± 0.34 T2: 0.55 ± 0.58 T3: 0.58 ± 0.66 |
| 11 (11) | Post. or ant. man or max/part. | GBR (partic.) | PTFE-e Ti-reinf. memb. + autologous partic. (simultaneous) | GORE-TEX Regenerative Membrane, Titanium Reinforced; W.L. Gore & Associates, Flagstaff, AZ, USA | 5 months | 55 (55) | XiVE S Plus, Dentsply/Friadent (Rough) | T1: 12 T2: 36 T3: 72 |
T1: 0.59 ± 0.58 T2: 0.53 ± 0.66 T3: 0.49 ± 0.53 |
||
| Canullo et al.45 | PROS | 20 (20) | Post. or ant. man or max/part. | GBR (partic.) | PTFE-e Ti.reinf. memb. + hydroxyapatite and Mg partic.c (simultaneous) | W. L. Gore & Associates, Flagstaff, AZ, USA | 3 months | 42 (42) | Global Implant System, Sweden & Martina, Padua, Italy (Rough) | 18 (12–24) | 0.98 ± 0.42 |
| Todisco46 | PROS | 20 (20) | Post. or ant. man or max/part. | GBR (partic.) | PTFE-e Ti-reinf. + heterologous partic. (simultaneous) | Gore – Tex Augmentation Materials, W.L. Gore Associates, West Palm Beach, FL, USA | 12 months | 64 (64) | Spline 3,75, Zimmer Dental, Carlsbad, CA, USA ReplaceTM RP, Nobel Biocare, Göteborg, Sweden (Rough) |
12 | 0.95 ± 0.21 |
| De Riu et al.47 | PROS | 15 (15) | Post. man/part. | ONLAY (Bone block) | Apposition of autologous bl. oss. (staged) | No membrane | 6 months | 60 (58) | Exacone implants; Leone, Firenze, Italy (Rough) | 18 | 1.40 ± 0.18 |
| Pieri et al.48 | PROS | 30 (29) | Ant. max./part. | ONLAY + res. memb. (Bone block) | Apposition of autologous bl. oss. + nat. coll. memb. (staged) | Bio-Gide®, Geistlich Biomaterials, Switzerland | 6 months | 29 (29) | OsseoSpeed, Astra Tech, Xive, Dentsply (Rough) | T1: 12 T2: 24 T3: 36 T4: 48 T5: 60 |
T1: 0.33 ± 0.26 T2: 0.40 ± 0.27 T3: 0.47 ± 0.28 T4: 0.54 ± 0.30 T5: 0.61 ± 0.33 |
| Mertens et al.49 | PROS | 15 (15) | Post. or ant. man or max/part. | ONLAY (Bone blocks) | Apposition of autologous bl. oss. (staged) | No membrane | 3 months | 99 (97) | OsseoSpeed™, Astra Tech AB, Mölndal, Sweden (Rough) | 28 (19–46 months) | 0.5 ± 0.6 |
| Pérez-Sayáns et al.50 | PROS | 14 (14) | Post. or ant. man or max/part. | DISTR (no graft) | Intrabone distractor (staged) | No membrane | 3 months | 50 (50) | Straumann® (Waldenburg, Switzerland); Frialit 2® (Friadent, Mannheim, Germany; Rough) |
T1: 12 T2: 36 |
T1: 0.66 ± 0.12 T2: 1.03 ± 0.22 |
| Kim et al.51 | RETR | 14 (14) | Post. or ant. man or max/part. | DISTR (no graft) | Intrabone distractor (staged) | No membrane | 3.7 months (3.1–8.4 months) | 41 (40) | Branemark implants, Nobel Biocare, Switzerland; US II implants, Osstem, Korea (Rough) |
85.2 ± 20.4 (62.4–124.8) | 2.6 ± 0.9 |
| 28 (28) | Post. or ant. man or max/part. | ONLAY (Bone block) | Apposition of autologous bl. oss. (staged) | No membrane | 6.2 months (5–8 months) | 61 (58) | Branemark implants, Nobel Biocare, Switzerland; Ankylos implants, Dentsply Friadent, Germany; US II implants, Osstem, Korea (Rough) |
98.4 ± 24.0 (67.2–146.4) | 2.3 ± 1.5 | ||
| Dottore et al.52 | RCT | 11 (11) | Post. mand./part. | INLAY (Particulate) | Interp. graft using ncHA part. (staged) | No membrane | 6 months | 22 (21) | ND (Rough) | 12 | 0.78 ± 0.82 |
| 11 (11) | Post. mand./part. | INLAY (Bone block) | Interp. autologous bl. oss. (staged) | No membrane | 6 months | 22 (21) | ND (Rough) | 12 | 1.02 ± 0.93 | ||
| Peñarrocha-Oltra et al.53 | RETR | 20 (20) | Post. mand./part. | ONLAY + res. memb. (Bone block) | Apposition of autologous bl. oss + nat. coll. memb. (staged) | Lyopstic, B. Braun | 6.8 months (range: 5–8 months) | 45 (43) | TSA implants with Aventblast surface, Phibo Dental Solutions (Rough) | 12 | 0.7 ± 1.1 |
| Boven et al.54 | RETR | 48 (40) | Post. or ant. man/tot. | ONLAY (Bone block) | Apposition of autologous bl. oss. (staged) | No membrane | 4 months | 80 (79) | Straumann implants, InstituteStraumann AG, Basel, Switzerland (Rough) | 79.2 ± 14.4 (60–108) | 0.6 ± 0.7 |
| Fontana et al.55 | RETR | 21 (21) | Post. mand./part. | GBR (partic.) | PTFE-e Ti-reinf. + autologous or homologous or autologous and homologous partic. (simultaneous or staged) | W. L. Gore & Associates, Flagstaff, AZ, USA | 5–9 months | 75 (8) | Branemark implants (Nobel Biocare, Goteborg, Sweden) | T1: 12 T2: 24 T3: 36 T4: 48 T5: 60 T6: 72 |
T1: 0.34 ± 0.72 T2: 0.72 ± 1.03 T3: 1.04 ± 1.26 T4: 0.94 ± 1.08 T5: 0.55 ± 0.73 T6: 0.60 ± 0.74 |
| Yu et al.56 | PROS | 21 (21) | Ant. Max./part. | SBB + res. memb. (Bone block + particulate) | Autologous block + autologous and heterologous partic. + nat. coll. memb. (staged) | Bio-Gide, Geistlich AG | 5.1 months | 21 (21) | Thommen Medical AG, Grenchen, Switzerland (Rough) | 73.08 ± 14.16 (48–96) | 0.77 ± 0.50 |
| Barone et al.57 | RETR | 10 (10) | Post. mand./part. | INLAY (Bone block) | Interp. equine bl. oss. + fibrine memb. (staged) | No brand | 4 months | 46 (46) | Intralock CT Spira Blossom (Rough) | 12 | 0.8 ± 0.3 |
| 10 (10) | Post. mand./part. | ONLAY (Bone block) | Apposition of autologous bl. oss. (staged) | No membrane | 4 months | 34 (34) | Intralock CT Spira Blossom (Rough) | 12 | 1.4 ± 0.4 | ||
| Park et al.58 | RETR | 12 (12) | Post. man/part. | ONLAY (Bone block) | Apposition of homologous bl. oss. (staged) | Bio-Gide, Geistlich Pharma, Wolhusen, Switzerland | 5.76 ± 2.73 months | 26 (26) | Dentium Implantium, Straumann Bone Level, Shinheug Luna, Osstem TSII (Rough) | 24 | 0.38 ± 0.64 |
| 11 (11) | Post. max/part. | GBR + res. memb. (Partic.) | Titanium mesh + heterologous partic. + nat. coll. memb. (staged) | CTi-Mem, Neo Biotech, Seoul, Korea Bio-Gide, Geistlich Pharma, Wolhusen, Switzerland | 5.76 ± 2.73 months | 18 (18) | Dentium Implantium, Straumann Bone Level, Shinheug Luna, Osstem TSII (Rough) | 24 | 0.43 ± 0.48 | ||
| Pieri et al.36 | RETR | 24 (22) | Post. mand./part. | ONLAY + res. mem. (Bone block) | Apposition of autologous bl. oss. + nat. coll. memb. (staged) | Bio-Gide, Geistlich Pharma, Wolhusen, Switzerland | 4–5 months | 51 (50) | Astra Tech OsseoSpeed, DENTSPLY Implants, Mannheim, Germany (Rough) | T1: 12 T2: 60 |
T1: 0.75 ± 0.68 T2: 1.61 ± 1.12 |
| Rokn et al.59 | RCT | 11 (10) | Post. mand./part. | Short implants (no augmentation) | Short implants (no surgery) | No membrane | 0 | 25 (25) | 4SI, SP, Institut Straumann AG, Basel, Switzerland (Rough) | 16 | 0.30 ± 0.34 |
| 11 (10) | Post. mand./part. | GBR (partic.) | Coll. nat. memb. + autologous and homologous partic. (staged) | Cenomembrane, Tissue regeneration Co, Iran | 6 months | 22 (22) | Straumann tissue-level, Standard Plus, Regular Neck, Roxolid and SLActive (Rough) | 16 | 0.47 ± 0.54 | ||
| Felice et al.60 | RCT | 30 (24) | Post. mand./part. | Short implants (no augmentation) | Short implants (no surgery) | No membrane | 5 months | 60 (55) | Zimmer-Biomet implants (Rough) | T1: 12 T2: 36 T3: 60 T4: 96 |
T1: 1.00 ± 0.36 T2: 1.24 ± 0.36 T3: 1.49 ± 0.40 T4: 1.58 ± 0.46 |
| 30 (23) | Post. mand./part. | INLAY (Bone block) | Interp. bovine bl. oss. + coll. nat. memb. (staged) | Bio-Gide, Geistlich Pharma, Wolhusen, Switzerland | 5 months | 61 (58) | Zimmer-Biomet implants (Rough) | T1: 12 T2: 36 T3: 60 T4: 96 |
T1: 1.00 ± 0.31 T2: 1.76 ± 0.72 T3: 2.34 ± 0.75 T4: 2.46 ± 0.80 |
||
| Bolle et al.61 | RCT | 20 (20) | Post. mand./part. | Short implants (no augmentation) | Short implants (no surgery) | No membrane | 0 | 43 (41) | TwinKon Universal SA2; Global-D (Rough) | 12 | 0.51 ± 0.04 |
| 20 (18) | Post. mand./part. | INLAY (Bone block) | Interp. equine bl. oss. + pericardium memb. (staged) | OsteoBiol Evolution, Tecnoss, Fine 30 × 30 mm | 4 months | 46 (45) | TwinKon Universal SA2; Global-D (Rough) | 12 | 0.77 ± 0.04 | ||
| Chiapasco et al.62 | RETR | 72 (63) | Post. or ant. man or max/part. and tot. | ONLAY + res. memb. (Bone block) | Apposition of autologous bl. oss. + nat. coll. memb. (staged) | Bio-Gide®, Geistlich Biomaterials, Switzerland | 4–9 months | 330 (323) | Straumann® Bone Level Tapered, Straumann® GmbH, Basel, Switzerland; Straumann® Tissue Level (Straumann® GmbH, Basel, Switzerland); Astra Tech Implant System (Astra Tech, Mölndal, Sweden) (Rough) |
97.2 (36–228) | 1.11 ± 1.14 |
| Marconcini et al.63 | PROS | 23 (20) | Post. mand./part. | INLAY (Bone block) | Interp. equine bl. oss. + heterologous partic. + platelet concentrate (staged) | No brand | 4 months | 91 (82) | DT, Intralock International (Rough) | T1: 12 T2: 24 T3: 36 |
T1: 0.63 ± 0.37 T2: 0.91 ± 0.35 T3: 1.06 ± 0.37 |
| Khoury et al.25 | PROS | 142 (118) | Post. max./part. | SBB (Bone block + partic.) | Autologous block + autologous partic. (staged) | No membrane | 3 months | 356 (306) | XiVE Implants (Dentsply Sirona Implants; Rough) | T1: 12 T2: 36 T3: 60 T4: 120 |
T1: 0.21 ± 0.18 T2: 0.26 ± 0.21 T3: 0.32 ± 0.19 T4: 0.63 ± 0.32 |
| Geng et al.64 | RETR | 63 (63) | Post. or ant. man/part. or tot | INLAY (Partic.) | Interp. equine bl. oss. + fibrine memb. (staged) | Bio-Gide, Geistlich Biomaterials, Wolhusen, Switzerland | 5 months | 220 (213) | ND | T1: 30 T2: 54 T3: 138 |
T1: 0.76 ± 0.74 T2: 1.09 ± 1.38 T3: 1.14 ± 0.81 |
| Felice et al.65 | RCT | 20 (12) | Post. mand./part. | Short implants (no augmentation) | Short implants (no surgery) | No membrane | 0 | 41 (39) | Southern implants, Irene, South Africa (Rough) | T1: 12 T2: 36 T3: 60 |
T1: 1.05 ± 0.06 T2: 1.25 ± 0.35 T3: 1.34 ± 0.35 |
| 20 (12) | Post. mand./part. | INLAY (Bone block) | Interp. equine bl. oss. + pericardium memb. (staged) | OsteoBiol Evolution, Tecnoss, Fine 30 × 30 mm | 3 months | 47 (44) | Southern implants, Irene, South Africa (Rough) | T1: 12 T2: 36 T3: 60 |
T1: 1.07 ± 0.06 T2: 1.54 ± 0.14 T3: 2.11 ± 0.59 |
||
| Felice et al.66 | RCT | 15 (10) | Post. mand./part. | Short implants (no augmentation) | Short implants (no surgery) | No membrane | 0 | 26 (21) | EZ Plus MegaGen implants (Rough) | T1: 12 T2: 36 T3: 60 |
T1: 1.20 ± 0.49 T2: 1.44 ± 0.44 T3: 1.72 ± 0.57 |
| 15 (10) | Post. mand./part. | INLAY (Bone block) | Interp. bovine bl. oss. + coll. nat. memb. (staged) | Bio-Gide, Geistlich Pharma, Wolhusen, Switzerland | 4 months | 30 (29) | EZ Plus MegaGen implants (Rough) | T1: 12 T2: 36 T3: 60 |
T1: 1.20 ± 0.47 T2: 1.68 ± 0.5 T3: 2.10 ± 0.61 |
||
| Esposito et al.67 | RCT | 20 (14) | Post. mand./part. | Short implants (no augmentation) | Short implants (no surgery) | No membrane | 0 | 32 (31) | ExFeel, MegaGen implants, Gyeongbuk, South Korea (Rough) | T1: 12 T2: 36 T3: 60 |
T1: 0.94 ± 0.22 T2: 1.10 ± 0.25 T3: 1.22 ± 0.27 |
| 20 (10) | Post. mand./part. | INLAY (Bone block) | Interp. equine bl. oss. + pericardium memb. (staged) | OsteoBiol Evolution, Tecnoss, Fine 30 × 30 mm | 3 | 31 (29) | ExFeel, MegaGen implants, Gyeongbuk, South Korea (Rough) | T1: 12 T2: 36 T3: 60 |
T1: 1.03 ± 0.31 T2: 1.39 ± 0.40 T3: 1.70 ± 0.46 |
||
| Chiapasco et al.68 | RETR | 75 (67) | Post. or ant. man or max/part. | ONLAY + resorbable membrane (Bone block) | Apposition of autologous bl. oss. + nat. coll. memb. (staged) | Bio-Gide®, Geistlich Biomaterials, Switzerland | 6 months | 182 (157) | ND | 120 (36-192) | 1.06 ± 1.19 |
| Pistilli et al.69 | RETR | 58 (27) | Post. or ant. man/part. | GBR (partic.) | PTFE-e Ti-reinf. memb. + autologous and heterologous partic. (simultaneous or staged) | Cytoplast, De Ore | 9 months | 122 (120) | In Kone, Global D | T1: 36 T2: 60 T3: 84 |
T1: 1.27 ± 0.62 T2: 1.55 ± 0.82 T3: 1.72 ± 1.03 |
| Cucchi et al.70 | RCT | 20 (16) | Post. Mand./part. | GBR (partic.) | PTFE-d Ti-reinf. Memb. + autologous and homologous partic (simultaneous) | Cytoplast Ti-250XL; Osteogenics Biomedical | 9 months | 46 (46) | BT SAFE kr, BTK, BIOTEC (Rough) | 12 | 0.67 ± 0.30 |
| 20 (14) | Post. Mand./part. | GBR + res.memb. (Partic.) | Titanium mesh + cross-linked memb + autologous and homologous partic. (simultaneous) | Trinon Titanium; Karlsruhe, Germany | 9 months | 36 (36) | BT SAFE kr, BTK, BIOTEC (Rough) | 12 | 0.61 ± 0.28 |
- Abbreviations: ant: anterior; CCT, controlled clinical trial; coll, collagen; Interp: interpositional; mand: mandible; max, maxilla; memb, membrane; nat, native; part, partial; partic, particulate; post, posterior; PROS: prospective cohort study; RCT, randomized clinical trial; res, resorbable; RETR, retrospective cohort study; tot, total.
2.5 Quality assessment and risk of bias
The RCTs were qualitatively assessed following the recommendations of the Revised Cochrane risk-of-bias tool for randomized trials (RoB 2), based on the following criteria: risk of bias arising from the randomization process, risk of bias due to deviations from the intended interventions (effect of assignment to intervention), risk of bias due to missing outcome data, risk of bias in measurement of the outcome, risk of bias in selection of the reported result. Each bias of each study was evaluated as follows: positive (+, green code), negative (−, red code), and doubtful (?, yellow code).
The nonrandomized and observational studies were qualitatively assessed following the New Castle-Ottawa scale (NOS).71 This scale comprises three categories: selection of study groups, comparability of participants, and outcome. For the first category, the maximum score is four points, for the second two points, and for the last category three points.
Consequently, these studies can reach a score ranging from 1 to 9 points.
2.6 Statistical analysis
The statistical analysis was conducted by two different operators (SM and FA). A traditional pairwise MA was carried out to analyze primary and secondary outcomes from all the included studies.
Meta-analyses were conducted only on outcomes that had data from at least two studies, since a minimum of two data are required for each outcome to reach a mean value and statistical significance in a MA.72
Therefore, to reduce the risk of bias due to nonrandomized or noncontrolled or retrospective design of the studies and to have a higher level of evidence, two adjunctive pairwise MA were performed: the first including both RCT studies and prospective cohort studies; and the latter including only RCT studies.
2.6.1 Pairwise MA
The pairwise MA was performed using STATA software (ver. 17.1 SE). The statisticians computed pooled mean differences (MDs) or proportions (after Freeman–Tukey double arcsine transformation), as appropriate, with their corresponding 95% CIs using DerSimonian and Laird random-effects model. Statistical heterogeneity was assessed by using the I2 statistic, which represents the amount of between-study variability due to heterogeneity rather than sampling error.
Where information about more than one time point was available, the authors pooled final estimates from each included study in order to avoid data duplication. Similarly, for the MA of PBL values according to the time interval after the intervention (short-, medium-, long-, and overall), for each study, we included the latest estimate available for each time interval. In addition, we assessed the occurrence of publication bias by using funnel plots and Egger's test for each outcome.
2.6.2 Meta-regression
A meta-regression was carried out using DerSimonian and Laird random-effects model, to investigate whether several factors, including follow-up time, jaw of interest, study design, implant connection, and VBG—that is related to baseline defect size—were associated with PBL. In particular, each potential moderator was evaluated separately (i.e., they were included one by one in separate models), only for techniques with at least 10 studies reporting relevant estimates.
3 RESULTS
3.1 Study selection
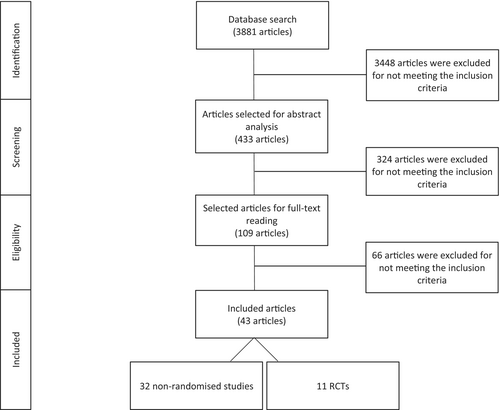
The electronic search identified 3881 publications from 1996 to 2021. Five more articles were added after the manual search. Overall, 433 articles were considered suitable for abstract screening, 324 of which were excluded. Hence, 109 articles were judged eligible for full-text assessment and then 66 articles were excluded because they did not meet the inclusion criteria. Finally, 43 studies were included and subjected to data extraction (Graph 1). The reasons for excluding the remaining articles during this phase are described in Table A5.
3.2 Study characteristics
The methodological characteristics of the included studies are described in Table 1.
Among the 43 included studies, 11 were RCTs, 15 were prospective cohort studies, and 17 were retrospective cohort studies.
All studies, as stated in the main purpose, evaluate the PBL after a follow-up period for implants placed in vertically augmented bone: 14 studies involved GBR, 14 inlay graft, 13 onlay graft, 4 distraction osteogenesis, and 2 SBB. Summarized data are given in Table 2.
| VRA technique | Study design | Number of patients | Number of implants | |
|---|---|---|---|---|
| GBR | 14 studies | 4 RCT 3 PROS 7 RETR |
Baseline: 320 Final: 275 |
Baseline: 779 Final: 635 |
| INLAY | 14 studies | 7 RCT 3PROS 4RETR |
Baseline: 321 Final: 277 |
Baseline: 1408 Final: 1019 |
| ONLAY | 13 studies | 1 RCT 4 PROS 8 RETR |
Baseline: 389 Final: 362 |
Baseline: 1177 Final: 1086 |
| DISTR | 4 studies | 3 PROS 1 RETR |
Baseline: 75 Final: 74 |
Baseline: 263 Final: 162 |
| SBB | 2 studies | 2 PROS | Baseline: 163 Final: 139 |
Baseline: 377 Final: 327 |
| Overall | 43 studies | 11 RCT 15 PROS 17 RETR |
Baseline: 1268 Final: 1127 |
Baseline: 4004 Final: 3229 |
- Abbreviations: CCT, controlled clinical trial; PROS, prospective study; RCT, randomized clinical trial; RETR, retrospective study; VRA, vertical ridge augmentation.
Finally, in the statistical analysis, two articles43, 44 were included as a singular study as they reported data from the same sample.
To assess the PBL, the studies mainly adopted intraoral radiographs (n = 36, 84.6%,) and the remaining studies used panoramic radiographs (n = 7, 15.4%).
During the data collection, only some authors replied to the e-mails sent to collect missing data.37, 50, 58, 62, 64, 73
A total of 1268 patients, receiving 4004 implants were included. There were 141 dropouts with 775 implants. Consequently, the results of 88.9% of patients (n = 1127) and 80.6% of implants (n = 3229) were analyzed at the last follow-up time. Otherwise, all the included studies had a mean drop-out rate of 8.14%.
The mean follow-up period was 41.0 ± 27.8 months (median = 36 months, range: 12–120).
With regard to the timing of implant placement, 80.7% of implants were placed after bone augmentation (staged or delayed approach), whereas 19.3% were placed simultaneously (immediate or simultaneous approach).
3.3 Quality assessment of selected studies
Eleven RCTs were evaluated using Cochrane tools (Table 3). According to these new tools, no studies were classified as high risk of bias; three were classified as low risk of bias43, 44, 70; and eight were classified as moderate risk of bias.42, 52, 59-61, 65-67
| Randomization process | Deviations from the intended interventions (effect of assignement to intervention) | Deviations from the intended interventions (effect of adhering to intervention) | Missing outcome data | Measurement of the outcome | Selection of the reported result | Overall bias | |
|---|---|---|---|---|---|---|---|
| 42 | ? | + | + | + | + | + | ? |
| 52 | + | ? | ? | + | + | + | ? |
| 43, 44 | + | + | + | + | + | + | + |
| 61 | + | ? | ? | + | + | + | ? |
| 60 | + | ? | ? | + | + | + | ? |
| 59 | + | ? | ? | + | + | + | ? |
| 65 | + | ? | ? | + | + | + | ? |
| 66 | + | ? | ? | + | + | + | ? |
| 67 | + | ? | ? | + | + | + | ? |
| 70 | + | + | + | + | + | + | + |
- Note: +, positive; ?, doubtful; −, negative.
- Abbreviation: RCTs, randomized clinical trials.
A total of 32 nonrandomized studies were evaluated using the NOS (Table 4). A mean value of 2.1 out of 4 was achieved for the “Selection” section; “Comparability” could only be evaluated in 4 studies with a mean value of 1 out of 2; a mean value of 2.4 out of 3 was obtained for the “Exposure/Outcome” section. The mean score was 5.6 out of 9, confirming the moderate quality of these studies.
| Author and pubblication year | Quality classification | Selection | Comparability | Exposure/Outcome |
|---|---|---|---|---|
| Simion et al.30 | High | ★★ | ★ | ★★★ |
| Nyström et al.31 | Low | ★★ | NA | ★ |
| Chiapasco et al.32 | High | ★★★ | NA | ★★ |
| Hallman et al.33 | High | ★★ | NA | ★★★ |
| Polo et al.34 | Low | ★★ | NA | ★ |
| Chiapasco et al.35 | Moderate | ★★ | NA | ★★ |
| Pieri et al.74 | Moderate | ★★ | NA | ★★ |
| Marchetti et al.37 | High | ★★★ | NM | ★★★ |
| Canullo et al.38 | High | ★★★ | NA | ★★ |
| Urban et al.39 | Moderate | ★★ | NA | ★★ |
| Corinaldesi et al.40 | High | ★★ | NA | ★★★ |
| Nyström et al.41 | Low | ★★ | NA | ★ |
| Canullo et al.45 | High | ★★★ | NA | ★★ |
| Todisco46 | High | ★★★ | NA | ★★ |
| De Riu et al.47 | Moderate | ★★ | NA | ★★ |
| Pieri et al.48 | Moderate | ★★ | NA | ★★ |
| Mertens et al.49 | Moderate | ★★ | NA | ★★ |
| Pérez-Sayáns et al.50 | Moderate | ★★ | NA | ★★ |
| Kim et al.51 | Moderate | ★★ | ★ | ★★ |
| Peñarrocha-Oltra et al.53 | Moderate | ★★ | NA | ★★ |
| Boven et al.54 | Low | ★ | NA | ★★ |
| Fontana et al.55 | High | ★★ | NA | ★★★ |
| Yu et al.56 | High | ★★ | NA | ★★★ |
| Barone et al.73 | Moderate | ★★ | ★ | ★★ |
| Park et al.58 | Low | ★ | ★ | ★★ |
| Pieri et al.36 | High | ★★ | NA | ★★★ |
| Chiapasco et al.62 | High | ★★ | NA | ★★★ |
| Marconcini et al.63 | Moderate | ★★ | NA | ★★★ |
| Khoury et al.25 | High | ★★★ | NA | ★★ |
| Geng et al.64 | Moderate | ★★ | NA | ★★ |
| Chiapasco et al.68 | High | ★★ | NA | ★★★ |
| Pistilli et al.69 | High | ★★ | NA | ★★★ |
- Note: High, high-quality study; moderate, moderate-quality study; low, low-quality study.
3.4 Pairwise MA—All studies
3.4.1 Primary outcome: PBL over time
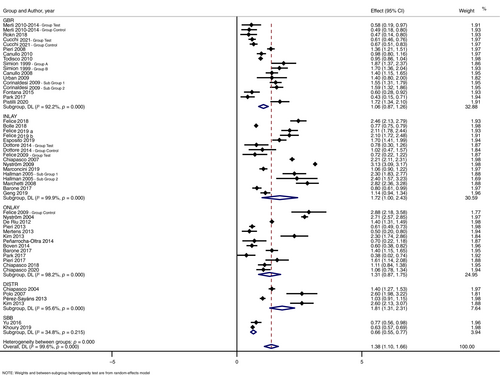
Considering all 42 included studies, the weighted mean estimate (WME) of PBL values was 1.38 mm (CI: 1.10–1.66) after a mean follow-up of 41.0 ± 27.8 months (median 36 months; range: 12–120 months). Complete data for each technique were reported in Table 5.
| Follow-up period | VRA techniques | No. studies | No. patients | No. implants | Weight mean esitmate (mm) | 95% CI (mm) | p-Value | Heterogeneity (I2) (%) | p-Value (heterogeneity) |
|---|---|---|---|---|---|---|---|---|---|
| Overall | GBR | 14 | 320 | 779 | 1.08 | 0.88–1.27 | <0.001 | 92.0 | <0.001 |
| INLAY | 14 | 321 | 1408 | 1.78 | 1.09–2.47 | <0.001 | 99.9 | <0.001 | |
| ONLAY | 13 | 389 | 1177 | 1.31 | 0.87–1.75 | <0.001 | 98.2 | <0.001 | |
| DISTR | 4 | 75 | 263 | 1.81 | 1.31–2.31 | <0.001 | 95.6 | <0.001 | |
| SBB | 2 | 163 | 377 | 0.66 | 0.55–0.77 | <0.001 | 34.8 | 0.215 | |
| Overall | 43 | 1268 | 4004 | 1.41 | 1.13–1.69 | <0.001 | 99.6 | <0.001 | |
| Short term | GBR | 8 | 315 | 756 | 0.76 | 0.56–0.97 | <0.001 | 90.6 | <0.001 |
| INLAY | 10 | 321 | 1206 | 1.08 | 0.60–1.55 | <0.001 | 99.9 | <0.001 | |
| ONLAY | 6 | 389 | 1156 | 0.99 | 0.52–1.46 | <0.001 | 98.3 | <0.001 | |
| DISTR | 3 | 75 | 258 | 1.11 | 0.72–1.50 | <0.001 | 95.0 | <0.001 | |
| SBB | 1 | 163 | 355 | — | — | — | — | — | |
| Overall | 27 | 1263 | 3731 | 0.95 | 0.69–1.22 | <0.001 | 99.7 | <0.001 | |
| Medium term | GBR | 10 | 234 | 552 | 1.12 | 0.89–1.35 | <0.001 | 87.8 | <0.001 |
| INLAY | 9 | 257 | 1058 | 1.50 | 0.75–2.25 | <0.001 | 99.6 | <0.001 | |
| ONLAY | 6 | 293 | 1035 | 1.38 | 0.38–2.17 | <0.001 | 99.3 | <0.001 | |
| DISTR | 2 | 65 | 191 | 1.21 | 0.85–1.58 | <0.001 | 94.2 | <0.001 | |
| SBB | 1 | 163 | 355 | — | — | — | — | — | |
| Overall | 26 | 1012 | 3191 | 1.27 | 0.83–1.72 | <0.001 | 99.7 | <0.001 | |
| Long term | GBR | 6 | 152 | 233 | 1.13 | 0.71–1.55 | <0.001 | 91.1 | <0.001 |
| INLAY | 9 | 216 | 758 | 2.13 | 1.62–2.64 | <0.001 | 98.8 | <0.001 | |
| ONLAY | 7 | 270 | 825 | 1.42 | 0.62–2.23 | 0.001 | 99.0 | <0.001 | |
| DISTR | 1 | 14 | 40 | 2.60 | 2.13–3.07 | — | — | — | |
| SBB | 2 | 139 | 327 | 0.66 | 0.55–0.77 | <0.001 | 34.8 | 0.215 | |
| Overall | 24 | 791 | 2183 | 1.62 | 1.13–2.10 | <0.001 | 99.6 | <0.001 |
- Abbreviation: VRA, vertical ridge augmentation.
The lowest pooled PBL value was found for SBB (WME: 0.66 mm, CI: 0.55–0.77, n studies = 2) over a mean period of 65.0 ± 11.4 months (median 65.04—range: 12–120 months). All other techniques showed similar values compared with the mean values, without significant statistical differences, except for GBR showing a lower pooled PBL value (WME: 1.06 mm, CI: 0.87–1.26) with respect to Distraction Osteogenesis (WME: 1.81 mm, CI: 1.31–2.31).
The Forest plot related to overall PBL is shown in Figure 1.
3.4.2 PBL at short-term follow-up
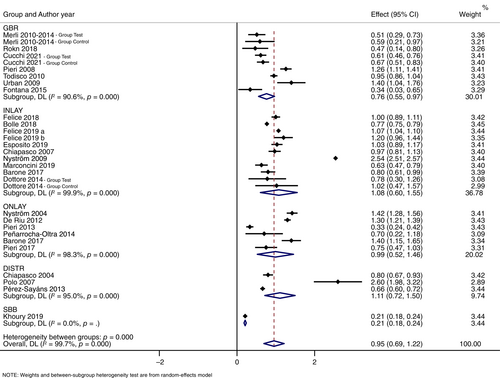
A total of 26 studies reported PBL values after a short-term follow-up with a WME of 0.95 mm (CI: 0.69–1.22). Among these studies, 10 evaluated PBL values around 1206 implants after inlay graft, 8 evaluated PBL values for 756 implants after GBR, 6 evaluated PBL values around 1156 implants after onlay graft, 3 evaluated PBL values around 258 implants after DISTR, and only one evaluated PBL values around 355 implants after SBB and. Complete data about the number of patients and implants for each technique are given in Table 5.
After a short-term follow-up, similar PBL values were observed for GBR (WME: 0.76 mm; Cl: 0.56–0.97), onlay graft (WME: 0.99 mm; CI: 0.52–1.46), inlay graft (WME: 1.08 mm; Cl: 0.60–1.55) and distraction osteogenesis (WME: 1.11 mm; CI: 0.72–1.50). Only one study reported results on SBB,25 with a PBL value of 0.21 ± 0.18 mm, lower than all other techniques included in the MA. Forest plots are shown in Figure 2F.
3.4.3 PBL at medium-term follow-up
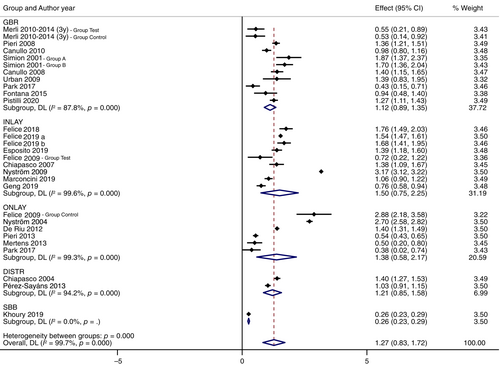
A total of 26 studies reported PBL values after a medium-term follow-up with a WME of PBL of 1.27 mm (CI: 0.83–1.72). Among these studies, 10 evaluated PBL values around 552 implants after GBR, 9 evaluated PBL values for 1058 implants after inlay graft, 6 evaluated PBL values around 1035 implants after onlay graft, 2 evaluated PBL values around 191 implants after DISTR, and only one evaluated PBL values around 355 implants after SBB. Complete data about the number of patients and implants for each technique were reported in Table 5.
At medium-term follow-up, similar PBL values were reported for the different techniques: GBR (WME: 1.12 mm; CI: 0.89–1.35), DISTR (WME: 1.21 mm; CI: 0.85–1.58), onlay graft (WME = 1.38 mm; CI: 0.58–2.17), and inlay graft (WME: 1.50 mm; CI: 0.75–2.25). No significant differences were observed, except for SBB. Similarly, to the results after a short follow-up, Khoury et al.25 was the only study reporting data on SBB, with a value of PBL of 0.26 ± 0.21 mm, again lower than all other techniques. Forest plots were reported in Figure 3.
3.4.4 PBL at long-term follow-up
A total of 24 studies reported PBL values after a long-term follow-up with a pooled PBL of 1.62 mm (CI: 1.13–2.10). Among these studies, 9 evaluated PBL values around 758 implants after inlay graft, 7 evaluated PBL values around 825 implants after onlay graft, 6 evaluated PBL values around 233 implants after GBR, 2 evaluated PBL values around 327 implants after SBB, and only one evaluated PBL values around 40 implants after DISTR. Complete data about the number of patients and implants for each technique are given in Table 5.
As opposed to short- and medium-term follow-up, in the long-term follow-up similar pooled PBL values were observed between SBB (WME: 0.56 mm; CI: 0.30–0.82), GBR (WME: 1.11 mm; CI: 0.76–1.47) and onlay graft (WME: 1.59 mm; CI: 0.80–2.37). However, the PBL values of SBB and GBR were significantly lower than those for inlay graft (WME: 1.99 mm; Cl: 1.66–2.32); while no significant differences were observed between Inlay and Onlay (Graph 2). Only one study reported results on DISTR giving a mean PBL value of 2.6 ± 0.9 mm.51 Forest plots are shown in Figure 4.


3.4.5 Secondary outcomes
Of the 43 included studies reporting data about PBL over time, none provided all secondary outcomes analyzed in this systematic review (VBG, HCR, SCR, SURV, SUCC, PROMs, PPD, GI, or BI, Mucositis and Peri-implantitis). These parameters have not been assessed in each single study and data analysis was not appropriate for all the variables. The authors agreed to report only data related to VBG, HCR, SCR, SURV, and SUCC after MA. Details about all secondary outcomes are described in Tables 6 and 7.
| Outcomes | VRA techniques | No. studies | Weight mean estimate (%) | 95% CI | p-Value | Heterogeneity (I2) (%) | p-Value (heterogeneity) |
|---|---|---|---|---|---|---|---|
| Surgical complications | GBR | 5 | 14.6 | 7.7–22.9 | <0.01 | 15.6 | 0.32 |
| INLAY | 9 | 41.6 | 31.2–52.3 | <0.01 | 59.6 | 0.01 | |
| ONLAY | 8 | 5.1 | 2.0–9.4 | <0.01 | 31.5 | 0.17 | |
| DISTR | 0 | — | — | — | — | — | |
| SBB | 1 | — | — | — | — | — | |
| Overall | 23 | 19.4 | 11.5–28.5 | <0.01 | 87.7 | <0.01 | |
| Healing complications | GBR | 13 | 15.0 | 9.3–21.7 | <0.01 | 48.2 | 0.02 |
| INLAY | 11 | 13.8 | 8.1–20.6 | <0.01 | 41.8 | 0.07 | |
| ONLAY | 10 | 13.6 | 7.4–21.0 | <0.01 | 55.0 | 0.02 | |
| DISTR | 3 | 43.0 | 2.2–90.6 | 0.02 | — | — | |
| SBB | 2 | 6.8 | 3.3–11.1 | <0.01 | — | — | |
| Overall | 36 | 15.9 | 11.7–20.4 | <0.01 | 68.2 | <0.01 | |
| Vertical bone gain | GBR | 12 | 4.43 | 3.88–4.98 | <0.01 | 89.4 | <0.01 |
| INLAY | 4 | 5.81 | 5.41–6.20 | <0.01 | 77.2 | 0.02 | |
| ONLAY | 6 | 5.06 | 2.84–7.29 | <0.01 | 99.0 | <0.01 | |
| DISTR | 3 | 7.50 | 4.01–0.99 | <0.01 | 96.0 | <0.01 | |
| SBB | 2 | 6.64 | 4.78–8.50 | <0.01 | 95.7 | <0.01 | |
| Overall | 24 | 5.17 | 4.60–5.73 | <0.01 | 97.6 | <0.01 | |
| Implant survival | GBR | 14 | 99.9 | 99.3–100.0 | <0.01 | 95.6 | 0.76 |
| INLAY | 14 | 94.6 | 92.2–96.6 | <0.01 | 56.5 | 0.03 | |
| ONLAY | 13 | 97.1 | 92.9–99.7 | <0.01 | 88.4 | <0.01 | |
| DISTR | 4 | 99.2 | 95.6–100.0 | <0.01 | 59.8 | 0.06 | |
| SBB | 2 | 99.5 | 98.2–100.0 | <0.01 | — | — | |
| Overall | 43 | 97.9 | 96.6–99.0 | <0.01 | 77.8 | <0.01 | |
| Implant success | GBR | 10 | 98.2 | 94.1–100.0 | <0.01 | 81.7 | <0.01 |
| INLAY | 8 | 83.6 | 74.4–91.1 | <0.01 | 90.4 | <0.01 | |
| ONLAY | 8 | 89.1 | 81.6–94.9 | <0.01 | 83.6 | <0.01 | |
| DISTR | 2 | 94.1 | 90.0–97.3 | <0.01 | — | — | |
| SBB | 0 | — | — | — | — | — | |
| Overall | 25 | 92.2 | 88.3–95.5 | <0.01 | 89.0 | <0.01 |
- Abbreviation: VRA, vertical ridge augmentation.
| Author and pubblication year | SCR (%) | HCR (%) | VBG (mm) | SURV (%) | SUCC (%) |
|---|---|---|---|---|---|
| Simion et al.30 | NM | 18.2 | NM | 100.0 | 100 |
| NM | 18.8 | NM | 100.0 | 100 | |
| Nyström et al.31 | NM | NM | NM | 72.8 | 72.8 |
| Chiapasco et al.32 | NM | 8.1 | 9.9 ± 3.4 | 100.0 | 94.2 |
| Hallman et al.33 | NM | NM | NM | 87.0 | 70 |
| NM | NM | NM | 94.5 | 52 | |
| Polo et al.34 | NM | NM | 4.2 ± 1.9 | 94.1 | NM |
| Chiapasco et al.35 | 33.3 | 7.7 | NM | 94.5 | 82.9 |
| Pieri et al.74 | 6.3 | 6.3 | 3.71 ± 1.24 | 100.0 | 93.2 |
| Marchetti et al.37 | NM | 16.7 | NM | 89.4 | 67.3 |
| Canullo et al.38 | NM | 10.0 | 5.3 ± 1.9 | 100.0 | 100 |
| Urban et al.39 | NM | 2.8 | 5.5 ± 2.29 | 100.0 | 94.7 |
| Corinaldesi et al.40 | NM | 23.1 | 5.45 ± 1.81 | 100.0 | 100 |
| NM | 9.1 | 4.50 ± 1.16 | 100.0 | 91 | |
| Nyström et al.41 | NM | NM | NM | 85.0 | NM |
| Felice et al.75 | 40.0 | 10.0 | NM | 100.0 | 90 |
| 20.0 | 20.0 | NM | 100.0 | 86.9 | |
| Merli et al.43, 44 | NM | 36.4 | 2.16 ± 1.51 | 100.0 | 100 |
| NM | 45.4 | 2.48 ± 1.13 | 100.0 | 100 | |
| Canullo et al.45 | NM | 5.0 | 5.61 ± 1.45 | 100.0 | NM |
| Todisco46 | NM | 10.0 | 5.2 ± 1.5 | 100.0 | NM |
| De Riu et al.47 | 13.3 | 6.6 | 3.77 ± 0.88 | 95.0 | NM |
| Pieri et al.48 | 3.3 | 10.0 | 1.71 ± 0.75 | 100.0 | 100 |
| Mertens et al.49 | NM | 13.3 | NM | 97.9 | 95.7 |
| Pérez-Sayáns et al.50 | NM | 85.7 | NM | 100.0 | NM |
| Kim et al.51 | NM | 42.9 | 8.4 ± 2.6 | 97.3 | 92.7 |
| NM | 28.6 | 6.5 ± 2.3 | 94.1 | 90.2 | |
| Dottore et al.52 | NM | NM | 7.0 ± 2.6 | 95.5 | 90.9 |
| NM | NM | 6.5 ± 1.6 | 95.5 | 90.9 | |
| Peñarrocha-Oltra et al.53 | 5.0 | 25.0 | NM | 95.6 | 91.1 |
| Boven et al.54 | 8.3 | NM | 6.5 ± 2.4 | 98.7 | NM |
| Fontana et al.55 | NM | 23.8 | 4.02 ± 1.53 | 93.6 | 71.9 |
| Yu et al.56 | NM | 33.4 | 5.7 ± 1.09 | 100.0 | NM |
| Barone et al.73 | NM | 20.0 | 6.0 ± 0.7 | 100.0 | 93.8 |
| NM | 30.0 | 7.4 ± 0.8 | 100.0 | 82.4 | |
| Park et al.58 | NM | NM | 4.54 ± 2.48 | 100.0 | NM |
| NM | NM | 3.90 ± 0.85 | 100.0 | NM | |
| Pieri et al.36 | 12.5 | 20.8 | NM | 95.5 | NM |
| Rokn et al.59 | NM | 0.0 | NM | 100.0 | 100 |
| 27.3 | 45.5 | NM | 100.0 | 100 | |
| Felice et al.60 | 6.9 | 0.0 | NM | 91.7 | NM |
| 53.3 | 23.3 | NM | 95.1 | NM | |
| Bolle et al.61 | 5.0 | 0.0 | NM | 95.4 | NM |
| 25.0 | 10.0 | NM | 97.9 | NM | |
| Chiapasco et al.62 | 1.4 | 8.3 | NM | 98.5 | NM |
| Marconcini et al.63 | 35.0 | 8.7 | 5.6 ± 0.8 | 95.5 | 90.9 |
| Khoury et al.25 | 2.1 | 5.4 | 7.6 ± 3.4 | 98.7 | NM |
| Geng et al.64 | 28.6 | 30.2 | 5.4 ± 0.2 | 96.7 | 95.3 |
| Felice et al.65 | 0.0 | 5.0 | NM | 95.1 | NM |
| 35.0 | 15.0 | NM | 93.6 | NM | |
| Felice et al.66 | 40.0 | 13.3 | NM | 92.3 | NM |
| 66.7 | 0.0 | NM | 96.7 | NM | |
| Esposito et al.67 | 40.0 | 5.0 | NM | 96.9 | NM |
| 70.0 | 15.0 | NM | 93.5 | NM | |
| Chiapasco et al.68 | 4.0 | 4.0 | NM | 98.1 | 85.2 |
| Pistilli et al.69 | 20.7 | 6.9 | 6.03 ± 1.09 | 98.4 | NM |
| Cucchi et al.70 | 5.0 | 15.0 | 4.2 ± 1.0 | 100.0 | 100 |
| 15.8 | 21.1 | 4.1 ± 1.0 | 100.0 | 100 |
- Abbreviations: HCR, healing complications rate; NM, parameter not measured. SCR, surgical complications rate; SUCC, success rate; SURV, survival rate; VBG, vertical bone gain.
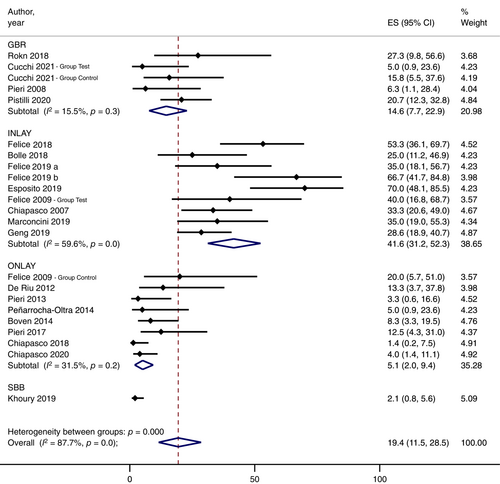
The rate of surgical complications was evaluated in 23 studies with a pooled value of 19.4% (CI: 11.5%–28.5%). Onlay graft (WME: 5.1%; CI: 2.0–9.4) showed lowest SCR; while, inlay graft (WME: 41.6%; Cl: 31.2–52.3) had the highest SCR compared with both onlay graft and GBR (WME: 14.6%; CI: 7.7–22.9). No MA was carried out for DISTR (no data available) and SBB (data were available from only one article25). Forest plots are shown in Figure 5.
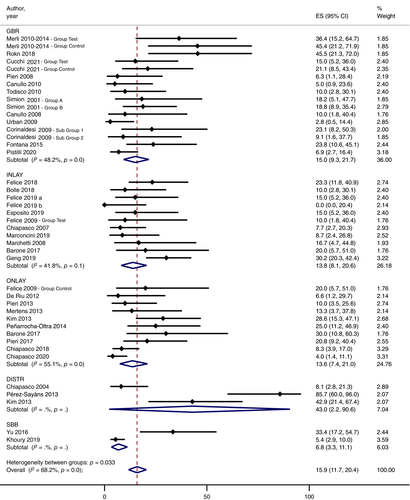
The rate of healing complications was assessed in 35 studies with a pooled value of 15.9% (CI: 11.7–20.4). The analysis showed similar values for all the techniques investigated, though SBB tended to have the lowest rate of complications (WME: 6.80%; CI: 3.3–11.1). Moreover, seven studies31, 33, 34, 42, 52, 54, 58, 76 did not report complications during the healing period. The Forest plot is shown in Figure 6.
Regarding VBG, the values reported in 23 studies provided a pooled value of 5.26 mm (CI: 4.73–5.79). The analysis of VBG showed similar values for DISTR (WME: 7.50 mm; Cl: 4.01–10.99), SBB (WME: 6.64 mm; CI: 4.78–8.50), inlay graft (WME: 5.81 mm; 95% Cl: 5.41–6.20), onlay graft (WME: 5.06 mm; CI: 2.84–7.29), and GBR (WME: 4.43 mm; CI: 3.88–4.98). The Forest plot is shown in Figure 7.

Considering the overall values of the PBL/VBG ratio, SBB reported the lowest coefficient of 0.09 (n = 2); inlay had a coefficient of 0.15 (n = 5), GBR and Onlay showed a similar value of 0.22 but a different number of studies (n = 14 and n = 6, respectively), and finally DISTR reported the highest coefficient of 0.35 (n = 3). All data related to the overall PBL/VBG ratio and respective values in each follow-up period are listed in Table 8.
| Group | No. studies | Mean | SD | 95% CI |
|---|---|---|---|---|
| Overall | ||||
| DISTR | 3 | 0.35 | 0.25 | −0.29; 0.98 |
| GBR | 14 | 0.23 | 0.07 | 0.18; 0.27 |
| INLAY | 5 | 0.15 | 0.03 | 0.11; 0.18 |
| ONLAY | 6 | 0.22 | 0.12 | 0.10; 0.35 |
| SBB | 2 | 0.09 | 0.06 | −0.47; 0.65 |
| Total | 30 | 0.22 | 0.12 | 0.17; 0.26 |
| Short term | ||||
| DISTR | 2 | 0.35 | 0.38 | −8.01; 16.76 |
| GBR | 8 | 0.21 | 0.08 | 1.77; 2.95 |
| INLAY | 4 | 0.13 | 0.02 | 2.98; 4.10 |
| ONLAY | 3 | 0.24 | 0.09 | −1.55; 6.86 |
| SBB | 1 | 0.03 | — | — |
| Total | 18 | 0.20 | 0.13 | 2.43; 3.53 |
| Medium term | ||||
| DISTR | 1 | 0.12 | — | — |
| GBR | 9 | 0.23 | 0.07 | 0.18; 0.28 |
| INLAY | 2 | 0.16 | 0.02 | −0.07; 0.38 |
| ONLAY | 3 | 0.24 | 0.15 | −0.12; 0.60 |
| SBB | 1 | 0.03 | — | — |
| Total | 16 | 0.20 | 0.09 | 0.15; 0.25 |
| Long term | ||||
| DISTR | 1 | 0.31 | — | — |
| GBR | 7 | 0.25 | 0.07 | 0.19; 0.32 |
| INLAY | 1 | 0.21 | — | — |
| ONLAY | 3 | 0.27 | 0.15 | −0.11; 0.64 |
| SBB | 2 | 0.10 | 0.05 | −0.36; 0.56 |
| Total | 14 | 0.23 | 0.10 | 0.18; 0.29 |
- Note: Ratio between PBL and VBG values of each technique analyzed per follow up period.
- Abbreviations: PBL, peri-implant bone loss; SD, standard deviation; VBG, vertical bone gain; VRA, vertical ridge augmentation.
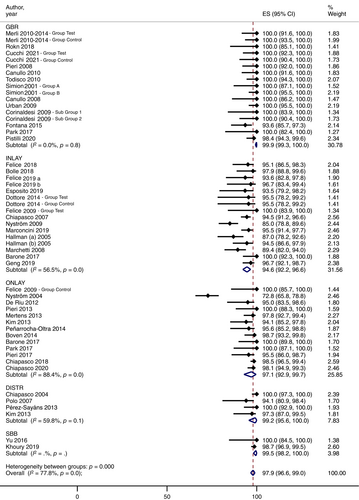
The implant survival was calculated in all the studies (WME: 97.9%; CI: 96.6–99.0). The analysis revealed similar values for GBR (WME: 99.9%; CI: 99.3–100.0), SBB (WME: 99.5%; CI: 98.2–100.0), DISTR (WME: 99.2%; CI: 95.6–100.0), onlay graft (WME: 97.1%; CI: 92.9–99.7), and inlay graft (WME: 94.6%; CI: 92.2–96.6). Significant differences were observed between GBR and inlay grafts in these studies. The Forest plot is shown in Figure 8.
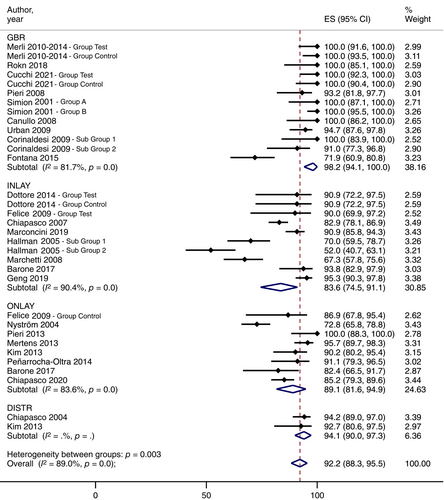
Finally, the implant success rates were evaluated in 24 studies with a pooled proportion of 92.2% (CI: 88.3–95.5). As with the survival rates, the analysis revealed similar values for GBR (WME: 98.2%; CI: 94.1–100.0), DISTR (WME: 94.1%; CI: 90.0–97.3), onlay graft (WME: 89.1%; CI: 81.6–94.9), and inlay graft (WME: 83.6%; CI: 74.5–91.1). Significant differences were observed between GBR and inlay grafts in these studies. No mean value could be established for SBB, because no articles reported implant success rates. The Forest plot is shown in Figure 9.
3.4.6 Other outcomes
Due to the insufficient amount of data for each technique, no MAs were conducted on PPD, GI, PROM's, and peri-implantitis data.
The PPD was provided in seven studies with a mean value of 2.36 ± 0.70 mm. Of these seven publications, four of them were about GBR30, 39, 70, 74 two studies about onlay graft,48, 54 and one about inlay graft.35 Moreover, the GI was assessed in two studies54, 70 with an interval between 0 and 1 using the modified gingival index; while the incidence of mucositis and peri-implantitis was reported in six studies,36, 39, 44, 54, 65, 68 with an average rate of 7.42%. Finally, the PROMs were investigated in seven publications, showing that patient's perception of the aesthetics and functionality is optimal, on average, for 93.04% (range: 85%–100%) of patients.
Complete detailed results of MA about secondary outcomes are given in Table 9.
| Author and pubblication year | PPD (mm) | GI | MPR (%) | PROM's (%) |
|---|---|---|---|---|
| Simion et al.30 | 2.6 ± 0.7 | NM | NM | NM |
| 2.0 ± 0.8 | NM | NM | NM | |
| Chiapasco et al.35 | 2.6 ± 1.2 | NM | NM | 92.3 |
| Pieri et al.74 | 3.0 ± 0.7 | NM | NM | NM |
| Urban et al.39 | 3.0 ± 0.6 | NM | 3.7 | NM |
| Merli et al.43, 44 | NM | NM | T: 0 | NM |
| NM | NM | C: 0 | NM | |
| De Riu et al.47 | NM | NM | NM | 94.0 |
| Pieri et al.48 | 4.3 ± 0.7 | NM | NM | 93.0 |
| Mertens et al.49 | NM | NM | NM | 100 |
| Boven et al.54 | 1.4 ± 0.6 | 0 | 0.0 | 100 |
| Pieri et al.36 | NM | NM | 31.4 | NM |
| Chiapasco et al.62 | NM | NM | NM | 90.0 |
| Marconcini et al.63 | NM | NM | NM | 85.0 |
| Khoury et al.25 | NM | NM | 0.98 | NM |
| Felice et al.65 | NM | NM | NM | 100 |
| NM | NM | 13.6 | NM | |
| Cucchi et al.70 | 1.8 ± 0.5 | 1 | NM | NM |
| 1.8 ± 0.8 | 1 | NM | NM | |
| Chiapasco et al.68 | NM | NM | 5.5 | NM |
- Abbreviations: C, control group; GI, Gingival index; NM, parameter not measured; PPD, probing pocket depth; PROM, patient-reported outcome measures; T, test group.
3.5 Pairwise MA—Only prospective studies (cohort studies and RCTs)
Considering only study with prospective designs, including prospective cohort studies, nonrandomized clinical trial, and randomized clinical trials, a total of 26 articles were analyzed in the second MA.
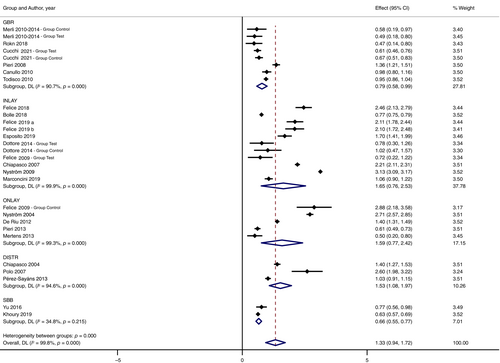
The overall results provided data for a total of 1663 implants with a mean follow-up of 28.9 months, giving a WME for PBL of 1.33 mm (CI: 0.94–1.72).
SBB (WME: 0.66 mm, CI: 0.55–0.77) and GBR (WME: 0.79 mm, CI: 0.58–1.00) had the lowest PBL values with no significant differences between them. Inlay graft, Onlay graft, and DISTR had values slightly higher and similar between them, that were 1.65 mm (0.76–2.53), 1.59 mm (0.77–2.52), and 1.53 mm (1.08–1.97), respectively. Complete data were reported in Table 10.
| VRA Techniques | No. studies | No. patients | No. implants | Medium follow-up (months) | Weight mean esitmate (mm) | 95% CI (mm) | p-Value | Heterogeneity (I2) (%) | p-Value (heterogeneity) |
|---|---|---|---|---|---|---|---|---|---|
| GBR | 7 | 118 | 351 | 20.5 | 0.79 | 0.58–1.00 | <0.01 | 90.7 | <0.01 |
| INLAY | 10 | 181 | 547 | 30.3 | 1.65 | 0.76–2.53 | <0.01 | 99.9 | <0.01 |
| ONLAY | 5 | 92 | 316 | 27.9 | 1.59 | 0.77–2.52 | <0.01 | 99.3 | <0.01 |
| DISTR | 3 | 60 | 122 | 23.4 | 1.53 | 1.08–1.97 | <0.01 | 94.6 | <0.01 |
| SBB | 2 | 139 | 327 | 65.0 | 0.66 | 0.55–0.77 | <0.01 | 34.8 | 0.22 |
| Overall | 27 | 590 | 1663 | 28.9 | 1.33 | 0.94–1.72 | <0.01 | 99.8 | <0.01 |
- Abbreviations: RCTs, randomized clinical trial; VRA, vertical ridge augmentation.
Statistical analysis for PBL confirmed no statistical differences for all surgical techniques except for SBB and GBR compared with DISTR, as referred in the forest plot Figure 10.
Morevoer, the above-mentioned secondary outcomes were entirely described in Table 11 and statistical analyses for SCR, HCR, VBG, SURV, and SUCC were reported in Figures 11-15.
| Outcomes | VRA techniques | No. studies | weight mean estimate | 95% CI | p-Value | Heterogeneity (I2) (%) | p-Value (heterogeneity) |
|---|---|---|---|---|---|---|---|
| Surgical complications | GBR | 3 | 11.17 | 3.62–21.32 | <0.01 | 10.01 | 0.34 |
| INLAY | 8 | 44.11 | 32.82–55.69 | <0.01 | 54.50 | 0.03 | |
| ONLAY | 3 | 8.67 | 0.68–21.74 | 0.01 | — | — | |
| DISTR | — | — | — | — | — | — | |
| SBB | 1 | 2.11 | 0.78–5.61 | <0.01 | — | — | |
| Overall | 15 | 25.21 | 12.87–39.71 | <0.01 | 89.06 | <0.01 | |
| Healing complications | GBR | 7 | 19.26 | 9.41–31.15 | <0.01 | 53.95 | 0.03 |
| INLAY | 8 | 10.65 | 5.91–16.33 | <0.01 | 7.1 | 0.38 | |
| ONLAY | 4 | 10.78 | 3.81–19.97 | <0.01 | 0.00 | 0.78 | |
| DISTR | 2 | 25.58 | 14.06–38.92 | <0.01 | — | — | |
| SBB | 2 | 6.78 | 3.33–11.14 | <0.01 | — | — | |
| Overall | 23 | 15.69 | 9.88–22.37 | <0.01 | 71.51 | <0.01 | |
| Vertical bone gain | GBR | 6 | 3.94 | 3.11–4.78 | <0.01 | 92.00 | <0.01 |
| INLAY | 2 | 6.16 | 5.31–7.01 | <0.01 | 64.60 | 0.06 | |
| ONLAY | 2 | 2.73 | 0.75–4.75 | <0.01 | 98.30 | <0.01 | |
| DISTR | 2 | 7.05 | 1.47–12.64 | <0.01 | 97.90 | <0.01 | |
| SBB | 2 | 6.64 | 4.78–8.50 | <0.01 | 95.70 | <0.01 | |
| Overall | 14 | 4.93 | 3.94–5.93 | <0.01 | 98.0 | <0.01 | |
| Implant survival | GBR | 7 | 100.00 | 99.39–100.00 | <0.01 | 0.00 | 1.0 |
| INLAY | 10 | 94.66 | 91.93–96.92 | <0.01 | 45.80 | 0.05 | |
| ONLAY | 5 | 95.42 | 81.66–100.00 | <0.01 | 93.10 | <0.01 | |
| DISTR | 3 | 99.50 | 95.35–100.00 | <0.01 | — | — | |
| SBB | 2 | 99.54 | 98.20–100.00 | <0.01 | — | — | |
| Overall | 27 | 97.88 | 95.67–99.43 | <0.01 | 83.81 | <0.01 | |
| Implant success | GBR | 5 | 99.67 | 97.77–100.00 | <0.01 | 19.23 | 0.29 |
| INLAY | 4 | 88.33 | 83.45–92.52 | <0.01 | 37.90 | 0.17 | |
| ONLAY | 4 | 91.13 | 73.99–99.88 | <0.01 | 92.53 | <0.01 | |
| DISTR | 1 | 94.20 | 88.97–97.03 | <0.01 | — | — | |
| SBB | — | — | — | — | — | — | |
| Overall | 14 | 94.90 | 90.30–98.25 | <0.01 | 86.66 | <0.01 |
- Abbreviations: RCTs, randomized clinical trial; VRA, vertical ridge augmentation.
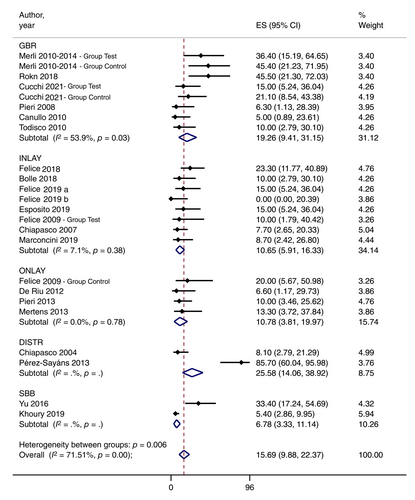

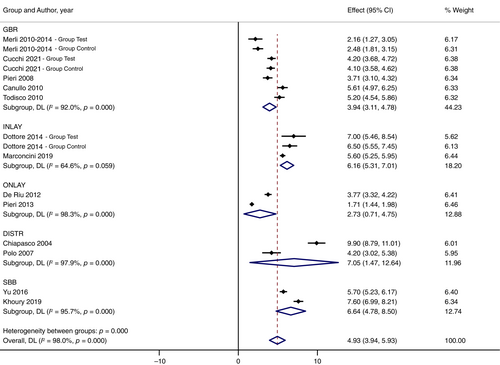
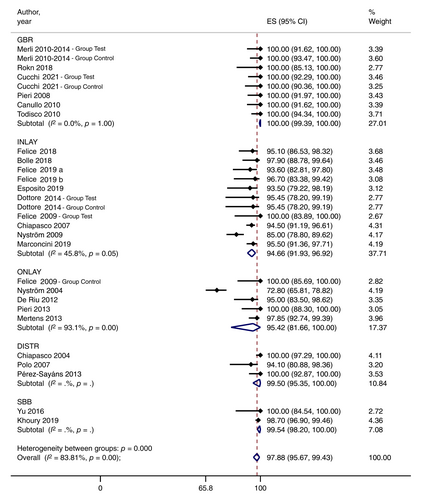
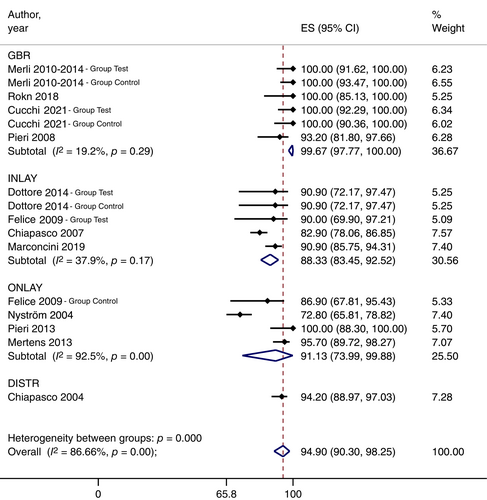
The overall values for surgical and healing complications were respectively 15.69% (CI: 9.88–22.37) and 25.21 % (12.87, 39.71); the WME VBG was 4.93 mm (CI: 3.94–5.93); and implant survival and rates were respectively 97.88 % (CI: 95.67–99.43) and 94.90 % (CI: 90.30–98.25).
3.6 Pairwise MA—Only RCTs
Considering only study randomized clinical trials, a total of 11 articles were analyzed in the third MA, having the highest level of evidence. Four articles were about GBR,43, 44, 59, 70 six articles about inlay,52, 60, 61, 65-67 and one article compared inlay versus onlay.42 SBB and DISTR had no randomized studies to be included in this analysis.
The overall results provided data for a total of 491 implants with a mean follow-up of 25.1 months, providing a WME of PBL values 1.21 mm (CI: 0.93–1.48).
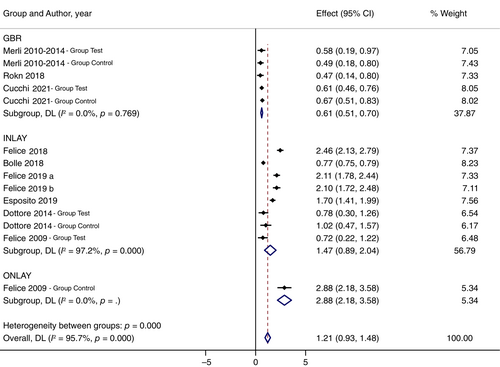
GBR showed the lowest value of PBL, giving a WME of 0.61 mm (CI: 0.51–0.70); this value is statistically lower than Inlay having a WME of 1.47 (CI: 0.89–2.04), that is in turn statistically lower than Onlay (WME: 2.88; CI: 2.18–3.58). Complete data were reported in Table 12.
| Follow-up period | VRA techniques | No. studies | No. patients | No. implants | Medium follow-up (months) | Weight mean esitmate (mm) | 95% CI (mm) | p-Value | Heterogeneity (I2) (%) | p-Value (heterogeneity) |
|---|---|---|---|---|---|---|---|---|---|---|
| Overall | GBR | 4 | 62 | 201 | 24.0 | 0.61 | 0.51–0.70 | <0.01 | 0.0 | 0.77 |
| INLAY | 7 | 105 | 267 | 26.6 | 1.47 | 0.89–2.04 | <0.01 | 97.2 | <0.01 | |
| ONLAY | 1 | 10 | 23 | 18.0 | 2.88 | 2.18–3.58 | <0.01 | — | — | |
| DISTR | — | — | — | — | — | — | — | — | — | |
| SBB | — | — | — | — | — | — | — | — | — | |
| Overall | 12 | 177 | 491 | 25.1 | 1.21 | 0.93–1.48 | <0.01 | 95.70 | <0.01 |
- Abbreviations: RCTs, randomized clinical trial; VRA, vertical ridge augmentation.
Statistical analysis for PBL confirmed statistical differences between GBR and Inlay, GBR and Onlay, and Inlay and Onlay, as referred in the forest plot Figure 16.
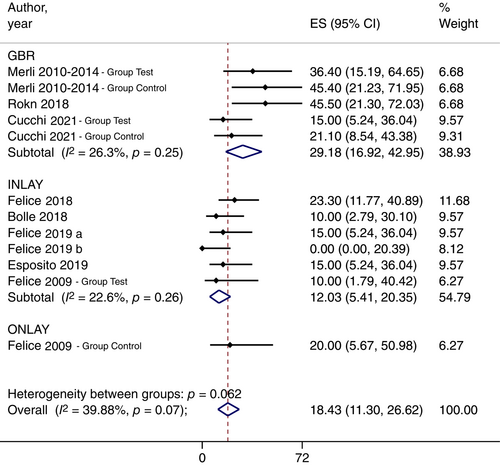
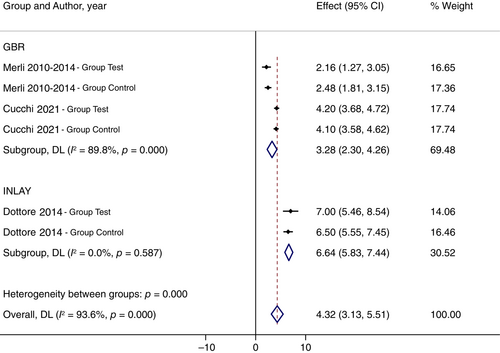
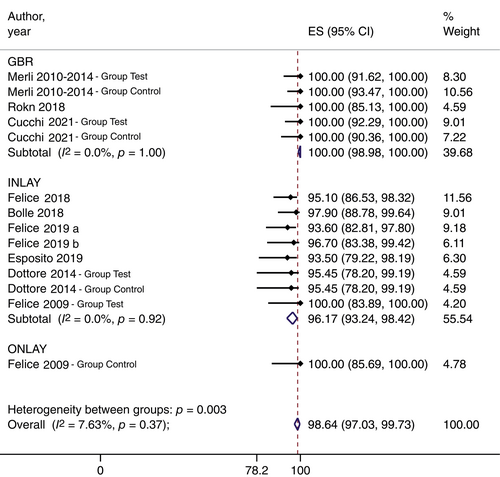
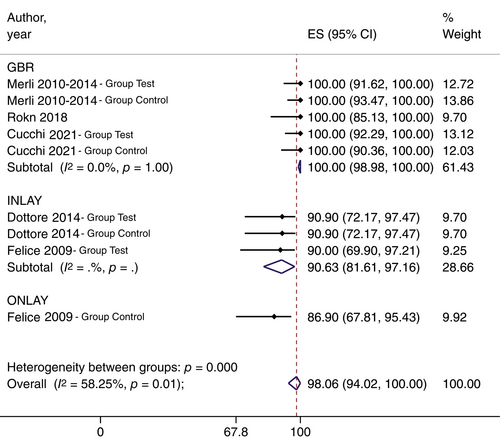
The secondary outcomes reported in RCTs were entirely described in Table 13 and statistical analyses for SCR, HCR, VBG, SURV, and SUCC were reported in five different forest plots (Figures 17-21).
| Outcomes | VRA techniques | No. studies | Weight mean estimate | 95% CI | p-Value | Heterogeneity (I2) (%) | p-Value (heterogeneity) |
|---|---|---|---|---|---|---|---|
| Surgical complications | GBR | 2 | 13.30 | 3.13–27.64 | <0.01 | — | — |
| INLAY | 6 | 48.42 | 33.72–63.25 | <0.01 | 58.00% | 0.04 | |
| ONLAY | 1 | 20.00 | 5.67–50.98 | 0.03 | — | — | |
| DISTR | — | — | — | — | — | — | |
| SBB | — | — | – | — | — | — | |
| Overall | 8 | 34.76 | 20.57–50.30 | <0.01 | 75.02% | <0.01 | |
| Healing complications | GBR | 4 | 29.18 | 16.92–42.95 | <0.01 | 26.27% | 0.25 |
| INLAY | 5 | 12.03 | 5.41–20.35 | <0.01 | 22.60% | 0.26 | |
| ONLAY | 1 | 20.00 | 5.67–50.98 | 0.03 | — | — | |
| DISTR | — | — | – | — | — | — | |
| SBB | — | — | – | — | — | — | |
| Overall | 10 | 18.43 | 11.30–26.62 | <0.01 | 39.88% | 0.07 | |
| Vertical bone gain | GBR | 3 | 3.28 | 2.30–4.26 | <0.01 | 89.80% | <0.01 |
| INLAY | 1 | 6.64 | 5.83–7.44 | <0.01 | 0.00% | 0.59 | |
| ONLAY | — | — | – | — | — | — | |
| DISTR | — | — | – | — | — | — | |
| SBB | — | — | – | — | — | — | |
| Overall | 4 | 4.32 | 3.13–5.51 | <0.01 | 93.60% | <0.01 | |
| Implant survival | GBR | 4 | 100.00 | 98.98–100.00 | <0.01 | 0.00% | 1.00 |
| INLAY | 7 | 96.17 | 93.24–98.42 | <0.01 | 0.00% | 0.92 | |
| ONLAY | 1 | 100.00 | 85.69–100.00 | <0.01 | — | — | |
| DISTR | — | — | — | — | — | — | |
| SBB | — | — | — | — | — | — | |
| Overall | 11 | 98.64 | 97.03–99.73 | <0.01 | 7.63% | 0.37 | |
| Implant success | GBR | 4 | 100.00 | 98.98–100.00 | <0.01 | 0.00% | 1.00 |
| INLAY | 2 | 90.63 | 81.61–97.16 | <0.01 | — | — | |
| ONLAY | 1 | 86.90 | 67.81–95.43 | <0.01 | — | — | |
| DISTR | — | — | — | — | — | — | |
| SBB | — | — | — | — | — | — | |
| Overall | 7 | 98.06 | 94.02–100.00 | <0.01 | 94.25% | 0.01 |
- Abbreviations: RCTs, randomized clinical trial; VRA, vertical ridge augmentation.
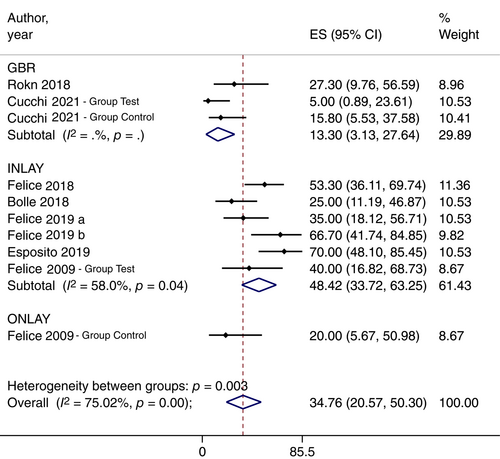
GRADE assessment was used to define the level of evidence of the outcomes. In this systematic review, GRADE assessment was considered very low due to a high risk of bias, imprecision and inconsistency (Table 14).
| The influence of vertical ridge augmentation techniques on peri-implant bone loss | ||||
|---|---|---|---|---|
| Patient | Patients with different vertical deficiencies | |||
| Intervention | Vertical ridge augmentation techniques | |||
| Comparison | Guided bone regeneration (GBR; nonresorbable, resorbable membranes, and titanium mesh), Onlay graft (ONLAY), not covered and covered with a resorbable membrane), Inlay graft (INLAY), Distraction Osteogenesis (DISTR), and Split bone block technique (SBB) | |||
| Outcomes | Number of participants (Studies) | Relative effects (95% CI) | Certainty of evidence (GRADE) | Key messages in simple terms |
|---|---|---|---|---|
| Peri-implant bone loss | 1127 (43) | |||
| PTFE vs. MESH | −0.03 (−1.31; 1.24) | ⊕○○○a,b,c Very low | It is not possible to clearly identify the VRA technique having less peri-implant bone loss over the years | |
| PTFE vs. COLLAG | −0.120 (−1.44; 1.20) | |||
| MESH vs. ONLAY | −0.079 (−1.39; 1.24) | |||
| COLLAG vs. SHORT | 0.142 (−1.16; 1.44) | |||
| INLAY vs. ONLAY | −0.581 (−1.62; 0.46) | |||
| INLAY vs. SHORT | 0.557 (−0.08; 1.19) | |||
| ONLAY vs. DISTR | −0.300 (−1.89; 1.29) |
- Note: Study: RCTs, CCTs, prospective cohort studies, and retrospective cohort studies. 95% CI: 95% confidence interval. Domains that lower the level of evidence.
- Abbreviations: CCTs, controlled clinical trials; GRADE: Evidence grades. Grading of Recommendations Assessment, Development, and Evaluation; RCTs, randomized clinical trials.
- a Certainity of the evidence downgraded 1 level due to high risk of bias.
- b Certainity of the evidence downgraded 1 level due to inconsistency (substantial heterogeneity).
- c Certainity of the evidence downgraded 1 level due to Imprecision (wide confidence intervals).
3.7 Meta-regression
The results of the meta-regression for GBR, Inlay, and Onlay were carefully analyzed to identify possible confounding factors as reported below.
For, surgical interventions interesting both jaws or only maxilla in comparison with the mandible, were associated with higher PBL (p = 0.002 in GBR and p < 0.001 in Inlay). The follow-up time had influence on the PBL for Inlay and GBR since for each year of follow-up the PBL increases by 0.32 and 0.11 mm, respectively (p = 0.053 in GBR and p < 0.001 in Inlay).
In GBR procedures, the study design appeared to be strongly associated to PBL and RCTs showed lower values of PBL compared with prospective or retrospective cohort studies (p < 0.001); also implant connection was investigated and a positive association with PBL was found also for external and internal hexagonal connection compared with conical connection (p = 0.003 and p = 0.019, respectively).
Finally, in GBR procedures, VBG is so positively related to PBL that increases by 0.27 mm and for each 1 mm of increase in VBG (p = 0.004); while in Inlay grafts, VBG is so negatively related to PBL that reduces by 0.29 mm and for each 1 mm of increase in VBG (p = 0.033).
No significant modifiers were identified for Onlay due to the limited number of studies. All data were resumed in Table 15.
| VRA Technique | Moderator | Coefficient | 95% CI | p-Value | |
|---|---|---|---|---|---|
| GBR | Follow-up in months (continuous) | 0.009 | −0.0001 to 0.019 | 0.053 | |
| Follow-up in years (continuous) | 0.111 | −0.002 to 0.223 | 0.053 | ||
| Jaw of interest | Mandible (lower jaw) | 0 | — | — | |
| Jaws | 0.620 | 0.232–1.009 | 0.002 | ||
| Study design | Retrospective studies | 0 | — | — | |
| Prospective studies | —0.244 | −0.658 to 0.170 | 0.248 | ||
| RCTs | —0.770 | −1.136 to −0.403 | <0.001 | ||
| Implant connection | Conical | 0 | — | — | |
| Internal hexagon | 0.736 | 0.248–1.223 | 0.003 | ||
| External hexagon | 0.526 | 0.087–0.965 | 0.019 | ||
| VBG (continuous) | 0.267 | 0.087–0.448 | 0.004 | ||
| Inlay graft | Follow-up in months (continuous) | 0.027 | 0.012–0.041 | <0.001 | |
| Follow-up in years (continuous) | 0.318 | 0.144–0.493 | <0.001 | ||
| Jaw of interest | Maxilla (upper jaw) | 0 | — | — | |
| Mandible (lower jaw) | —1.254 | −1.878 to −0.630 | <0.001 | ||
| Study design | Retrospective studies | 0 | — | — | |
| Prospective studies | 0.278 | −1.018 to 1.574 | 0.674 | ||
| RCTs | —0.39 | −1.422 to 0.634 | 0.453 | ||
| Implant connection | Conical | 0 | — | — | |
| External hexagon | 0.319 | −2.071 to 2.708 | 0.794 | ||
| Internal hexagon | —0.260 | −3.303 to 2.783 | 0.867 | ||
| VBG (continuous) | −0.289 | −0.555 to −0.024 | 0.033 | ||
| Onlay graft | Follow-up in months (continuous) | 0.0005 | −0.013 to 0.014 | 0.936 | |
| Follow-up in years (continuous) | 0.006 | −0.151 to 0.163 | 0.936 | ||
| Jaw of interest | Maxilla (upper jaw) | 0 | — | — | |
| Mandible (lower jaw) | —0.251 | −1.785 to 1.284 | 0.749 | ||
| Jaws | —0.602 | −2.174 to 0.970 | 0.453 | ||
| Study design | Retrospective studies | 0 | – | — | |
| Prospective studies | 0.176 | −0.814 to 1.165 | 0.728 | ||
| RCTs | 1.746 | −0.090 to 3.581 | 0.062 | ||
| Implant connection | Conical | 0 | — | — | |
| Internal hexagon | 0.771 | −0.117 to 1.660 | 0.089 | ||
| External hexagon | —0.130 | −0.996 to 0.736 | 0.769 | ||
| VBG (continuous) | 0.134 | −0.100 to 0.367 | 0.261 | ||
- Abbreviations: GBR, guided bone regeneration; RCTs, randomized clinical trials; VBG, vertical bone gain.
A further network meta-analysis (NMA) was done to examine the primary outcome from double-arm RCTs and observational studies but due to the low scientific evidence the results have been presented in Appendix A.
4 DISCUSSION
VRA is one of the most challenging targets for bone regeneration in implant dentistry. It is a highly technique- and operator-sensitive procedure characterized by numerous intra- and postoperative complications.18, 77 However, the most recent reviews agreed that all surgical techniques significantly augment the clinical horizontal and vertical ridge dimensions.11, 17
The terms of VRA have been used first in the half of 90s after some interesting studies about the GBR with nonresorbable membranes78-80 then, the following researches have been focused on the predictability of implants placed in vertically agumented bone and the stability of their crestal bone levels over time.81
The primary purpose of this systematic review, conducted on 42 publications, was to analyze the changes in PBL over time of implants placed after different VRA techniques namely: GBR with nonresorbable barriers, resorbable barriers, or titanium mesh; Inlay Graft; Onlay Graft; Distraction Osteogenesis; or Split Bone Block technique.
The search strategy included studies published in the last 25 years, starting from 1996 because in the authors’ knowledges no studies about implant success and related peri-implant bone levels after VRA were published before 1996. A post hoc research was carried out using the above-mentioned search string including MeSH and related keywords and none of the studies published before 1996 matched the inclusion criteria.
Since the PBL is closely related to the follow-up time, the results were divided and analyzed for three different intervals: short-term, medium-term, and long-term follow-up.
While GBR, Inlay graft, and Onlay graft techniques had more than 12 studies each, the numbers of studies about SBBT and DISTR were limited. The small number of articles in the literature concerning SBB and DISTR related to PBL values did not make it possible to highlight statistically significant outcomes over all time periods. Indeed, to reach statistical significance in a MA, two articles are required at least for each outcome72 but in the short- and medium-follow-up there is only one study about SBB25; and in the long-term follow-up, only one study about DISTR.51 Consequently, only GBR, Inlay graft, and Onlay graft have a meaningful MA for all follow-up periods.
Three different MAs were performed to completely investigate the primary outcomes of this review. The first one is MA including all studies, as retrospective cohort studies, prospective cohort studies, nonrandomized controlled studies, and randomized controlled studies, and it gives a comprehensive description of the PBL in an overall follow-up as well as in short-, medium-, and long- follow-up. The second one including all studies with prospective design (cohort studies, controlled clinical trials [CCTs], and RCTs) to reduce the risk of missing data and the risk of bias. A third MA including only RCTs allows to have the highest level of evidence and to understand the surgical techniques having stronger and solider data.
Considering the study design, only GBR, Inlay, and Onlay were evaluated in randomized or CCTs; SBB was evaluated only in prospective cohort studies and DISTR only in retrospective cohort studies.
In relation to data from RCTs, implants placed in bone vertically augmented using GBR seems to have less PBL (about 0.61 mm) than those placed in sites augmented by Inlay or Onlay bone grafts (about 1.47 and 2.88 mm, respectively). However, the number of studies is very limited as well as the direct comparison between different surgical techniques in the same study.
It is important to state that the different follow-up periods could influence the different values of PBL for each technique; for example, inlay grafts reported data after a follow-up of 60 months or longer,60, 65-67 while GBR had only RCTs with data after short or medium follow-up.43, 44, 59, 70
For the short-term period, the overall MA indicated that all VRA techniques presented PBL data that were comparable to the PBL in native bone, reporting a mean values <1.0 mm. Up to now, a PBL threshold of 1.5 mm in the first year have been widely accepted and adopted in the most of the studies, as criteria for implant success27, 28; however, this threshold was not based on scientific data and it is no longer acceptable in comtemporatry implant dentistry.82 the crestal bone loss were observed to be consistent with a good peri-implant health, that is <1.0 mm (0.68 ± 0.40 mm), over a short- and medium-term follow-up. Thus, the marginal bone loss that occurs in the early phase seemingly varies between brands and seems to be related to the implant design and implant abutment connection, but after this phase the most of implants experience no additional bone loss and exhibit PBL <1.0 mm associated with an apparently healthy peri-implant mucosa.83, 84
The highest PBL value was reported by Polo et al.34 for DISTR in the posterior mandibles (2.60 mm); otherwise, the lowest values (0.33 mm) were measured by Pieri et al.48 after small VRA in the anterior maxilla, treated with mandibular block grafts covered with hydroxyapatite and resorbable membrane.
For the medium-term period, the overall MA indicated that GBR and DISTR showed slightly better values of PBL compared with inlay grafts; data on onlay grafts were highly variabile.
The major PBL values (3.17 mm) after 5 years of follow-up were reported by Nyström et al.,41, 76 who evaluated implants after Le fort 1 osteotomy and inlay grafts, in total edentulous atrophic maxillae, harvesting cortico-cancellous bone block from the iliac crest. The lower values (0.38 mm) were reported by Park et al.,58 that only evaluated 26 implants in posterior mandibles augmented with allogeneic onlay bone blocks, after 2 years of follow up, using panoramic radiographs.
For the long-term period, the results of the MA showed significantly better results for SBB and GBR compared with inlay graft and DISTR. Once again, onlay graft showed a high variability and a mean value set between GBR and inlay graft values. The highest PBL was reported again by Nyström et al.41, 76 after Le fort 1 osteotomy and inlay grafts, in total edentulous atrophic maxillae at 5 and 10 years of follow-up (3.13 mm). The lowest PBL value was reported by Merli et al.,44 after 6 years of follow-up, using two different GBR approaches: titanium-reinforced PTFE membranes (1.00 mm) and collagen membranes supported by titanium microplates (1.33 mm).
Up to now, no other recent review has evaluated studies in relation to PBL over time as primary outcome; however, some data related to changes in marginal bone levels after VRA with at least 12 months follow-up were described by Urban et al.,11 that observed a significant bone loss over time with a mean value of 1.01 mm. The authors stated that marginal bone loss, that ranged from 1.40 mm for DISTR to 0.58 mm for GBR with resorbable membranes, was influenced by the type of procedure. The present review is primarily aimed to investigate the influence of the different VRA procedures on peri-implant bone levels after the functional loading.
Among the secondary outcomes, the report of surgical complications showed that VRA techniques had a mean value of about 19%, although most of them did not affect the final results of these procedures. In this regard, inlay graft presented the highest values, mainly due to the incidence of temporary paresthesia, usually resolving within a few days. It is important to note that in their randomized clinical trials about short implants versus inlay grafts in posterior mandibles, Felice et al.60, 66 and Esposito et al.,67 accurately reported all kinds of neurological alterations from the day after surgery, recording about 55%–70% of temporary paresthesia, in comparison to other authors who included only neurological alterations lasting more than 1–3 months after surgery. The lowest values of surgical complications (1.4%) were reported by Chiapasco et al.62 in a large cohort study both in mandibles and maxillae with onlay grafts covered by resorbable membranes, although a retrospective design is not very reliable for obtaining data about surgical complications.
Concerning the healing complications, all VRA techniques showed similar percentage values, giving a mean value of about 16%. In contrast to surgical ones, this kind of complication usually affected the final results of bone augmentation, due to the partial or complete loss of bone graft.85 The highest percentage was reported by Pérez-Sayáns et al.50 in a prospective cohort study about DISTR using intrabony distractor (85.7%), where the most common problems were the deviation of the distraction axis, that can result in a partial reduction of the VBG. The lowest rate was reported by Urban et al.39 in a retrospective cohort study on 35 patients treated with GBR using Ti-reinforced PTFE membranes (2.78%), where only one patient developed a fistula on top of the membrane area, two weeks after bone grafting.
With regard to VBG, the values reported in 23 studies provided a mean value of about 5.2 mm, showing similar values for the different techniques, with DISTR showing the highest value (9.9 mm) reported by Chiapasco et al.86 As previously described, the lowest value (1.7 mm) was observed after mandibular block grafts by Pieri et al.48 The observed data could be different compared with those reported in other systematic review focused on VBG as primary outcomes, because the present review aimed at understanding which techniques showed lowest PBL over time and consequently only included studies reporting data about PBL, and not all studies reporting the VBG values.11, 17, 20
In regard to VBG, two interesting studies have been published recently but not included in this review because they did not report PBL even at 1 year of follow-up: Urban et al.87 evaluated the use of reinforced PTFE meshes, reporting a mean VBG of 5.2 mm, that is equal to the value observed in this review; then, Chiapasco et al.,88 using the customized CAD/CAM titanium meshes, had a mean value 4.8 mm.
In the present review the PBL/VBG ratio, that expresses the stability of augmented bone in relation to the entity of vertical augmentation, was measured for all type of procedures. Since some authors suggested the amount of vertical bone was directly related to the amount of observed bone resorption, a comparison of different PBL/VBG ratios was performed to understand which technique showed the more stable peri-implant levels independently of the amount of bone augmentation. This analysis found that SBBT and inlay graft are the two techniques in which the VBG had the lower influence on the maintenance of the peri-implant bone levels, although these data derived from fewer studies (n = 5) in comparison to those relative to GBR (n = 14).
The reasonable minimum vertical bone defect for performing a VRA could be a topic of debate, considering that the mean PBL was 1.4 mm after a mean follow-up longer than 3 years.
With regard to implant survival and implant success, the mean values were 97.9% and 92.2%, respectively. The type of procedure also influenced the outcomes: the SURV ranged from 94.6% for inlay graft to 99.9% for GBR; while the SUCC ranged from 83.6% for Inlay graft to 98.2% for GBR.
These mean rates were comparable to previous studies about implants placed in pristine bone after a mean observation period of at least 5 years.89 Also, a recent systematic review confirmed that no statistically significant differences were observed between implants placed in pristine versus augmented sites for any outcome variables both at patient and at implant levels, respectively.15
In the present review, SBB have been distinguished from any other techniques due to its miscellaneous particularities, such as the autogenous bone lamina used as barriers similar to GBR, the apical space between the native bone and the lamina-like inlay graft, and the apposition of the autogenous bone above alveolar ridges like the onlay graft.90 Further reviews could include SBB in GBR as well as in inlay or onlay grafts.
A matter of discussion could be the method used to express PBL values over time. The authors choose to divide the analysis of PBL over 3 different periods (short-term <1 year; medium-term 2–4 years; and long-term >5 years). There are mainly two reasons: (i) PBL is a variable strongly correlated with the length of follow-up and (ii) there are insufficient data related to each year of follow-up. This method made it possible to have a better comparability of PBL values in the first year compared with the following years, eliminating the effect of follow-up time on crestal bone levels.
The present systematic review and MA revealed that it is difficult to draw strong conclusions about the VRA technique having less PBL over the years due to the presence of some limitations.
The major limitation is the radiographic method to assess the PBL: the intraoral radiographs are surely more suitable and efficient for measuring the crestal bone levels around implants than orthopantomography.91 In this review, studies using both intraoral radiographs and/or orthopantomography have been included in order to not overlook some important studies about VRA. In this regard, the cone-beam computed tomography systems (CBCT) is more accurate, as it allows a three-dimensional measurement of peri-implant bone levels92, 93 and the scientific literature also validates the CBCT, instead of the bidimensional radiographs, for assessing the peri-implant bone levels94-96 but the biological and financial costs for the patients limit its use.
Further limitations of this review are the number of included studies: there are several randomized controlled trials about VRA reporting complications, HBG, VBG, and/or implant survival, but few trials report PBL over time, which is the main inclusion criteria of this systematic review. For this reason, the authors incorporated all type of studies, including observational studies or trials comparing short versus long implant in augmented sites.59-61, 65-67 Moreover, we must note that the detection of small-study effect could limit the generalizability of this review's findings. However, the quality of analyzed studies was not weak because they included seven RCTs with moderate risk of bias and three with low risk of bias, without any RCT with high risk of bias; and more than half of nonrandomized trials had a moderate quality, confirming the presence of some significant studies about PBL after VRA.
Finally, this review could not describe separately the PBL values separately for mandible and maxilla because many authors did not break them down for maxilla and mandible, giving a mean result for both jaws. The scientific literature highlights how this outcome should be differentiated, since the mandible and the maxilla have a different bone density and different marginal bone loss.97 Also, the type of implant–abutment connection, collar features, and surface characteristics can influence the changes in marginal bone levels as observed in different systematic reviews.98-100
The strength of the present review is that it represents the only review evaluating PBL around implants in vertically augmented bone as the primary outcome. In order to give detailed information and better description about peri-implant bone levels over time, the data were analyzed in different follow-up intervals. The review included all types of VRA techniques: GBR including nonresorbable membranes, resorbable membranes, and titanium meshes; Onlay grafts; Inlay Grafts; Osteogenenic Distraction; and Split Bone Block technique. Then, it is important to highlight that two different MA approaches were used, offering more information about the primary outcome and related data. Finally, the most significant secondary outcomes were accurately reported and analyzed to provide a better understanding of the behavior of implants placed in regenerated bone.
5 FUTURE RESEARCH AND RECOMMENDATIONS
To have a high level of evidence and confirm the trends observed in the present review, the authors suggest the need for more CCTs and/or RCTs comparing two or more surgical techniques with standardized methods for radiographic measurements, such as periapical radiographs; more long-term studies reporting complete data after longer follow-up; and more multicenter cohort studies with a larger sample of patients.
Finally, the authors encourage continuing the long-term follow-up of treated patients in already published studies, to update the data over time.
6 CONCLUSIONS
The studies included in the present review directly addressed the focused question, reporting the changes of peri-implant bone levels during follow-up, finding a mean pooled value of PBL after a follow-up of more than 3 years that was <1.5 mm.
However, the outcomes of the MA should be interpreted with caution due to high variability with respect to number of studies for each technique, PBL measurements, duration of follow-ups, and eligibility criteria. While GBR, onlay graft, and inlay graft techniques are supported by data derived from a significant number of studies, there was a lack of studies about other surgical techniques (distraction and SBB).
Nevertheless, within the limitations of the present review, the primary findings of the MA, based on the changes between final and baseline values, have shown that the PBL could be influenced by the type of VRA procedure but there is a need to evaluate in randomized clinical trials the behavior of the peri-implant bone levels after long-term follow-up for all techniques in order to establish which is the VRA technique having less PBL over the years.
AUTHOR CONTRIBUTIONS
Alessandro Cucchi: Concept/design; critical revision of the article. Francesco Maiani: Statistic and data collection. Debora Franceschi: Drafting and reviewing article. Michele Sassano: Data collection and drafting. Antonino Fiorino: Statistic and data collection (responsible for the data analysis). Istvan A. Urban: Critical revision of the article. Giuseppe Corinaldesi: Concept/design.
CONFLICT OF INTEREST STATEMENT
The authors report no conflicts of interest related to this study.
APPENDIX A
A.1 NETWORK META-ANALYSIS
A NMA was carried out based on a frequentist approach, generalizing traditional pairwise meta-analyses and allowing the comparison of different VRA techniques. Using the STATA network package, the statistical analysis included a combination of both direct comparisons (from studies directly comparing interventions) of different VRA techniques, and indirect comparisons using information about two treatments derived via a common comparator. Only RCT studies reporting data on at least two different types of procedures were included in the NMA.
As for the assumptions of the NMA, “similarity” between studies was assessed qualitatively, both through the adoption of the PICO model for the search strategy and the assessment of full texts of included articles, making sure that studies included in the NMA were comparable, with the adopted procedures being the only remarkable difference between them. Instead, the analysis tested for “transitivity” quantitatively, by statistically assessing consistency of the network through the STATA commands network meta-inconsistency and network sidesplit.
The results of the NMA are graphically presented using a network forest plot, and the occurrence of publication bias was assessed by visually checking the symmetry of the funnel plots.101
Then, in order to provide information about the ranking of the different interventions under investigation for PBL, the statisticians generated cumulative rankograms for each and computed surface under the cumulative ranking curve (SUCRA) values.101
A.2 RESULTS
The network meta-analysis regarding PBL was conducted on 12 studies.42, 44, 51, 58-61, 65-67, 70, 73 Characteristics of each study are given in Table 1. The overall structure of the network, with information regarding the procedures being compared and the available direct comparisons between pairs of interventions, is given in Figure A1. Testing for inconsistency and the local tests on loop inconsistency are in Table A2. Because inconsistency was found to be absent in both the global and local tests, the consistency assumption were accepted.
The network meta-analysis results in terms of PBL are summarized in Figure A2 and Table A1 as mean differences and p-values, while the contribution of direct comparisons between the various bone augmentation techniques is contained in Table A3. The results indicated that there were no significant differences between the various compared procedure groups. Definitely, the probability of being the best for each treatment group is reported in Table A4 and Figure A3. Considering the limitations of this analysis, the SUCRA values are higher for the PTFE and DISTR techniques, suggesting a better performance of these than the inlay graft and short implants, which present considerably lower values.
As for the assessment of publication bias, visual inspection of the funnel plot suggested its occurrence for both of the comparisons inlay graft versus onlay graft and inlay graft vs. short implants, as shown in Figure A4. In general, the degree of asymmetry could not be accurately determined due to the small number of studies for any single comparison. The funnel plot analysis, considering the limitation due to the low number of studies, is suggestive of publication bias (small study effect).
| Comparison | Mean gdifference (95% CI) | Standard error |
|---|---|---|
| PTFE vs. MESH | −0.03 (−1.31; 1.24) | 0.652 |
| PTFE vs. COLLAG | −0.120 (−1.44; 1.20) | 0.675 |
| MESH vs. ONLAY | −0.079 (−1.39; 1.24) | 0.671 |
| COLLAG vs. SHORT | 0.142 (−1.16; 1.44) | 0.665 |
| INLAY vs. ONLAY | −0.581 (−1.62; 0.46) | 0.530 |
| INLAY vs. SHORT | 0.557 (−0.08; 1.19) | 0.325 |
| ONLAY vs. DISTR | −0.300 (−1.89; 1.29) | 0.371 |
| Side | p>|z| |
|---|---|
| PTFE vs. MESH | 0.927 |
| PTFE vs. COLLAG | 0.927 |
| MESH vs. ONLAY | 0.927 |
| COLLAG vs. SHORT | 0.927 |
| INLAY vs. SHORT | 0.927 |
| INLAY vs. ONLAY | 0.927 |
| ONLAY vs. DISTR | 1.000 |
| Global | 0.927 |
| COLLAG vs. PTFE | COLLAG vs. SHORT | DISTR vs. ONLAY | INLAY vs. ONLAY | INLAY vs. SHORT | MESH vs. ONLAY | MESH vs. PTFE | |
|---|---|---|---|---|---|---|---|
| Mixed estimates | |||||||
| COLLAG vs. PTFE | 91.0 | 1.8 | 1.8 | 1.8 | 1.8 | 1.8 | |
| COLLAG vs. SHORT | 2.8 | 86.2 | 2.8 | 2.8 | 2.8 | 2.8 | |
| DISTR vs. ONLAY | 100.0 | ||||||
| INLAY vs. ONLAY | 19.6 | 19.6 | 2.0 | 19.6 | 19.6 | 19.6 | |
| INLAY vs. SHORT | 0.9 | 0.9 | 0.9 | 95.4 | 0.9 | 0.9 | |
| MESH vs. ONLAY | 2.4 | 2.4 | 2.4 | 2.4 | 88.1 | 2.4 | |
| MESH vs. PTFE | 0.6 | 0.6 | 0.6 | 0.6 | 0.6 | 97.2 | |
| Indirect estimates | |||||||
| COLLAG vs. DISTR | 23.7 | 1.3 | 25.0 | 1.3 | 1.3 | 23.7 | 23.7 |
| COLLAG vs. INLAY | 2.0 | 46.1 | 2.0 | 46.1 | 2.0 | 2.0 | |
| COLLAG vs. MESH | 47.5 | 1.2 | 1.2 | 1.2 | 1.2 | 47.5 | |
| COLLAG vs. ONLAY | 31.6 | 1.7 | 1.7 | 1.7 | 31.6 | 31.6 | |
| DISTR vs. INLAY | 16.1 | 16.1 | 17.8 | 1.6 | 16.1 | 16.1 | 16.1 |
| DISTR vs. MESH | 1.3 | 1.2 | 47.5 | 1.2 | 1.2 | 46.3 | 1.3 |
| DISTR vs. SHORT | 19.0 | 19.0 | 20.7 | 1.7 | 1.7 | 19.0 | 19.0 |
| DISTR vs. PTFE | 1.0 | 1.0 | 32.6 | 1.0 | 1.0 | 31.6 | 31.6 |
| INLAY vs. MESH | 24.1 | 24.1 | 1.7 | 24.1 | 1.7 | 24.1 | |
| INLAY vs. PTFE | 31.3 | 31.3 | 2.0 | 31.3 | 2.0 | 2.0 | |
| MESH vs. SHORT | 31.5 | 31.5 | 1.9 | 1.9 | 1.9 | 31.5 | |
| ONLAY vs. SHORT | 23.9 | 23.9 | 2.2 | 2.2 | 23.9 | 23.9 | |
| ONLAY vs. PTFE | 1.6 | 1.6 | 1.6 | 1.6 | 46.9 | 46.9 | |
| SHORT vs. PTFE | 45.2 | 45.2 | 2.4 | 2.4 | 2.4 | 2.4 | |
| Entire network | 20.6 | 17.3 | 10.8 | 1.7 | 11.2 | 17.6 | 20.8 |
| Included studies | 1 | 1 | 1 | 2 | 5 | 1 | 1 |
- Note: The color of each number is proportional to the weight attached to each direct summary effect (horizontal axis) for the estimation of each network summary effects (vertical axis). Gray: low contribution; Normal: medium contribution; Bold: high contribution.
- Abbreviation: PBL, peri-implant bone loss.
| Treatment | SUCRA | PrBest | MeanRank |
|---|---|---|---|
| PTFE | 61.1 | 17.7 | 3.3 |
| MESH | 56.6 | 19.1 | 3.6 |
| COLLAG | 54.8 | 16.8 | 3.7 |
| INLAY | 50.1 | 13.1 | 4.0 |
| ONLAY | 22.8 | 0.3 | 5.6 |
| DISTR | 60.6 | 13.9 | 3.4 |
| SHORT | 44.0 | 19.1 | 4.4 |
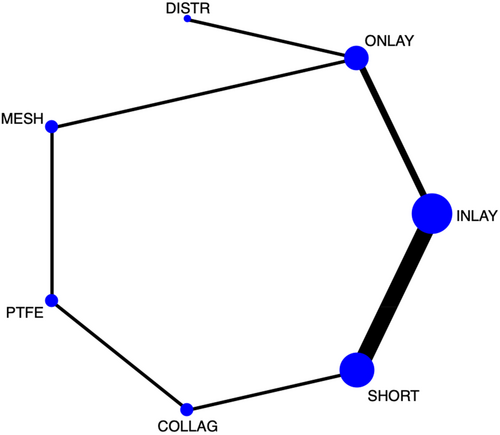
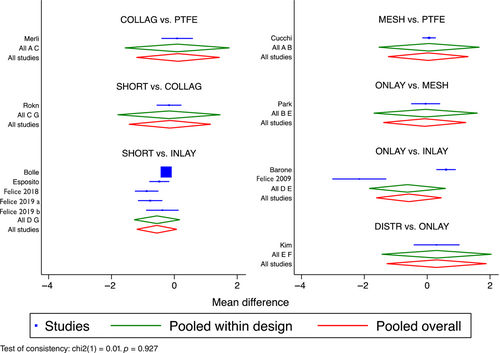
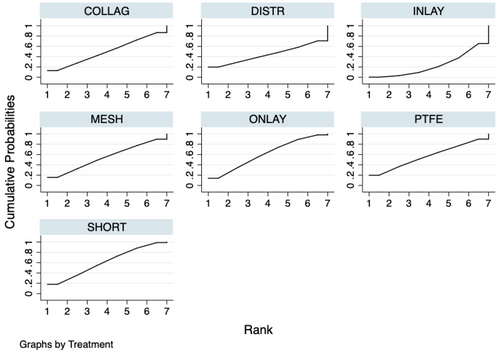
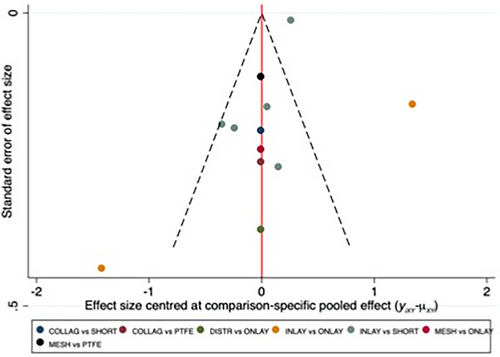
Open Research
DATA AVAILABILITY STATEMENT
The data that support the findings of this study are available from the corresponding author upon reasonable request.


