Detection of KRAS Mutations Using Extracellular Vesicle DNA in Colorectal Cancer Patients
Funding: This study was supported by the Department of Gastroenterological Surgery and Japan Society for the Promotion of Science (22K08787).
ABSTRACT
Liquid biopsy using circulating tumor DNA (ctDNA) is useful for precision medicine and molecular-guided oncology; however, its sensitivity is insufficient. We focused on DNA in extracellular vesicles (evDNA) as a new target for liquid biopsy and investigated its sensitivity. This observational study included 334 Stage I–IV colorectal cancer patients. evDNAs and ctDNAs were extracted from plasma collected before surgery. KRAS mutation status was analyzed using droplet digital PCR. One hundred and forty-eight patients had KRAS mutations in tumor tissues, and 186 patients had no KRAS mutations. In Stage II (Stage II 37.8% vs. 13.3%, p = 0.015) or III (Stage III 43.1% vs. 13.6%, p = 0.001) patients, sensitivities to detect KRAS mutations using evDNA were higher than those using ctDNA. Surprisingly, evDNA identified KRAS mutations in 13.8% of patients who lacked them in tumor tissue samples. Among Stage III patients, those with higher concentrations of evDNA had significantly poorer relapse-free survival compared with those who had lower concentrations of evDNA (p = 0.043). The use of evDNA improved the identification rate of KRAS mutations. By using evDNA, KRAS mutations were identified in more than 10% of patients without KRAS mutations in their tumor tissues. The concentration of evDNA can be a prognostic factor for Stage III colorectal cancer patients.
Abbreviations
-
- ctDNA
-
- circulating tumor DNA
-
- ddPCR
-
- droplet digital PCR
-
- EV
-
- extracellular vesicle
-
- evDNA
-
- DNA within EVs
-
- MRD
-
- minimal residual disease
-
- OS
-
- overall survival
-
- RFS
-
- relapse-free survival
1 Introduction
Precision medicine and molecular-guided oncology are evolving rapidly [1]. Physicians consider therapeutic options based on the genomic profile of tumors; however, different parts of a tumor can have different genetic and epigenetic profiles (spatial heterogeneity) [2, 3]. Moreover, the molecular makeup of tumors can dynamically evolve, driven by microenvironmental stimuli and clonal selection under treatment pressure (temporal heterogeneity) [4, 5]. Such tumor heterogeneity can complicate the prediction of drug efficacy using precision medicine and molecular-guided oncology [6]. Liquid biopsy, using circulating tumor DNA (ctDNA), is an efficient countermeasure for drug resistance caused by heterogeneity [7-9]. Some studies have shown potential advantages of ctDNA over tissue biopsy [10, 11]. We also have demonstrated the usefulness of blood-based [12-15] and urine-based [16] liquid biopsy in detecting heterogeneity. However, the sensitivity of liquid biopsy is still inadequate, leaving room for improvement. Some patients who have received clinical curative surgery continue to harbor trace numbers of tumor cells postoperatively (minimal residual disease [MRD]), and MRD can cause recurrent disease [17-22]. MRD is extremely helpful to predict the risk of recurrence; however, some patients without MRD also experience recurrence [17-20]. This indicates that the accuracy of ctDNA-based MRD detection is insufficient.
Plasma-derived ctDNA is shed from dying cancer cells through apoptosis and necrosis. Many ctDNAs are fragmented (approximately 150 bp), which may hinder improvement of sensitivity. Unlike ctDNA, extracellular vesicles (EVs) are released continuously from living cancer cells and also contain DNA (evDNA), RNA, and protein [23, 24]. evDNA includes larger nucleotide fragments than ctDNA [25]. evDNA has better sensitivity to detect KRAS mutations compared with ctDNA in patients with pancreatic cancer [26]. evDNA also has better sensitivity to detect EGFR mutations in patients with lung cancer [27]. However, only one study, which included 70 metastatic colorectal cancer patients, has shown utility in analyzing EVs to detect cancer-specific mutations in patients with colorectal cancer [28]. However, that study only evaluated KRAS G12V and G12D. It did not include nonmetastatic patients and did not compare evDNA and ctDNA.
In this study, we detected KRAS mutations (codon 12, 13, 61, and 146) using evDNA and ctDNA from patients with metastatic and nonmetastatic colorectal cancer. We were particularly interested in the utility of evDNA analysis for nonmetastatic patients.
2 Methods
2.1 Patients and Study Design
This observational study included consecutive colorectal cancer patients who underwent surgery at our institution between August 2018 and March 2021. Patients were followed until July 2023. All patients participated in our Multi-Biopsy Bank Project studies, and tissue and blood samples were stored in our biobank. All study subjects provided written informed consent. The protocol was approved by the Ethics Review Committee of Nippon Medical School (Tokyo, Japan, approval no. 28-03-738). This study, which involved evDNA and ctDNA analysis, was similarly approved by the Ethics Review Committee of Nippon Medical School (Tokyo, Japan, approval no. M-2021-011), and opt-outs were provided to participants. The study was conducted according to the ethical guidelines of the Declaration of Helsinki.
Inclusion criteria were as follows: (1) patients age ≥ 20 years; (2) histologically confirmed colorectal adenocarcinoma; and (3) elective surgery with R0 resection. Exclusion criteria were as follows: (1) secondary malignancies; (2) clinical history of cancer in other organs; and (3) severe comorbidities, such as chronic heart failure, chronic renal disease, or connective tissue disease.
2.2 Tumor DNA Extraction From Frozen Tissue Samples
Fresh surgical samples of cancer tissue were obtained and stored at −80°C. We extracted DNA from fresh tissue samples using NucleoSpin Tissue Kits (Takara Bio, Kusatsu, Shiga, Japan). Amounts of DNA were measured using a Qubit 2.0 Fluorometer (Thermo Fisher Scientific, Waltham, MA, USA).
2.3 Blood Sample Collection and Extraction of ctDNA and evDNA
Just before the start of surgery, 10 mL of peripheral blood was obtained using BD Vacutainer EDTA tubes (Becton Dickinson and Company, Sparks, MD, USA), and blood plasma was separated within 3 h. Plasma samples were prepared by centrifugation at 1900 g for 10 min at 4°C and stored until use at −80°C. After recentrifugation at 16,000 g for 10 min at 4°C to eliminate debris, ctDNA was extracted from 1 mL of plasma using Maxwell RSC cfDNA Plasma Kits (Promega, Madison, WI, USA) according to the manufacturer's protocol. EVs were extracted from 1 mL of plasma using a Total Exosome Isolation Kit (Thermo Fisher Scientific). Briefly, 1 mL of plasma collected was centrifuged at 2000 g for 20 min at room temperature to remove large debris. Supernatant was centrifuged at 10,000 g for 30 min at room temperature to remove microvesicles. Then, 1× PBS (0.1 μm filtered), proteinase K, and Exosome Precipitation Reagent were added per the manufacturer's protocol, and the solution was centrifuged at 10,000 g for 5 min at room temperature. The resulting pellet was suspended in 300 μL of 1× PBS for further analysis. EVs were assessed using western blotting, transmission electron microscopy, and nanoparticle tracking analysis (see Data S1 for detailed method).
evDNA was extracted using the DNA mini kit (QIAGEN, Venlo, Holland). Total evDNA and ctDNA concentrations were determined using the Qubit 2.0 dsDNA high-sensitivity assay (Thermo Fisher Scientific). Length of evDNA and ctDNA was measured using the Agilent 2100 Bioanalyzer (Agilent Technologies, Palo Alto, CA, USA). Methods of transmission electron microscopy analysis, nanoparticle tracking analysis, and Western blotting are described in Data S1.
2.4 Mutation Detection Using Droplet Digital PCR
DNA samples were adjusted to 1000 ng/mL, and KRAS mutations were detected using QX200 droplet digital PCR (ddPCR; Bio-Rad Laboratories, Hercules, CA, USA) according to the manufacturer's protocol. Briefly, ddPCR was performed using the PrimePCR kit (Bio-Rad Laboratories), which includes TaqMan technology. Primers and TaqMan probes for KRAS mutations were designed and synthesized by Bio-Rad Laboratories. Positive results were defined as variant allele frequencies ≥ 0.1%.
2.5 Statistical Analysis
All statistical analyses were performed using R version 4.1.2 (The R Foundation for Statistical Computing, Vienna, Austria). For categorical variables, group comparisons used the chi-squared or Fisher's exact test. McNemar's test was used to compare the sensitivity of ctDNA with that of evDNA. The Mann–Whitney U test was used to analyze quantitative variables. Differences in relapse-free survival (RFS) and overall survival (OS) were examined using log-rank tests following data analyses using the Kaplan–Meier method.
3 Results
3.1 Patient Selection
During the study period, 353 patients were enrolled, and 19 patients (13 with a clinical history of cancer in other organs and 6 with severe comorbidities) were excluded; the remaining 334 patients (148 patients with KRAS mutations in their primary tumor) were included. The mean follow-up period for patients who were alive at the cutoff point was 37.6 months. Table 1 shows patient characteristics.
| All patients (N = 334) | With KRAS mutations (N = 148) | Without KRAS mutations (N = 186) | p | |
|---|---|---|---|---|
| Age | 70 | 71 | 75 | 0.38 |
| Range | 26–93 | 35–91 | 33–94 | |
| Gender | ||||
| Male (%) | 212 (63.5) | 97 (65.5) | 115 (59.1) | 0.55 |
| Female (%) | 122 (36.5) | 51 (34.5) | 71 (40.9) | |
| Stage | ||||
| I (%) | 43 (13.0) | 14 (9.5) | 29 (15.6) | 0.30 |
| II (%) | 97 (29.0) | 45 (30.4) | 52 (28.0) | |
| III (%) | 103 (30.8) | 44 (29.7) | 59 (21.7) | |
| IV (%) | 91 (27.2) | 45 (30.4) | 46 (24.7) | |
| Location | ||||
| Right sided (%) | 113 (33.8) | 57 (38.5) | 56 (30.1) | 0.13 |
| Left sided (%) | 221 (66.2) | 91 (61.5) | 130 (69.9) | |
| Histology | ||||
| Tub1/Tub2 (%) | 278 (83.8) | 131 (88.5) | 147 (79.0) | 0.03 |
| Others (%) | 56 (16.2) | 17 (11.5) | 39 (21.0) | |
| CEA (ng/mL) | 4.3 | 5.4 | 3.5 | < 0.001 |
| Range | 0.5–2088 | 0.6–1200 | 0.5–2088 | |
| CA19-9 (U/mL) | 8.2 | 9.7 | 6.8 | 0.04 |
| Range | 2.0–12,000 | 2.0–9720 | 2.0–12,000 | |
- Abbreviation: CEA, carcinoembryonic antigen.
3.2 Analyses of evDNA and ctDNA and EV Particle Number
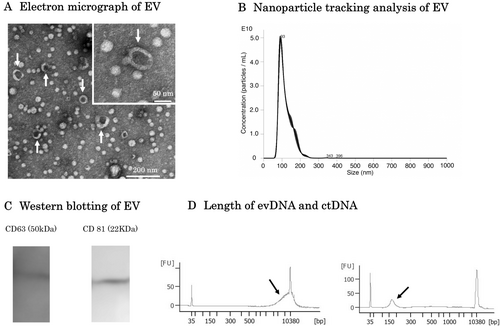
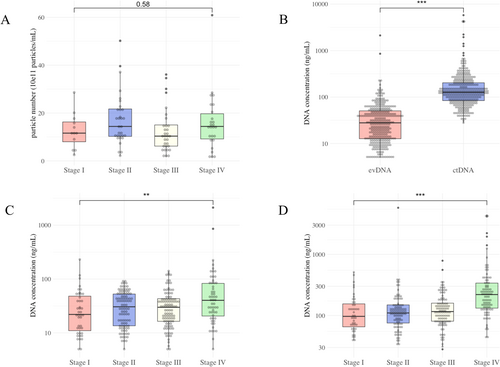
An electron micrograph of the double-membrane structure of EVs isolated from the blood of a colorectal cancer patient who participated in this study is shown in Figure 1A. Nanoparticle tracking analysis showed that the majority of EVs collected in this study were approximately 100 nm in size (Figure 1B). CD63 and CD81, both of which are characteristic markers of EVs, were confirmed by western blotting (Figure 1C). The lengths of evDNA and ctDNA are shown in Figure 1D. ctDNA was fragmented to less than 150 bp with a peak at 100 bp, while evDNA fragmentation was relatively mild with a peak at 10,000 bp. The analysis data of evDNA collected from eight participants in this study are shown in Figure S1. DNA longer than 10,000 bp was observed in all patients. There were no differences in EVs particle numbers among stages (p = 0.58, Figure 2A). The concentration of evDNA was significantly lower than that of ctDNA (p < 0.001, Figure 2B). Concentrations of evDNA (p < 0.001, Figure 2C) and ctDNA (p = 0.005, Figure 2D) in Stage IV patients were higher than those in Stage I.
3.3 Detection Rate of KRAS Mutations
Among patients with KRAS mutations in tissue samples (Table 2) and those without (Table 3), KRAS mutation detection rate using evDNA was significantly higher than that using ctDNA in Stage II and Stage III patients, while there were no significant differences between Stage I and Stage IV patients.
| N = 148 | evDNA | ctDNA | p |
|---|---|---|---|
| Stage I (N = 14) | 5 (35.7%) | 2 (14.2%) | 0.44 |
| Stage II (N = 45) | 17 (37.8%) | 6 (13.3%) | 0.015 |
| Stage III (N = 44) | 19 (43.1%) | 6 (13.6%) | 0.001 |
| Stage IV (N = 45) | 21 (46.6%) | 19 (48.1%) | 0.80 |
| All (N = 148) | 62 (41.9%) | 33 (22.3%) | < 0.001 |
| N = 186 | evDNA | ctDNA | p |
|---|---|---|---|
| Stage I (N = 29) | 2 (6.9%) | 1 (3.4%) | 1 |
| Stage II (N = 52) | 6 (11.5%) | 0 (0.0%) | 0.04 |
| Stage III (N = 59) | 11 (18.6%) | 0 (0.0%) | 0.002 |
| Stage IV (N = 46) | 6 (13.0%) | 1 (2.1%) | 0.13 |
| All (N = 186) | 25 (13.8%) | 2 (1.1%) | < 0.001 |
Among 45 Stage IV patients with KRAS mutations in tumor tissue, 36 had liver metastasis. Using evDNA, the KRAS mutation detection rate in patients with liver metastasis was 47.2% and 44.4% in patients without liver metastasis. Using ctDNA, the KRAS mutation detection rate was 50.0% in patients with liver metastasis and 11.1% in patients without it (Table 4). Among 46 Stage IV patients without KRAS mutation in tumor tissue, 36 had liver metastasis. Using evDNA, the KRAS mutation detection rate was 13.9% in patients with liver metastasis and 11.1% in patients without. Using ctDNA, the KRAS mutation detection rate was 2.8% in patients with liver metastasis and 0% (0/10) in patients without (Table 5). Among patients with KRAS mutation in tumor tissue, chemotherapy-naïve patients had a higher detection rate of KRAS mutations, regardless of whether ctDNA or EVs were used; however, there were no significant differences (Table 6).
| N = 45 | With liver metastasis (N = 36) | Without liver metastasis (N = 9) | p |
|---|---|---|---|
| evDNA (%) | 47.2 | 44.4 | 1 |
| ctDNA (%) | 50.0 | 11.1 | 0.058 |
| N = 46 | With liver metastasis (N = 36) | Without liver metastasis (N = 10) | p |
|---|---|---|---|
| evDNA (%) | 13.9 | 11.1 | 1 |
| ctDNA (%) | 2.8 | 0 | 1 |
| Chemotherapy received (N = 10) | Chemotherapy naïve (N = 46) | p | |
|---|---|---|---|
| ctDNA | 3 (30.0%) | 16 (45.7%) | 0.48 |
| evDNA | 4 (40.0%) | 17 (48.6%) | 0.73 |
KRAS mutations were identified in six patients using evDNA and in one patient using ctDNA (Table 7). In three of the seven cases, additional liquid biopsies were performed later. In Case 3, the KRAS mutation in exoDNA disappeared after the initiation of chemotherapy. In Case 4, although the metastatic lesion was resected, recurrence occurred, and at that time, the KRAS mutation was identified in ctDNA. In Case 7, after chemotherapy resulted in progression disease, the hepatic metastatic lesion was resected, and subsequently, the KRAS mutation in ctDNA disappeared. Among six patients in whom KRAS mutations were identified using EVs, two patients did not receive chemotherapy due to poor performance status, and one patient did not receive chemotherapy because the metastatic lesion was completely resected. Two patients received bevacizumab, and only one patient received FOLFOX plus cetuximab. In the patient who received cetuximab, the tumor shrank after 3 months. However, due to the development of interstitial pneumonia, cetuximab was discontinued, and during this period, the tumor increased in size. As a result, the clinical evaluation of efficacy in this case was determined to be stable disease. The one case in which a KRAS mutation was identified using ctDNA received FOLFOX plus panitumumab therapy but experienced progression disease.
| Case | Age | Sex | Detection modality | Metastatic site | Chemotherapy | Efficacy | OS (months) | Survival |
|---|---|---|---|---|---|---|---|---|
| 1 | 43 | M | exoDNA | Liver/P/Bone | None | 4 | Dead | |
| 2 | 62 | F | exoDNA | Liver/PALN | None | 2 | Dead | |
| 3 | 68 | M | exoDNA | Liver | FL + Bevacizumab | SD | 59 | Alive |
| 4 | 70 | M | exoDNA | Lung | None | 58 | Alive | |
| 5 | 64 | M | exoDNA | Liver | FOLFOX + Cetuximab | SD | 35 | Alive |
| 6 | 73 | M | exoDNA | Liver | CAPX + Bevacizumab | SD | 8 | Dead |
| 7 | 65 | M | ctDNA | Liver | FOLFOX + Panitumumab | PD | 42 | Dead |
- Abbreviations: FL, fluoropyrimidine + leucovorin; P, peritoneal dissemination; PALN, para-aortic lymph node metastasis; PD, progression disease; SD, stable disease.
3.4 Correlation of ctDNA or evDNA Concentration With Survival
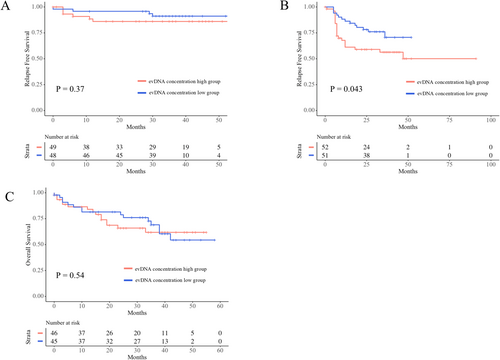
evDNA concentration had no relationship with the RFS of Stage II patients (p = 0.37, Figure 3A), while Stage III patients with higher evDNA concentrations had shorter RFS (p = 0.043, Figure 3B). ctDNA concentration had no relationship with the RFS of Stage II (p = 0.17) or Stage III (p = 0.98) patients. The concentration of both evDNA (p = 0.78, Figure 3C) and ctDNA (p = 0.53) did not reflect the OS of Stage IV patients.
3.5 Prognostic Effect of KRAS Mutations
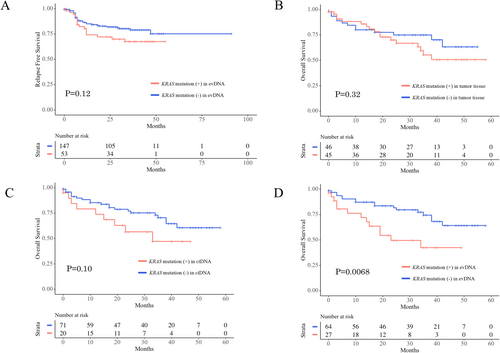
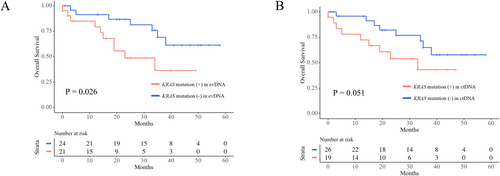
Among 200 Stage II/III patients, 89 (44.5%) had KRAS mutations in tumor tissue, 53 (26.5%) had KRAS mutations in their evDNA, and 12 (6.0%) had KRAS mutations in their ctDNA. KRAS mutations in their tumor tissue (p = 0.96) and in their ctDNA (p = 0.64) did not affect RFS, whereas patients with KRAS mutations in their evDNA had shorter RFS than patients without; however, the difference is not statistically significant (p = 0.12, Figure 4A). Among 91 Stage IV patients, KRAS mutations in their tumor tissue did not affect OS (p = 0.32, Figure 4B). Patients with KRAS mutations in their evDNA had shorter OS than patients without KRAS mutations (p = 0.0068, Figure 4C). Patients with KRAS mutations in their ctDNA had shorter OS than patients without KRAS mutations; however, the difference was not significant (p = 0.10, Figure 4D). Among 45 Stage IV patients with KRAS mutations in their tumor tissue, patients with KRAS mutations in their evDNA had shorter OS than patients without KRAS mutations (p = 0.026, Figure 5A). Patients with KRAS mutations in their ctDNA also had shorter OS than patients without KRAS mutations; however, the difference was not significant (p = 0.051, Figure 5B).
4 Discussion
There were three novel, important findings in the present study, which included more patients than previous studies evaluating KRAS mutation detection sensitivity using evDNA. First, the KRAS mutation detection rate using evDNA is much higher than that using ctDNA, even though the concentration of evDNA is much lower than that of ctDNA. Second, spatial heterogeneity is more common than we imagined. Third, the concentration of evDNA significantly reflected the prognosis of Stage III patients; however, the concentration of ctDNA did not.
To our knowledge, this is the first study to demonstrate the superiority of evDNA over ctDNA in identifying KRAS mutations. We showed that in patients with and without KRAS mutations, the detection rate using evDNA is substantially higher than ctDNA for patients with Stage II or III. Our sample only included a small number of Stage I patients; hence, we were unable to demonstrate the utility of evDNA in Stage I. For Stage IV patients (45 with KRAS mutations and 46 without), the sensitivity between the two methods was similar. We believe that in Stage IV KRAS-mutant cases, the detection rate using ctDNA is higher than that in Stages I–III; therefore, it is comparable to that using evDNA. Notably, the sensitivity of evDNA in Stage IV cases without liver metastases was significantly superior to that of ctDNA. It is well known that ctDNA exhibits low sensitivity in cases without liver metastases [19]. Lucchetti et al. [28] extracted evDNA from 70 metastatic colorectal cancer patients (33 patients with KRAS mutations and 37 without) but did not obtain ctDNA. Choi et al. [29] compared the sensitivity of the two methods, but their sample size was only 30 colorectal cancer patients. Remarkably, in pancreatic cancer patients, the KRAS mutation detection rate with evDNA dramatically exceeds that of ctDNA, unlike our findings in colorectal cancer [26]. On the other hand, in Stage IV KRAS wild-type cases, although not statistically significant, the detection rate using evDNA was 10% higher. This suggests that evDNA may have a greater capacity to identify spatial heterogeneity.
While the reason evDNA demonstrates greater potential for detecting KRAS mutations than ctDNA remains unclear, the lipid bilayer of the EVs protects DNA against degradation and denaturation in the bloodstream [30, 31]. As a result, EVs contain larger nucleotide fragments than ctDNA, typically ranging between 2.5 and 10 kb [30, 32]. Consistent with this, our study also found many long DNA fragments in evDNA. Furthermore, CD47 on EVs aids in evading phagocytosis by circulating monocytes, extending the half-lives of EVs in circulation [33].
Spatial heterogeneity may be present at a higher frequency than previously reported, and analyzing evDNA offers better potential to detect such heterogeneity. Among patients without KRAS mutation in tumor tissue, the detection rate of KRAS mutation using evDNA was significantly higher than that using ctDNA. This difference was even more pronounced in Stage II or III patients. Lucchetti et al. [28] also reported that KRAS heterogeneity was seen in 11.6% of Stage IV colorectal cancer patients; however, they did not show the prevalence of the heterogeneity for Stages I–III patients. Some researchers, including us, reported that the detection rate of KRAS heterogeneity in chemo-naïve Stage IV colorectal cancer using ctDNA ranged between 4% and 9% [12, 17, 18]. The efficacy of first-line chemotherapy with anti-EGFR antibodies has been reported to be around 80% [34, 35]. Potential reasons for the reduced effectiveness of anti-EGFR antibodies in patients without RAS mutation in their tumor tissue include the amplification of MET and HER2 and the presence of RAS or BRAF heterogeneity [36]. For patients receiving anti-EGFR antibodies, identifying RAS mutations using blood, in addition to tissue, may have significant clinical implications. Rechallenge with anti-EGFR antibodies demonstrates a clinical benefit, and a ctDNA-guided rechallenge is an effective strategy for identifying colorectal cancer patients suitable for anti-EGFR antibody rechallenge, optimizing treatment efficacy [37, 38]. With its superior capacity to detect heterogeneity, evDNA may facilitate more precise patient selection. Unfortunately, this study did not include a sufficient number of KRAS wild-type Stage IV cases to examine the impact of heterogeneity on the effectiveness of chemotherapy. Considering the proportion of patients with KRAS heterogeneity, it would be necessary to collect several hundred KRAS wild-type Stage IV cases treated with anti-EGFR antibodies.
The concentration of evDNA significantly affects the prognosis of Stage III patients, whereas the concentration of ctDNA does not influence prognosis. In this study, there were no significant differences in the particle number of EVs between stages. However, the concentrations of evDNA in Stage IV patients were notably higher. These findings suggest a correlation between evDNA concentration and prognosis. To date, no studies have shown a relationship between evDNA concentration and the prognosis of colorectal cancer patients. This study does not explain why Stage III patients with higher evDNA concentrations had a poorer prognosis. However, it is worth noting that while ctDNA originates from dead cells, evDNA is generated by living cells. Additionally, when taken up by organ-specific cells, tumor-derived EVs prepare the premetastatic niche [39]. This difference may provide insights into the underlying mechanism. Including our publication, two studies indicate that patients receiving chemotherapy with increased ctDNA concentrations have a reduced OS [40, 41]. In colorectal cancer patients, ctDNA quantity rises at recurrence [42].
In Stage IV patients, those with KRAS mutations in evDNA had poorer prognosis, likely due to a larger tumor burden compared to patients without KRAS mutations in evDNA. Since EVs are produced by living cells, it is assumed that a larger tumor burden would result in a greater production of tumor-derived EVs. Conversely, as ctDNA is released from dead cells, evDNA may more accurately reflect the quantity of viable tumor cells. However, this study does not provide evidence to support this assumption.
This study has several limitations. First, it was conducted at a single center. While various methods are available for evDNA isolation, our research only delves into one. Our sample comprised a limited number of Stage I cases; thus, it does not provide a comprehensive view of the utility of evDNA analysis for this stage. Additionally, we did not demonstrate the efficacy of evDNA in Stage IV. For Stage IV patients, various factors, including patient performance status, whether surgery was performed, and the effect of chemotherapy, significantly influence survival duration. Consequently, discerning its importance through observational studies such as this one is inherently challenging. Finally, the most clinically significant aspect is the impact of KRAS status obtained from evDNA and ctDNA on the effectiveness of anti-EGFR antibody therapy in KRAS wild-type Stage IV cases; however, this study did not include a sufficient number of KRAS wild-type Stage IV cases to conclusively assess this effect.
In conclusion, our findings suggest that evDNA analysis has superior potential for detecting KRAS mutations, possibly because evDNA comprises very long, undamaged DNA strands.
Author Contributions
Sho Kuriyama: data curation, formal analysis, writing – original draft. Takeshi Yamada: conceptualization, data curation, formal analysis, writing – original draft, writing – review and editing. Toshimitsu Miyasaka: data curation, formal analysis. Kay Uehara: conceptualization. Ryo Ohta: data curation, formal analysis. Akihisa Matsuda: conceptualization. Goro Takahashi: data curation, formal analysis. Takuma Iwai: data curation, formal analysis. Kohki Takeda: data curation, formal analysis. Koji Ueda: data curation, formal analysis. Shintaro Kanaka: data curation, formal analysis. Yasuyuki Yokoyama: data curation, formal analysis. Seiichi Shinji: data curation, formal analysis. Hiromichi Sonoda: data curation, formal analysis. Takeshi Nagasaka: conceptualization. Hiroshi Yoshida: supervision, writing – review and editing.
Acknowledgments
We are grateful to Dai Suzuki for technically supporting the experiments.
Ethics Statement
Our biobank project was approved by the Medical Ethics Committee of Nippon Medical School (Bunkyo-ku, Tokyo, Japan; 28-03-738). The present study was approved by the Medical Ethics Committee of Nippon Medical School (Bunkyo-ku, Tokyo, Japan; B-2021-011).
Consent
Written informed consent for the biobank project was obtained from all patients. For the analysis of ctDNA and evDNA, an opt-out method on the website of our institution was used.
Conflicts of Interest
The authors declare no conflicts of interest.


