Novel CHI3L1-Associated Angiogenic Phenotypes Define Glioma Microenvironments: Insights From Multi-Omics Integration
Yu-Hang Zhao and Yu-Xiang Cai are equal contributors.
Funding: This work was supported by Translational Medicine Fund of the Zhongnan Hospital of Wuhan University, No. ZNLH201901.
ABSTRACT
The CHI3L1 signaling pathway significantly influences glioma angiogenesis, but its role in the tumor microenvironment (TME) remains elusive. We propose a novel CHI3L1-associated vascular phenotype classification for glioma through integrative analyses of multiple datasets with bulk and single-cell transcriptome, genomics, digital pathology, and clinical data. We investigated the biological characteristics, genomic alterations, therapeutic vulnerabilities, and immune profiles within these phenotypes through a comprehensive multi-omics approach. We constructed the vascular-related risk (VR) score based on CHI3L1-associated vascular signatures (CAVS) identified by machine learning algorithms. Utilizing unsupervised consensus clustering, gliomas were stratified into three distinct vascular phenotypes: Cluster A, marked by high vascularization and stromal activation with a relatively low levels of tumor-infiltrating lymphocytes (TILs); Cluster B, characterized by moderate vascularization and stromal activity, coupled with a high density of TILs; and Cluster C, defined by low vascularization and sparse immune cell infiltration. We observed that the CAVS effectively indicated glioma-associated angiogenesis and immune suppression by single-cell RNA-seq analysis. Moreover, the high-VR-score group exhibited enhanced angiogenic activity, reduced immune response, resistance to immunotherapy, and poorer clinical outcomes. The VR score independently predicted glioma prognosis and, combined with a nomogram, provided a robust clinical decision-making tool. Potential drug prediction based on transcription factors for high-risk patients was also performed. Our study reveals that CHI3L1-associated vascular phenotypes shape distinct immune landscapes in gliomas, offering insights for optimizing therapeutic strategies to improve patient outcomes.
Abbreviations
-
- CAVS
-
- CHI3L1-associated vascular signatures
-
- CGGA
-
- Chinese glioma genome atlas
-
- CHI3L1
-
- non-enzymatic chitinase-3 like-protein-1
-
- GEO
-
- gene expression omnibus
-
- GO
-
- gene ontology
-
- IDH1
-
- Isocitrate dehydrogenase 1
-
- TAMs
-
- tumor-associated macrophages
-
- TCGA
-
- The cancer Genome Atlas
-
- TILs
-
- tumor-infiltrating lymphocytes
-
- TME
-
- tumor microenvironment
1 Introduction
Gliomas represent the most prevalent primary malignant brain tumors, associated with high cancer-related morbidity and mortality [1]. Adult-type diffuse gliomas are classified into astrocytomas, oligodendrogliomas, and glioblastomas (GBM) [2]. A defining characteristic of gliomas is extensive vascularization, which is essential for tumor growth and survival. Antiangiogenic therapy, particularly with agents such as bevacizumab, is a fundamental element of glioma treatment strategies. However, the benefits of bevacizumab are largely confined to enhancing progression-free survival without significantly improving overall survival (OS) [3]. These limitations highlight the need to develop efficacious therapeutic strategies.
Tumor angiogenesis represents a critical immune evasion mechanism that fosters a highly immunosuppressive tumor microenvironment (TME), which influences the status of tumor-infiltrating lymphocytes (TILs). For example, pro-angiogenic factors, including vascular endothelial growth factor (VEGF), hepatocyte growth factor (HGF), and platelet-derived growth factor (PDGF), have been demonstrated to inhibit the maturation of dendritic cells and the function of effector T cells [4, 5]. On the one hand, aberrant angiogenesis impedes leukocyte infiltration into the tumor bed [6, 7]. Besides effector functions, the ability of immune cells to infiltrate the tumor parenchyma is essential for mounting a robust antitumor immune response, which is crucial for the success of cancer immunotherapies [8, 9]. Accordingly, the use of antiangiogenic agents to normalize aberrant tumor vasculature and facilitate leukocyte infiltration into the tumor is regarded as a promising strategy for enhancing the efficacy of immune checkpoint inhibitors (ICIs) [10, 11]. However, a recent clinical trial demonstrated that the combination of anti-VEGF treatment and ICIs did not enhance overall survival (OS) in patients with glioma [12], indicating that other pro-angiogenic factors might compromise the efficacy of this combination therapy. This variability highlights the critical need for reliable biomarkers for predicting ICI efficacy. Chitinase-3-like protein-1 (CHI3L1), also known as YKL40, is a secreted glycoprotein from the glycoside hydrolase family 18 [13]. It is produced by various cancers, including mesenchymal glioma, osteosarcoma, and gastric cancers [14, 15]. CHI3L1 is widely considered a motivator to trigger tumor vascular development through both VEGF-dependent and VEGF-independent pathways [16-18]. For example, CHI3L1 has been demonstrated to drive endothelial cell angiogenesis, even in the presence of anti-VEGF antibodies [19], indicating its intrinsic pro-angiogenic activity. This makes CHI3L1 an attractive target for modulating the pro-angiogenic phenotype of gliomas. Moreover, CHI3L1 has been shown to induce neutrophil extracellular trap formation, trapping T cells in the stroma and blocking their infiltration into the tumor [20]. Angiogenesis and immunosuppression are interconnected processes that frequently occur concurrently, contributing to the complex TME [10]. However, the relationship between angiogenesis and the immune landscape in glioma remains inadequately explored. A comprehensive analysis of the angiogenic phenotype orchestrated by CHI3L1 and its impact on the immune microenvironment in gliomas is crucial.
In this study, we identified a CHI3L1-associated vascular signature (CAVS) using machine learning algorithms and introduced novel distinct vascular phenotypes, each characterized by unique tumor features, including immune cell infiltration, metabolic reprogramming, and genomic alterations. Furthermore, we devised a vascular-related risk (VR) score as a quantitative tool for guiding therapeutic interventions and assessing prognostic outcomes.
2 Materials and Methods
2.1 Data Collection and Processing
Details regarding data acquisition and preprocessing are provided in Data S1.
2.2 Identification of CHI3L1-Related Vascular Signature Genes
Glioma vascular genes were identified based on the differential expression patterns observed between the vasculature of gliomas and normal blood vessels [21, 22]. Patients with gliomas were divided into two groups based on the median value of CHI3L1 expression. Differentially expressed genes (DEGs) between the two groups were analyzed using the DESeq2 R package. The cut-off values for DEGs were set at a log2 fold change greater than two and a false discovery rate (p adj) < 0.05. The intersection of DEGs and vascular genes was used to perform a prognostic analysis using univariate Cox regression analysis. Robustness of the identified genes was evaluated using bootstrapping. Subsequently, two machine learning algorithms, the least absolute shrinkage and selection operator (LASSO) algorithm and random survival forest (RSF) algorithm, were used to further identify robust prognostic signatures. The RSF analysis was repeated 1000 times independently, and genes with a relative importance greater than 0.75 were selected using the “randomForestSRC” R package [23]. The LASSO algorithm was conducted with 10-fold cross-validation using the glmnet R package [24]. Genes identified by both the RSF and LASSO algorithms were considered to constitute the CHI3L1-associated vascular signature (CAVS).
2.3 Establishment of Vascular-Related Risk (VR) Score
A VR score scheme was constructed based on CAVS to quantify the vascular-related phenotypes of individual patients, in accordance with the methodology outlined in a previous study [25]. Initially, an unsupervised clustering approach was used to categorize the patients into distinct clusters. Subsequently, CAVS expression levels, which showed positive or negative correlations with these clusters (Clusters A, B, and C), were categorized as vascular gene signatures A and B, respectively. The Boruta algorithm was employed to reduce the dimensionality of vascular gene signatures A and B. Subsequently, the first principal component (PC1) was extracted using PCA and served as the signature score. The VR score was defined as follows: VR score = ∑PC1A–∑PC1B.
2.4 Statistical Analysis
Statistical significance was defined as a two-sided p value of less than 0.05. All data processing and analyses were conducted using R software (version 4.3.1).
See (Data S1) for detailed bioinformatics methods and experimental methods descriptions.
3 Results
3.1 Identification of the CHI3L1-Associated Vascular Signature Genes
We evaluated the relationship between CHI3L1 expression and glioma progression in the TCGA (n = 647) and CGGA (n = 970) cohorts and found that increased CHI3L1 levels were correlated with higher glioma grades (Figure S1A). Survival analysis showed that patients with high CHI3L1 expression had significantly poorer OS compared to those with low expression (p < 0.001, Figure S1B). Multivariate Cox regression identified CHI3L1 as an independent predictor of poor survival outcomes (Figure 1A). Consistent with the enrichment of the angiogenesis pathway (Figure S1C), patients with high CHI3L1 expression had a greater abundance of endothelial cells (Figure 1B). Furthermore, high CHI3L1 expression was significantly associated with key angiogenic signatures, including VEGFA, PIGF, ANGPT1, ANGPT2, and FGF1 (Figure S1D). Immunohistochemistry (IHC) and H&E staining further confirmed that elevated CHI3L1 expression was associated with increased tumor vascular density in glioma tissues (Figures 1C and S1E).
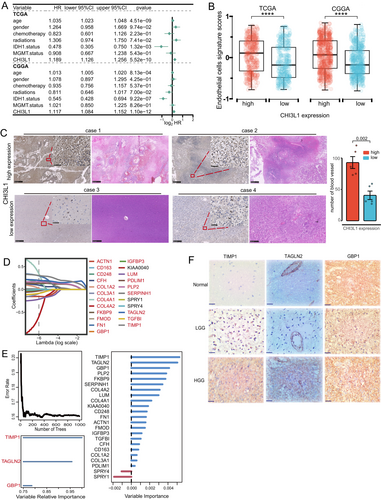
To identify CHI3L1-associated angiogenesis genes, we analyzed 798 differentially expressed genes (DEGs) between high- and low-CHI3L1 expression groups (Table S1). From the literature [21, 22], we compiled 456 glioma vascular genes (Table S2) and identified 30 overlapping genes between the two datasets (Figure S1F). Among these, 23 genes were significantly associated with prognosis (p < 0.001, Figure S1G). Using LASSO and RSF algorithms, we further refined this set, with LASSO identifying 20 genes (Figures 1D and S1H) and RSF highlighting genes with a relative importance score > 0.75 (Figure 1E). Both analyses converged on three key genes: TAGLN2, GBP1, and TIMP1, forming the CHI3L1-associated vascular signature (CAVS). Correlation analysis revealed a strong association between these CAVS genes and CHI3L1 expression (R > 0.7, Figure S1I). Furthermore, in vitro studies demonstrated that CHI3L1 knockdown significantly reduced the expression of TIMP1, TAGLN2, and GBP1 in U251 glioma cell lines (Figure S1J). Immunohistochemical validation confirmed that TAGLN2, GBP1, and TIMP1 protein levels were significantly higher in high-grade glioma tissues compared to low-grade gliomas (Figure 1F).
3.2 Evaluation of Correlation Between CAVS and Single-Cell Characteristics in Glioma
We analyzed CAVS expression at the single-cell transcriptome level to explore its role in different cellular contexts. A total of 24,800 cells and 23 cell clusters were identified from seven cell types in single-cell RNA sequencing profiles (Figure 2A). Malignant glioma cells were detected using inferCNV analysis to calculate CNV scores (Figure S2A). Gene expression profiles revealed specific marker genes in each cell cluster (Figure S2B), with CAVS expression patterns shown across different cell types (Figure 2B). Notably, fibroblasts exhibited significant expression of α-SMA (ACTA2), a hallmark of cancer-associated fibroblasts (CAFs), indicating their transition into a more aggressive phenotype within the TME. Using the AUCell R package [26], we estimated CAVS expression levels, finding high-AUC cells predominantly in MES glioma cells (Clusters 3 and 8), tumor-associated macrophages (TAMs, Clusters 6 and 11), astrocytes (Cluster 19), CAFs (Cluster 18), and endothelial cells (ECs, Cluster 22) (Figure 2C).
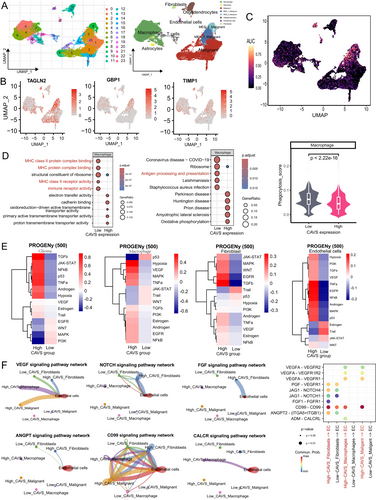
To further investigate CAVS function, we examined the biological processes of high- and low-CAVS clusters. GO and KEGG analyses revealed that TAMs with high CAVS expression had diminished immune functions, including antigen processing and presentation, compared to low-CAVS TAMs (Figure 2D). Phagocytic gene signature analysis showed that low-CAVS TAMs had higher phagocytosis scores than high-CAVS TAMs (Figure 2D). Pathway analysis indicated that high-CAVS glioma cells, TAMs, fibroblasts, and ECs displayed significant tumor-promoting activity, including tumor angiogenesis (Figures 2E and S2C). CellChat analysis was used to explore cell–cell interactions mediated by ligand-receptor signaling, revealing that glioma cells, TAMs, and fibroblasts regulate ECs through angiogenesis-related pathways, including VEGF, NOTCH, FGF, ANGPT, CD99, and CALCR. The high-CAVS group exhibited significantly stronger interactions with ECs compared to the low-CAVS group (Figures 2F and S2D,E).
3.3 Identification of Vascular-Related Molecular Phenotypes at the Bulk Transcriptome Level
To identify vascular-related phenotypes, unsupervised clustering was performed based on CAVS expression, resulting in the classification of patients into three clusters (A, B, and C). t-SNE analysis confirmed the effective separation of these subtypes (Figure 3A). Survival analysis revealed significant prognostic differences among the clusters, with Cluster A having the worst overall survival (OS) and Cluster C showing the best prognosis (p < 0.001; Figure 3B).
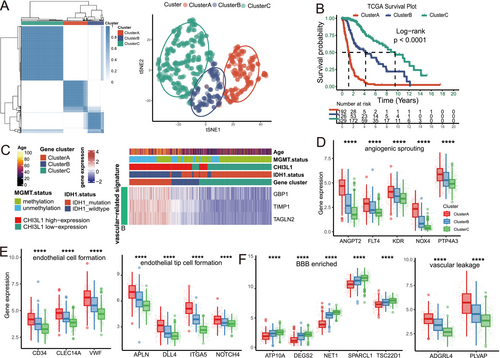
The correlation between the expression of CAVS and clinicopathological characteristics was also examined. Cluster A was characterized by a high prevalence of IDH1 wild-type status, elevated CHI3L1 expression, and older patient age (Figure 3C). Additionally, Cluster A exhibited an angiogenic phenotype, marked by angiogenic sprouting (Figure 3D), endothelial cell formation, and endothelial tip cell differentiation (Figure 3E). In contrast, Cluster C displayed a quiescent endothelial profile, featuring low-permeability vasculature and enrichment of blood–brain barrier (BBB) components [27] (Figure 3F).
3.4 Characteristics of Tumor Immune Microenvironment (TIME) in Distinct Phenotypes
We investigated the underlying biological behaviors of the three clusters. Cluster A showed significantly elevated activity in stromal and tumorigenic pathways, including epithelial-mesenchymal transition (EMT), angiogenesis, TNF-α, EGFR, MAPK, and hypoxia signaling. Additionally, the infiltration levels of 24 microenvironment cell types were analyzed. Cluster A had markedly increased infiltration of both pro-tumor and anti-tumor cells, such as neutrophils, fibroblasts, CD8+ T cells, DCs, and NK cells, while these levels progressively decreased in Clusters B and C (Figure 4A). Cluster A also exhibited significantly higher immune checkpoint expression compared to Clusters B and C. This immune profile was further validated in meta-cohorts (Figure S3A,B).
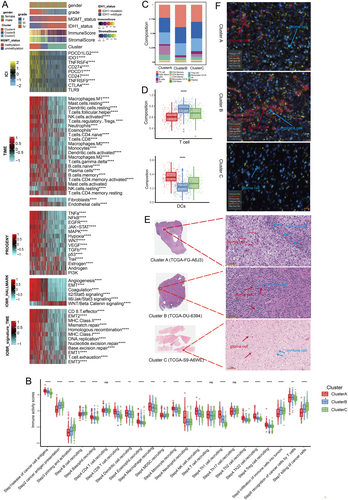
To assess anti-cancer immune responses, we analyzed the cancer immunity cycle [28]. Cluster A demonstrated increased activity in Step 1 (release of cancer cell antigens) and Step 4 (trafficking of immune cells to tumors) (Figure 4B). Cluster B showed the highest immune cell infiltration (Step 5), while Cluster C had the greatest capacity for antigen presentation (Step 2), priming and activation (Step 3), and cancer cell death (Step 7). The relative abundance of tumor-infiltrating immune cells was also examined, with DCs being most abundant in Cluster A, T cells in Cluster B, and B cells in Cluster C (Figures 4C,D and S3C).
Solid tumors are classified into three immunological phenotypes based on the status of tumor-infiltrating T cells: immune-excluded, immune-inflamed, and immune-desert. The immune-excluded phenotype, characterized by abundant immune cells located in the stroma rather than the tumor core [29], is observed in Cluster A, which exhibits significant stromal activation, high immune cell infiltration, and low TILs. Cluster B, distinguished by a considerable presence of TILs, likely represents an immune-inflamed phenotype. Cluster C, with minimal immune cell infiltration, was hypothesized to represent an immune-desert phenotype. Diagnostic slides from TCGA samples were analyzed, and three representative whole slide images (WSI) were displayed (Figure 4E). Cluster A patients showed low TILs, Cluster B patients had a high density of TILs, and Cluster C patients exhibited high tumor purity with low TME cell infiltration. These immunological phenotypes for Clusters A, B, and C were consistent with the pathological features observed through multi-color immunofluorescence analysis (Figure 4F).
3.5 Metabolic, Ferroptosis, Senescence, and Genome Alterations Characteristics Among Vascular-Related Phenotypes
To explore the metabolic reprogramming of vascular-related phenotypes within the TME, we assessed enrichment scores for metabolic pathways across phenotypes. Cluster A was positively associated with metabolic pathways promoting tumor growth, including kynurenine and tryptophan metabolism, arachidonic acid metabolism, and cofactor and vitamin metabolism. In contrast, Cluster C showed upregulation of tumor-suppressive pathways, such as butanoate, taurine, and hypotaurine metabolism (Figure 5A). Correlation analyses revealed that the pathways enriched in Cluster A were linked to angiogenesis, immune checkpoint expression, immunosuppressive activity, and poor prognosis (Figure 5B). Cluster A also demonstrated significantly elevated senescence and FPI scores compared to Clusters B and C, suggesting increased levels of senescence and ferroptosis (p < 0.05, Figure 5C,D).
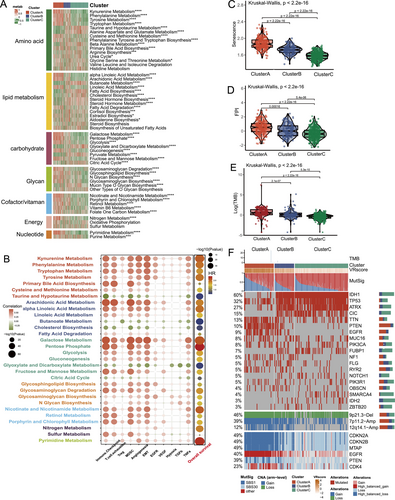
We also examined genomic differences across phenotypes, focusing on mutation signatures and single nucleotide variants (SNVs). Cluster A exhibited a higher tumor mutational burden (TMB) than Clusters B and C (p < 0.001; Figure 5E) and showed increased mutation rates in the age-related signature (SBS1) and base excision repair deficiency signature (SBS30). Among the top 20 mutated genes, IDH1, ATRX, CIC, and NOTCH1 mutations were prevalent in Cluster C, while PTEN mutations were more common in Cluster A (Figure 5F). Notably, Cluster A exhibited amplification of 7p11.2 (EGFR), 12q14.1 (CDK4), deletion of 9p21.3 (CDKN2A/B, MTAP), and PTEN loss (Figure 5F).
3.6 Construction of Vascular-Related Score and Exploration of Its Clinical Relevance
The VR score, derived from three hub genes, was developed to evaluate vascular-related phenotypes in individual patients. In the TCGA cohort, the Kruskal–Wallis test revealed that Cluster A had the highest VR score, followed by Clusters B and C (Figure S4A, p < 0.001). Survival analysis across multiple cohorts demonstrated that patients with higher VR scores had significantly worse prognoses, with subgroup analysis validating its prognostic value across different glioma grades (p < 0.001, Figure 6A). Univariate Cox analysis also indicated that patients with higher VR scores had poorer overall survival (OS) compared to those with elevated VEGFA levels (Table S3). Additionally, the VR score showed a strong correlation with angiogenesis (R > 0.92, Figure S4B).
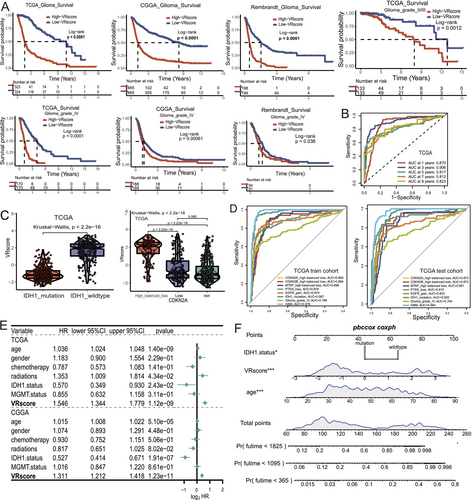
We validated the VR score's utility by integrating clinical and molecular characteristics. The AUC values for the VR score at 1, 3, and 5 years for OS were 0.87, 0.906, and 0.817, respectively, in the TCGA cohort, with similar results in the CGGA and Rembrandt cohorts (Figures 6B and S4C). Given the critical role of molecular markers such as IDH1 mutation, CDKN2A/B loss, PTEN loss, and EGFR gain in glioma classification, we further evaluated the VR score's predictive ability for these markers. The VR score demonstrated a significant association with these markers, along with high AUC values ranging from 0.874 to 0.967 (Figures 6C,D and S4D–F, p < 0.001). In multiple cohorts, it also showed high accuracy in predicting GBM status (AUC = 0.978, 0.964, and 0.854, Figures 6D and S4G). Multivariate analysis identified the VR score as an independent prognostic factor (Figure 6E, p < 0.001). The nomogram integrating the VR score and clinical factors demonstrated strong predictive accuracy and potential for clinical application (Figures 6F and S4H,I).
3.7 The Correlation Between the VR Score and Immune Status and ICIs Therapy Response
To explore the molecular mechanisms linking the VR score to glioma prognosis, GSVA analysis revealed that the VR score was associated with immune response and angiogenesis pathways, including interferon-alpha response, EMT, and angiogenesis (Figure S5A). Analysis of the cancer-immunity cycle showed significant immune suppression in key processes (steps 2, 3, 5, and 7) within the high-VR-score group (Figure 7A). Correlation analysis further indicated a strong link between the VR score and pro-tumor factors, such as oncogenic pathways, T cell exhaustion, and immune checkpoint expression, suggesting an immunosuppressive status in the high-VR-score group (Figure S5B).
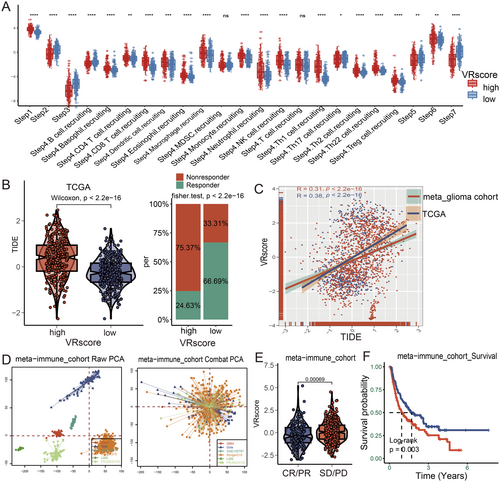
Given the VR score's association with immune response, we investigated its predictive value for ICI therapy. Patients with high VR scores had elevated TIDE scores and a lower likelihood of responding to ICIs (Figures 7B and S5C, p < 0.001). Additionally, the VR score was positively correlated with TIDE scores (Figure 7C; R > 0.3, p < 0.001). Across six immunotherapy cohorts, the VR score's predictive capacity for ICI response was further confirmed. PCA analysis illustrated baseline gene expression profiles before and after batch effect correction (Figure 7D). Patients with low VR scores exhibited superior responses to ICI therapy, demonstrating both enhanced responsiveness (Figure 7E, p = 0.003) and improved survival benefits (Figure 7F, p < 0.001) compared to those with high VR scores. These findings suggest that the VR score may serve as a valuable predictor of immunotherapy response in glioma patients.
3.8 Identification of Potential Therapeutic Agents for High-VR-Score Patients
To identify potential drugs for highly vascularized tumors, we analyzed IC50 values from a pan-cancer cell line dataset (GDSC, 749 samples) to explore the correlation between the VR score and sensitivity to antiangiogenic agents. Cancer cell lines with elevated VR scores showed lower IC50 values for Sorafenib, Lapatinib, Foretinib, and Cediranib, indicating enhanced sensitivity to these drugs (Figure 8A). Moreover, glioma patients with high VR scores demonstrated significantly greater responsiveness to Foretinib compared to those with low VR scores (Figure 8B).
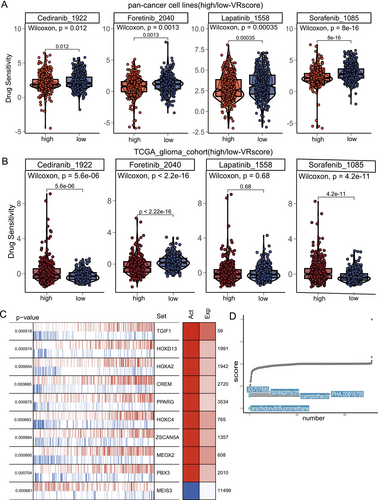
To identify potential therapeutic agents for high-VR-score patients, we performed XSum analysis based on transcription factors (TFs). The top 10 TFs, primarily involved in angiogenesis and EMT pathways, showed differential activity between high- and low-VR-score groups (Table S4, Figure 8C). Further screening of prognosis-related TFs (p < 0.001) identified arachidonyltrifluoromethane, camptothecin, PHA.00816795, tanespimycin, and X5707885 as the top five drugs with the lowest CMap scores, suggesting their potential efficacy in high-VR-score patients (Figure 8D).
4 Discussion
Angiogenesis is intimately linked to tumor growth and metastasis. Tumors that exhibit pronounced abnormal angiogenesis are usually aggressive and immunoinvasive. It is anticipated that combining antiangiogenic agents with immunotherapy may improve therapeutic efficacy. Therefore, exploring the immune response characteristics of angiogenic phenotypes is crucial for facilitating more effective patient selection for individualized ICIs therapy. In this study, we identified novel angiogenic phenotypes based on CAVS and developed an VR score that effectively reflects glioma angiogenesis and malignancy, assesses immune status, and predicts ICIs responses.
A growing body of evidence suggests that CHI3L1 is crucial for tumor vascularization and is emerging as a promising therapeutic target in oncology [15]. Our study further corroborates the assertion that CHI3L1 is an independent prognostic factor for glioma. Moreover, CHI3L1 expression is closely associated with IDH1 status, a critical prognostic marker in gliomas. A previous study has shown that the differential binding affinity between mutant and wild-type IDH1 to STAT3 critically regulated CHI3L1 expression. Mutant IDH1 exhibits stronger binding to STAT3 due to mutation-induced conformational changes, which stabilize a complex that sterically hinders JAK2-mediated phosphorylation of STAT3 at Tyr705. This suppressed phosphorylation reduces nuclear translocation of STAT3, thereby limiting its transcriptional activation of CHI3L1. Thus, IDH1 mutational status inversely correlates with CHI3L1 expression level via STAT3 binding affinity and activity modulation [30]. In this study, we identified three key genes (TAGLN2, GBP1, and TIMP1) that exhibited a high degree of correlation with CHI3L1. TAGLN2, a 24 kD actin-cross-linking protein featuring a calponin homolog domain, has been shown to promote the growth and invasion of gliomas in vitro and in vivo [31]. TAGLN2 was recently identified as a factor that enhances angiogenesis by triggering the NRP1/VEGFR2 pathway and subsequent MAPK signaling in gastric cancer [32]. TIMP1, a member of the matrix metallopeptidase inhibitor family, is predominantly expressed in tissue stroma and has been linked to glioma tissue stiffness [33]. Previous research has shown that TIMP1 is secreted by fibroblasts and plays a role in blood vessel formation via a MMP-dependent mechanism [34]. GBP1 is a 65-kDa protein linked by a GTPase hinge region and is a pivotal member of the interferon-inducible guanosine triphosphatase family [35]. GBP1 was identified as an activation marker that characterized the phenotype of endothelial cells activated by inflammatory cytokines [36]. Moreover, CAVS was predominantly expressed in MES-like glioma cells, TAMs, fibroblasts, and ECs at the single-cell level, suggesting that these cells may play a role in glioma angiogenesis. We further found that high-CAVS expression cell subpopulations may frequently communicate with ECs via VEGF, NOTCH, FGF, ANGPT, CD99, and CALCR signaling. These findings suggest that CAVS expression serves as a reliable indicator of glioma angiogenesis through various angiogenic pathways. TAMs represented the largest proportion of glioma-infiltrating immune cells. In this study, we observed significant suppression of phagocytosis and antigen presentation in high-CAVS TAMs, indicating potential immune suppression within this subset. We also uncovered that the NF-κB and TNF-α pathways were enriched in high-CAVS TAMs. Previous studies have implicated the activation of the NF-κB and TNF-α pathways in TAMs that were reported to induce angiogenesis and PD-L1 expression in tumor cells [37, 38]. Therefore, CAVS may serve as an indicator of immunosuppression and tumor angiogenesis.
In addition, three distinct phenotypes (Clusters A, B, and C) were identified based on the expression of CAVS, each characterized by varying degrees of vascularization and immune activity. Cluster A, with a high VR score, is characterized by elevated vascularization and pronounced vascular leakage, accompanied by high stromal activation and low levels of TILs. Furthermore, Cluster A shows increased expression of immune checkpoint molecules, defining this as an angiogenic-active/“immune-excluded” phenotype. Cluster B, associated with an intermediate VR score, exhibits moderate vascularization and stromal activity, accompanied by a high density of TILs. This suggests an angiogenic-intermediate/“immune-inflamed” phenotype. Cluster C, with a low VR score, presents with reduced vascularization and low immune cell infiltration, resembling an angiogenic-low/“immune-desert” phenotype. ICIs therapy has emerged as a promising avenue for tumor immunotherapy. Nevertheless, only a proportion of patients experienced beneficial outcomes [39]. Based on TIDE analysis and six real-world cohort studies, we observed that patients with high VR scores demonstrated a significantly lower rate of complete or partial responses to ICIs therapy. The mechanisms underlying ICIs therapy resistance in Cluster A are likely complex. The elevated tryptophan metabolism observed in Cluster A may impede T cell proliferation, potentially leading to T cell anergy or apoptosis and contributing to the differentiation of regulatory T cells (Tregs) [40]. The elevated ferroptosis levels observed in Cluster A have been demonstrated to drive the shift of TAMs toward an M2-like phenotype, contributing to suppressed antitumor immunity and resistance to immunotherapy [41]. Current literature reports that ferroptosis can inhibit tumor cell proliferation and invasion, but most studies only focus on its effect on tumor cells themselves and ignore its effect on other cells [42, 43]. Recently, ferroptosis in tumor cells has been shown to promote the recruitment of non-tumor cells and foster a pro-TME by releasing cytokines and inflammatory mediators [41]. These results indicate that ferroptosis enrichment may compromise antitumor immunity in glioma, and its inhibition may restore the immunosuppressive TME and improve ICIs efficacy. The frequent loss of 9p21 in Cluster A may confer immune evasion via multiple mechanisms, including dysregulation of the cell cycle, alterations in metabolic pathways, and/or impairment of the interferon response [44]. Moreover, Cluster C, with a higher proportion of tumor-infiltrating B cells, is associated with improved responses to ICIs therapy and a better prognosis compared to Clusters A and B. Intratumoral B cells are predominantly associated with the formation of tertiary lymphoid structures, making them potential biomarkers for patient prognosis and therapeutic response [45].
Targeting angiogenesis remains a promising therapeutic strategy for glioma. This study indicates that the high-VR-score group may exhibit potentially high sensitivity to foretinib. Previous studies have highlighted the translational therapeutic potential of foretinib in GBM [46, 47]. Moreover, AACOCF3 (arachidonyltrifluoromethane), a selective inhibitor of CPLA2 (PLA2G4A), was identified as the most promising candidate for high-risk patients. CPLA2, a phospholipase family member involved in phospholipid reprogramming in GBM [48]. Inhibitors targeting CPLA2 have demonstrated the ability to impair tumor angiogenesis, disrupt energy metabolism, inhibit proliferation, and enhance immune responses [48, 49]. In addition, we observed that elevated PLA2G4A expression was observed in the high VR score cohort, and this was connected to poorer outcomes (Figure S6A,B). However, modifying AACOCF3 is necessary since it has not been demonstrated to effectively traverse the blood–brain barrier.
The VR score established in this study was designed to assess angiogenesis levels in glioma patients and was identified as a more powerful independent prognostic factor, highlighting its potential for clinical application. Currently, genomic alterations such as IDH1 mutation, CDKN2A/B loss, PTEN loss, and EGFR gain are fundamental to the classification of gliomas. A strong correlation was found between the VR score and these molecular pathological features. The tumor suppressor genes CDKN2A/B and MTAP are located on chromosome 9p21 [50]. Depletion of CDKN2A and MTAP promotes tumor angiogenesis through the upregulation of MMP expression [51-53]. Loss of PTEN promotes angiogenesis via upregulation of VEGFA and STAT3 [54]. EGFR is known to enhance tumor angiogenesis by increasing the expression of VEGF and bFGF [55]. These findings strongly support the reliability of the VR score in assessing vascularization in high-grade gliomas, particularly GBM, and in assisting clinicians with preliminary molecular profiling of gliomas, especially when integrated molecular detection technology is unavailable.
Our study is not without limitations. First, the results are based on a retrospective investigation of cohorts from multiple platforms. Consequently, further prospective studies and multicenter clinical trials are required to verify the gene signatures and nomograms. Second, the lack of glioma cohorts treated with antiangiogenic therapy combined with ICIs therapy precludes verification of the association between VR score and immunotherapeutic responsiveness, which warrants further research. Third, further in vitro and in vivo studies remain essential to comprehensively understand the molecular pathways through which CAVS regulates angiogenesis, immune cell recruitment, and tumor progression in gliomas. Investigating the interactions between glioma cells, endothelial cells, and immune cells within the TME will provide critical insights into the role of CAVS in tumor vascularization and immune modulation. Additionally, exploring the therapeutic potential of targeting CAVS, particularly in overcoming resistance to antiangiogenic therapies and immune checkpoint inhibitors, could offer promising avenues for glioma treatment.
Author Contributions
Yu-Hang Zhao: data curation; formal analysis; investigation; visualization; writing – original draft; writing – review and editing. Yu-Xiang Cai: formal analysis; investigation; validation. Zhi-Yong Pan, Feng Tang, Chao Ma: investigation; methodology. Ze-Fen Wang, Gang Li: investigation; validation. Hang Chang, Su-Fang Tian: conceptualization; supervision; writing – original draft; writing – review and editing. Zhi-Qiang Li: funding acquisition; methodology; supervision; writing – review and editing.
Acknowledgments
We thank all members of the laboratory for their valuable discussions and comments.
Ethics Statement
Approval of the research protocol by an Institutional Review Board: The study was approved by the Clinical Research Ethics Committee of the Zhongnan Hospital of Wuhan University (Ethical Lot Number: 2019048), and adhered to the principles outlined in the Declaration of Helsinki.
Consent
The authors have nothing to report.
Conflicts of Interest
The authors declare no conflicts of interest.
Open Research
Data Availability Statement
Data supporting the findings of this study can be obtained from the corresponding author upon reasonable request.


