Exploring the tumor microenvironment of colorectal cancer patients post renal transplantation by single-cell analysis
Abstract
Patients with colorectal cancer (CRC) following renal transplantation require long-term immunosuppressants to prevent graft rejection. However, the impact of these immunosuppressants on the tumor immune microenvironment and the roles of immune cells within it remain poorly understood. We conducted comprehensive single-cell RNA sequencing on tumor and normal tissues from four CRC patients post renal transplantation and compared these with published data from 23 non-transplant CRC patients. We set four groups for detailed comparative analysis based on the renal transplantation status and tissue origin: non-renal transplantation normal (nRT_Normal), non-renal transplantation tumor (nRT_Tumor), renal transplantation normal (RT_Normal), renal transplantation tumor (RT_Tumor). Our analysis revealed significant tumor immune microenvironment landscape alterations in the transplantation group. CD8+effector T cells of RT_Tumor showed significantly diminished cytotoxicity and tumor neoantigen recognition (p < 0.0001), while CD4+FOXP3 regulatory T cells of RT_Tumor displayed a higher inhibitory score (p < 0.05), indicating preserved immunomodulatory potential compared with non-transplant CRC. Notably, significantly increased CTLA4 expression in T cells of RT_Tumor was found and testified (p < 0.05). Our findings provide novel mechanistic insights for understanding the immune landscape in renal transplant recipients with CRC and pave the way for potential immunotherapeutic strategies that may improve survival and quality of life for this patient population.
Abbreviations
-
- CNI
-
- calcineurin inhibitor
-
- CRC
-
- colorectal cancer
-
- CTLA-4
-
- cytotoxic T-lymphocyte antigen 4
-
- ESRD
-
- end-stage renal disease
-
- GEO
-
- gene expression omnibus
-
- GSEA
-
- gene set enrichment analysis
-
- HE
-
- hematoxylin–eosin
-
- ICB
-
- Immune Checkpoint Blockade
-
- ICI
-
- immune checkpoint inhibitor
-
- IEL
-
- intraepithelial lymphocyte
-
- IFNγ
-
- interferon-gamma
-
- IHC
-
- immunohistochemistry
-
- IL-2
-
- interleukin-2
-
- MAIT
-
- mucosal-associated invariant T
-
- mIF
-
- multiplex immunofluorescence
-
- mIHC
-
- multiplex immunohistochemistry
-
- MM
-
- mycophenolate mofetil
-
- NFAT
-
- nuclear factor of activated T cells
-
- nRT_Normal
-
- non-renal transplantation normal
-
- nRT_Tumor
-
- non-renal transplantation tumor
-
- PBS
-
- phosphate-buffered saline
-
- PCA
-
- principal component analysis
-
- PD-1
-
- programmed cell death-1
-
- RT_Normal
-
- renal transplantation normal
-
- RT_Tumor
-
- renal transplantation tumor
-
- scRNA-seq
-
- single-cell RNA sequencing
-
- SOTR
-
- solid-organ transplant recipient
-
- TCR
-
- T cell receptor
-
- TIL
-
- tumor-infiltrating lymphocyte
-
- TME
-
- tumor microenvironment
-
- UMI
-
- unique molecular identifier
1 INTRODUCTION
Renal transplantation stands as a beacon of hope for individuals with end-stage renal disease (ESRD), offering substantial improvements in expectancy and quality of life compared with dialysis.1, 2 However, the persistent allograft antigen stimulus and the use of immunosuppressants to prevent allograft rejection creates a unique and complex immune environment,3 which contributes to higher rates of infection and cancer, the main causes of morbidity and mortality, in these patients compared with the general population.4 Immunosuppressants, such as calcineurin inhibitors (CNIs) and mycophenolate mofetil (MM), are commonly used in patients after transplantation and mainly affect the proliferation and activation of T and B lymphocytes.5 CNIs prevent the dephosphorylation required for the nuclear translocation of the transcription factor nuclear factor of activated T cells (NFAT).6, 7 Inhibition of NFAT nuclear translocation in T cells leads to reduced transcription of its target genes, including interleukin-2 (IL-2) and interferon-gamma (IFNγ), thus inhibiting the immune response.8
Colorectal cancer (CRC) has been reported to have a higher incidence in renal transplant recipients,9-11 suggesting a different and complex immune microenvironment compared with non-transplant CRC, which may affect the function and interaction of immune cells. The interaction between immunosuppressive drugs used in renal transplantation and immune checkpoint inhibitors (ICIs) for cancer creates a challenging dynamic within the tumor microenvironment after transplantation.12 Using ICIs in renal transplant patients significantly increases the risk of allograft rejection, requiring careful monitoring. Therefore, it is crucial to understand the unique functional status of lymphocytes in CRC patients after renal transplantation, as well as the interactions between different immune cells.
Single-cell RNA sequencing (scRNA-seq) has rapidly advanced to become a cornerstone in the exploration of global mRNA expression at the individual cell level,13 providing a high-resolution view of cellular diversity and function. This granular insight is critical for understanding the nuanced interplay of cancer cells with their microenvironment, offering potential pathways for targeted therapies and personalized medicine.14 In this study, we applied single-cell sequencing techniques to analyze CRC tissue samples from four patients who had undergone renal transplantation and merged the data of non-transplant CRC patients from a public dataset. By examining the cellular composition, transcriptional profiles, and immune landscape at the single-cell level, we investigated the molecular and immunological features associated with CRC post renal transplantation.
2 MATERIALS AND METHODS
2.1 Human tissue sample collection
This study included four patients diagnosed with CRC after renal transplantation who underwent surgery without previous treatment at Kyushu University Hospital (Fukuoka, Japan). Patient metadata are listed in Table S1. After resection, fresh surgical tissue specimens of tumor lesions and normal colon tissues (>5 cm from the edge of the tumor) were collected and immediately transferred for scRNA-seq. Single-cell preparation is described in Data S1.
2.2 Single-cell RNA sequencing and analysis
Data of 23 non-transplant Korean patients with CRC (nRT) from the Samsung Medical Center15 using 10X genomics sequencing was downloaded from gene expression omnibus (GEO) database (GSE132465). Based on renal transplantation status and tissue origin, patients were divided into four groups for detailed comparative analysis: non-renal transplantation normal group (nRT_Normal), non-renal transplantation tumor group (nRT_Tumor), renal transplantation normal group (RT_Normal), and renal transplantation tumor group (RT_Tumor). Data analysis was conducted using computational resources provided by the General Projects category of the Research Institute for Information Technology at Kyushu University. To evaluate the transcriptional dynamics in cell type subtypes, we defined several gene sets and evaluated the expression levels of the gene sets (Table S11). The detailed procedures are provided in Data S1.
2.3 Immunohistochemistry (IHC), multiple IHC (mIHC), and patient cohort
Paraffin-embedded tissues were collected for IHC and mIHC analysis from nine CRC patients who had undergone renal transplantation and 51 CRC patients who had not. All patients were clinically diagnosed with CRC and underwent surgery at Kyushu University Hospital between August 2008 and October 2023. Detailed procedures are provided in Data S1, with antibodies listed in Table S12.
2.4 Statistical analysis
Statistical analysis in scRNA-seq was performed using the “stat_compare_means” function to compare two groups by the Wilcoxon rank-sum test. Other statistical analyses were performed using GraphPad Prism (GraphPad Software v7.00) or IBM SPSS Statistics (SPSS, Inc. v25.0.0). For the comparison of two groups, the Mann–Whitney U-test was performed. All statistical tests were two sided, and p < 0.05 was considered statistically significant.
3 RESULTS
3.1 Single-cell expression atlas of renal transplantation CRC and non-transplant CRC
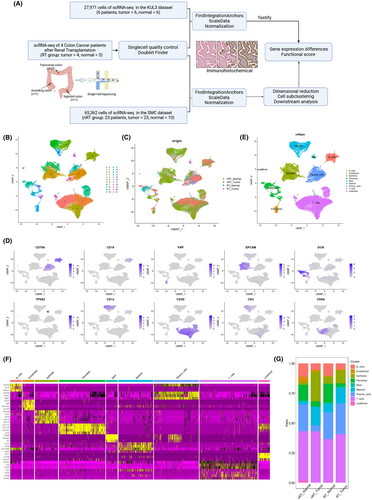
To elucidate the cellular landscape and gene signatures, we performed single-cell sequencing on CRC and normal colon tissues from four patients who underwent renal transplantation (RT) and 23 non-transplant (nRT) patients with CRC15 (Figure 1A). The clinical metadata are detailed in Table S1. We performed quality control using the following criteria: cells with >1000 UMI (Unique Molecular Identifiers) counts; >300 genes and <5000 genes; and <10% of mitochondrial gene expression in UMI counts. We then integrated the data using the method of FindIntegrationAnchors16 and further eliminated batch effect by the Harmony17 method (Figure S1, Data S1). We then performed dimensional reduction and clustering, including principal component analysis (PCA), on a total of 87,116 high-quality cells from 40 samples, as illustrated in Figures 1B,C and S2A. These clusters were annotated as nine broad cell types using canonical marker genes (Figure 1D–E and Tables S2 and S3): T cells (CD3D, CD3E, and KLRB1; 35,884 cells, 41.2%), myeloid cells (CD14 and CD68; 9886 cells, 11.3%), B cells (CD79A and CD19; 6018 cells, 6.9%), plasma cells (JCHAIN, MZB1, and IGHA1; 13,550 cells, 15.6%), epithelium (KRT8 and EPCAM; 12,826 cells, 14.7%), fibroblasts (DCN and COL1A1; 6307 cells, 7.2%), mast cells (TPSB1 and TPSAB1; 691 cells, 0.8%), endothelium (VWF; 1648 cells, 1.9%), and undefined (306 cells, 0.4%). Predominant marker genes characterizing each cell type are shown in Figure 1F. The proportions of each cell type across different groups and individual samples are visually represented in Figures 1G and S2B.
3.2 Histochemical analysis of the immune landscape alterations
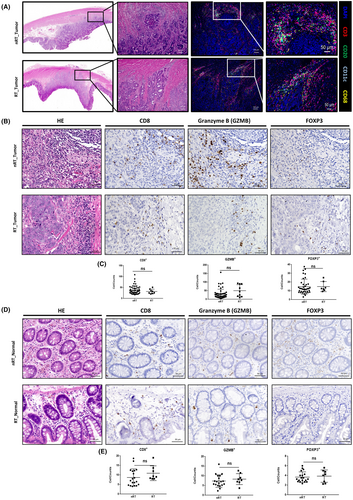
Hematoxylin–eosin (HE) staining and multiplex immunofluorescence (mIF) were used to visualize tumor-infiltrating immune cells within the samples (Figure 2A and S2C). We also compared the distribution of some characteristic tumor-infiltrating lymphocytes (TILs) and epithelial tissue-resident lymphocytes by immunohistology of colon cancer tissues (Figure 2B,D). No significant differences were observed between the transplantation group and the non-transplantation group in terms of TILs and epithelial tissue-resident lymphocytes (Figure 2C,E).
3.3 CD8+T cell clustering and transcriptomic alterations
From the T cell cluster (shown in Figure 1E), we extracted CD8A+ or CD8B+ cells as CD8+ T cells and obtained 10,067 cells. Upon reclustering CD8+ T cells from colon tissues, six distinct clusters were identified: CD8+GZMH, CD8+IL7R, CD8+CD160, CD8+CD69, CD8+GZMB, and CD8+CCL4 (Figures 3A and S3A). The distribution of these cells across different groups and individual sources is shown in Figures 3B and S3B. The marker genes and signature genes for each CD8+ T cell subcluster are displayed in Figure 3C,D. The CD8+GZMH cluster specifically expressed marker genes including the GZMK, GZMB, and PRF1 genes (Figure 3D and Table S4); this cluster was thought to be cytotoxic CD8+ T cells. Enrichment analysis of marker genes of CD8+GZMH confirmed the phenomenon called “cell killing” (Figure S3C). The CD8+GZMB cluster, prevalent in tumor lesions of both groups and expressing proliferation-, cytotoxic-, and exhaustion-related genes, was considered to be associated with these functions. The CD8+CD160 and CD8+CD69 subclusters, which express memory T cell marker genes, could resemble intraepithelial lymphocytes (IELs) or mucosal-associated invariant T (MAIT) cells. There were no obvious differences in the proportions of cell types between the nRT_Tumor and RT_Tumor groups (Figure 3E).
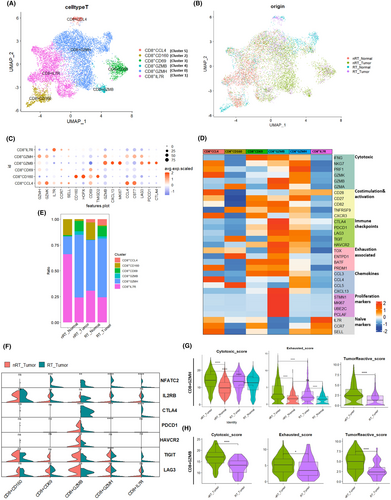
Cytotoxic CD8+T cells are the most important effector of both tumor and allograft rejection activities18, 19 and show upregulated expression of multiple immune checkpoint molecules, which is also the reason for their sensitivity to immunotherapy.20 We next analyzed the differences of cytotoxic-, exhaustion-, proliferation-, and CNI-associated genes in CD8+ T cell clusters (Figure 3F). NFATC2 was upregulated (p < 0.05) in the transplantation group across several CD8+ T cell subclusters, suggesting a potential negative feedback mechanism related to CNI use. CTLA4 was significantly overexpressed in the CD8+GZMB subcluster of the transplantation tumor lesion (p < 0.0001, Figures 3F and S3D), highlighting its role in regulating cell function. To explore the antitumor functions of cytotoxic CD8+ T cells, we focused on the functional score differences of the CD8+GZMH and CD8+GZMB subclusters. Comparing with the nRT_Tumor group, the RT_Tumor group showed significantly decreased cytotoxic,19 exhausted,21 and tumor-reactive signature scores22, 23 (p < 0.0001, Figure 3G,H), indicating a potential impact of immunosuppression on TIL functionality against tumor cells.
3.4 CD4+ T cell clustering and transcriptomic alterations
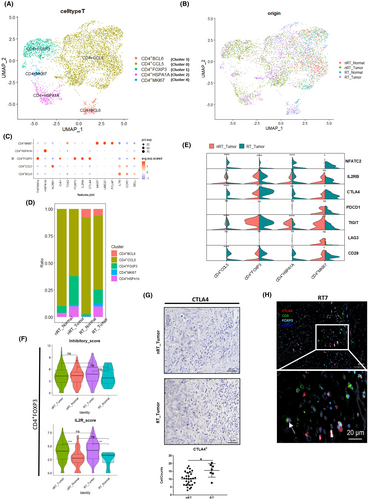
The CD4+ cells were extracted from the T cell cluster and reclustered into five subclusters (Figures 4A,B and S4A,B). We show the marker genes in Figure 4C and Table S5; CD4+FOXP3 expressed the Treg signature genes FOXP3, CTLA4, and IL2RA. CD4+MKI67 carried a proliferative signature, including MKI67, TOP2A, and UBE2C. As shown in Figure S4C, the gene set enrichment analysis (GSEA) of marker genes for each cell subtype further validated the functional roles of the identified genes by contrasting them with other subtypes. The CD4+BCL6, CD4+CCL5, and CD4+HSPA1A subclusters exhibited signatures associated with T helper (Th) cells, T follicular helper (Tfh) cells, and naïve T cells, respectively. The cell frequency representation bar plot is shown in Figure 4D. In the comparison violin plot of costimulation-associated genes (Figure 4E), similar to CD8+ T cells, CD4+ T cells exhibited a higher expression of CTLA4 in the RT_Tumor group (p < 0.05). To determine whether this difference was also present in normal tissues and to minimize potential bias from individual variation, we constructed a heatmap representing CTLA4 expression across different sample origins (Figure S5A). This analysis further confirmed that the observed elevation in CTLA4 was consistent across multiple patients, rather than being disproportionately high in a single individual. The functional signature score analysis of CD4+FOXP3 cells in RT_Tumor showed that the inhibitory score is higher compared with the nRT_Tumor group (p < 0.05, Figure 4F), demonstrating a higher suppressive potential. However, the IL2R score24 (Figure 4F) showed no significant difference between nRT_Tumor and RT_Tumor, suggesting similar activated potential, despite the effects of immunosuppressive agents. This suggested that inhibitory molecules expressed on CD4+FOXP3 cells, such as CTLA4, may play a more important role in sustaining their immune suppression. IHC analysis indicated a significantly higher count of CTLA4+ cells within the tumor lesions of the transplantation group (p < 0.05, Figure 4G), suggesting more CTLA4 is available to maintain this immunosuppressive environment in these patients compared with those without transplantation history. Multi-IHC analysis revealed that CTLA4 expression was predominantly found on FOXP3+ cells, with occasional expression on CD8+ cells in the RT_Tumor group (Figure 4H, Figure S5B). In contrast, the tumor tissue from CRC patients showed a marked scarcity of CD8+CTLA4+ cells, indicating a clear difference in the immune regulatory environment between the transplantation and non-transplant groups (Figure S5C). The IHC analysis of PD1 revealed no significant differences between groups (Figure S5D). We thus directed our attention away from a broad spectrum of regulatory molecules toward a more focused examination of CTLA4 and its specific pathway.
3.5 Pseudotime trajectory analysis and GSEA of T cells
We next performed pseudotime trajectory analysis and observed the potential connections among the CD8 and CD4 T cell subsets (Figure S6A–D). The CD4-MKI67 cluster and a portion of the CD8-IL7R cluster were excluded from trajectory analysis due to the influence of cell cycle-related genes. We also compared changes in immune checkpoint genes (Figure S6E–H) and observed that CTLA4 exhibited differences between the two groups.
Gene set enrichment analysis of CD8+GZMH cells revealed an upregulation of viral infection pathways in the transplant group compared with the non-transplant group (p < 0.0001), as shown in Figure S6I,J and Tables S6 and S7. Combined with earlier observations of a lower tumor reactive score (Figure 3G), these findings suggest that in renal transplant recipients with CRC, T cells might be confronted with multiple antigens, such as tumors, allografts, and viruses. In CD4+FOXP3 cells, GSEA comparing the transplantation group with the non-transplantation group revealed an upregulation of pathways related to viral infection, as well as genes associated with alpha-beta T cell activation in the transplantation group (p < 0.0001, Figure S6K,L, Tables S8 and S9). This is consistent with the trend observed in CD8+ T cells, further suggesting differences in the TCR pathway between nRT_Tumor and RT_Tumor.
3.6 B cell and plasma cell clustering and transcriptomic alterations
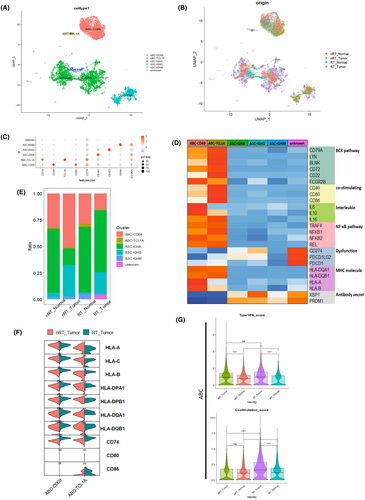
To investigate the variations of the subtypes and functions in the B cell line between the transplantation group and non-transplant group, we extracted B cell and plasma cell clusters and reclustered them. In the dataset, new B cell subclusters were identified, including two activated B cell subtypes, ABC-CD69 and ABC-TCL1A,25 and three antigen-secreting cell types, ASC-IGHA, ASC-IGHG, and ASC-IGHM, along with an unknown category (Figure 5A,B). Their marker genes are detailed in Figure 5C and Table S10. The signature gene heatmap, shown in Figure 5D, confirmed the classification and functionality of these cells. Figure 5D shows that the BCR-, MHC-, co-stimulating-, and NF-κB-associated genes26-28 were observed to be more prominent in activated B cell subtypes, particularly in the ABC-TCL1A subtype, despite its lower proportion (Figure 5E). This demonstrated the potential of activated B cells to regulate the immune microenvironment through interactions with other cells, influencing the overall immunosuppressive state. We next compared the expression of genes related to MHC and costimulatory molecules that interact with T cells (Figure 5F). The violin plot 5F showed that MHC class II molecule-related genes were found to be significantly elevated in the RT_Tumor (p < 0.05). This suggested an enhanced potential for the interaction between B cells and T cells in CRC after renal transplantation, possibly influencing the immune landscape within tumor microenvironments. A previous study of B cells from mice showed that type I IFNs prompt the expression of co-stimulation molecules like CD86 and promote antigen presentation to T cells.29 The functional score analysis of activated B cells (ABC-CD69 and ABC-TCL1A) indicated that the RT_Tumor group exhibited a significantly higher costimulation score (p < 0.0001, Figure 5G), even though the type 1 IFN score has not changed significantly. This suggests the potential role of activated B cells, which may have a relatively tight connection to effector and regulatory T cells, in CRC after renal transplantation.
3.7 Cell communication analysis
We first performed a comparison of cell–cell interactions of all cell types between the nRT_Tumor and the nRT_Tumor. The B cell–T cell, plasma cell–T cell, myeloid cell–T cell, and T cell–T cell interaction weights were dominant in the transplantation group (Figure S7A). In order to be specific, we then focused on the interaction of B cell–T cell subtypes (Figure S7B). We observed that the interaction between ABC-CD69 and CD4+ CCL5 exhibited prominent signaling in the transplantation group. Additionally, the ABC-CD69 to CD4+ T cell HLA-CD4 pathway, which played a more prominent role in the RT group (Figure S7C), suggests that B cells differentially modulate T cell subsets in CRC patients following renal transplantation. The CD86–CTLA4 pathway between activated B cells and T cells particularly existed in the RT_Tumor (Figure S7D). To further clarify the changes in ligands associated with increased CTLA4 levels in T cells of RT_Tumor, a heatmap illustrates alterations in the expression levels of the costimulatory pairs CD80/86 and CD28/CTLA4 in key cell types following renal transplantation (Figure S7E,F).
To minimize potential batch effects and ensure the robustness and reproducibility of our findings, we replicated our analysis using CRC single-cell data from the KUL3 (GSE144735) dataset.15 The heatmap and gene signature score comparison (Figure S8) confirmed the consistency of the trends observed in our initial results, showing diminished cytotoxicity in CD8+ T cells (p < 0.0001) and enhanced immunosuppressive potential in CD4+FOXP3 regulatory T cells (p < 0.05) within the transplantation group. Furthermore, to increase the reliability of the present results, we performed the same analyses using other original scRNAseq data which were derived from familial adenomatous polyposis (FAP) colon cancer30 (Figure S9). When compared with post-transplant CRC, the results show that CD4+ Treg immune suppression is higher in the post-transplant tumor group than in the FAP tumor group (p < 0.0001). Also, the CTLA4 expression is still the highest in the post-transplant tumor group (p < 0.0001). The integration was further conducted using “Harmony17” to accurately remove batch effects. We have supplemented the results with a comparison of the data before and after applying Harmony, as shown in Figure S10, demonstrating consistent outcomes. This ensures the robustness of the integration process while minimizing potential batch effects.
4 DISCUSSION
This study provides novel insights into the complex interplay between immune responses and tumor microenvironments in the context of renal transplantation. By performing extensive single-cell analysis, we identified cell subtypes, transcriptional programs, and signaling pathways in four CRC patients after renal transplantation in comparison with non-transplant CRC patients. This research represents the first exploration into the single-cell transcriptomic diversity of immune cells in CRC patients following renal transplantation. Our findings revealed that cytotoxic T cells exhibited significantly weakened tumor-killing capabilities, while Tregs immunosuppressive potential was enhanced, with elevated CTLA4 expression contributing to the maintenance of this suppressive state. The pivotal role of CTLA4 signaling, along with its interactions with T cells, B cells, and other immune cells, lies in its ability to shape the tumor immune microenvironment, influencing immune responses and tumor progression.
Before analysis, we compared several populations of TILs and epithelial resident lymphocytes in CRC patients and those who had undergone renal transplantation. Notably, the preliminary comparison revealed no significant differences between these two groups in terms of the presence and distribution of these immune cell types. This observation suggests that the fundamental immune landscapes, at least in terms of these cell populations, remain relatively unchanged by transplantation and the associated treatments. Rabi's group also performed IHC and digital pathology and found no significant difference in T cell abundance (CD3 and CD8) in central tumor regions and the invasive margins between CRC patients who are solid-organ transplant recipients (SOTRs) and non-immunosuppressed controls.31 Immunosuppressive drugs like CNIs can prevent immune cells such as T cells from becoming fully activated, reducing their ability to mount an effective immune response even if they are present in normal numbers.3 These current findings may indicate that the consensus molecular subtype classification of colon cancer32 and individual variation could influence the analysis of lymphocyte infiltration within tumor environments.
Our single-cell data give some novel clues for functional gene alteration in T and B cells. In CD8+GZMH, the CD8+ cytotoxic T-like cells, the decrease in cytotoxic score and tumor-reactive score is significant of RT_Tumor. This suggested that in the complex tumor microenvironment of SOTRs, with the interference of immunosuppressants, allograft antigens and opportunistic pathogen antigens, the efficiency in recognizing tumor neoantigens via TCR is diminished. Some TCR-seq studies detected alloreactivity through the identification of host-vs-graft and graft-vs-host clones, particularly in patients experiencing rejection.33-35 Research has shown that T cell accumulation occurs not only in grafts of patients undergoing rejection but also in the peripheral blood,33 indicating the presence of alloreactive T cells beyond local grafts. This may explain, to a certain extent, the special suppressive tumor microenvironment in transplant patients. To better understand changes of tumor reactivity and TCR clones during T cell maturation in the TME of SOTRs, future research should include tracking antigen-specific T cell clones via TCR sequencing; these findings may offer deeper insights into the adaptive immune response within this specialized context.
CD4+FOXP3 cells, the Treg-like T cells, displayed a higher inhibitory score alongside a non-changed IL2R score in RT_Tumor. This pattern suggests that even with the inhibiting immunosuppressants, these cells continued to exert their immunomodulatory functions and activation status within the tumor microenvironment. Currently, there is no direct evidence suggesting that immunosuppressive drugs, such as CNIs, directly increase CTLA4 expression in T cells. However, CNIs affect NFAT dephosphorylation but do not directly impact transcription.6 Therefore, the increase in NFATC2 expression does not directly equal the increase in functional NFAT in cells. In vivo studies have revealed that NFAT directly influences CD8+ T cell exhaustion by binding to regulatory regions of genes associated with exhaustion.36 CNIs inhibit NFAT that restrain T-cell exhaustion in chronic viral infection and tumor models.37 The increase in CTLA4 expression in the transplantation group provides insight into the mechanisms underlying this immunosuppressive state. For SOTRs, Tregs have always been central to minimize rejection and prevent the negative outcomes.38 CTLA4 inhibits T cell activation and function39; thus, the elevated levels of CTLA4 in Treg cells may contribute to the enhanced regulatory environment observed in transplant recipients.
Through pseudotime analysis, we observed that the behaviors of both CD8+ and CD4+ T cells are influenced by multiple factors during their infiltration and differentiation within the tumor microenvironment. Furthermore, costimulating score analysis and CellChat analysis revealed that the interaction between activated B cells and T cells via MHC-II and costimulatory molecules was more pronounced. B cells have antigen-presenting potential, thereby influencing antigen-specific immune responses within the tumor microenvironment.40 CTLA4 has a significantly higher affinity for both CD80 and CD86 compared with CD28, which allows it to outcompete CD28 for binding.39 This high-affinity interaction between CTLA4 and its ligands delivers a potent inhibitory signal to T cells, resulting in reduced activation and proliferation. This interaction between CD86 on B cells and CTLA4 on T cells, especially Tregs, indicates that the crosstalk via the CTLA4 pathway between T cells and B cells warrants further investigation, as it may influence the balance between immunity and tolerance in the context of organ transplantation and cancer.
Data on the feasibility of using ICB (Immune Checkpoint Blockade) therapies in patients with specific clinical situations, such as immunosuppression of organ transplantation and HIV infection, are scarce.41 Studies in SOTRs with different cancers showed that although the tumors reacted to immunotherapy, the risk of allograft rejection also increased.42-44 The successful application of belatacept (CTLA-4-Ig) in renal transplantation underscores the critical role of CTLA4 in the post-transplantation setting.45 A recent study showed that the addition of anti-CTLA4 to anti-PD-L1 therapy promotes CD4+ T cell expansion and antitumor potential.46 This therapeutic strategy highlights CTLA4's significance in modulating immune responses, further supporting its importance in renal transplantation. Therapeutic approaches targeting the CD86–CTLA4 pathway could offer new avenues for modulating immune responses in transplant patients with cancer, potentially improving outcomes by fine-tuning the balance between suppressing graft rejection and enhancing tumor immunity.
Our study, while providing valuable insights into the immune landscape of CRC patients post renal transplantation, has several limitations. The comparative analysis involved data from our center and published data from another institution for the non-transplant group. While we used the SCTransform and FindIntegrationAnchors methods to mitigate batch effects, inherent biases in cell subset identification and gene expression profiling could still influence our findings. We thus added another database to confirm the same trend. The sample size for post-transplant CRC patients was also a limitation and restricts the depth of histological confirmation of our observations, potentially affecting the generalizability of our findings. Finally, the absence of mature in vivo models of organ-transplanted tumors limits our ability to dissect the underlying molecular mechanisms and directly observe immune–tumor dynamics in a controlled setting.
In conclusion, our findings illuminate the complex interplay between immunosuppression, immune cell function, and the tumor microenvironment in CRC post renal transplantation. While it is difficult to establish an in vivo CRC model after renal transplantation, further research is needed to dissect the multifaceted roles of CTLA4 in transplantation recipients with tumors, particularly focusing on its interaction with other immune modulatory pathways. Understanding these dynamics could pave the way for tailored therapeutic strategies that delicately balance transplant tolerance with effective cancer immunosurveillance.
AUTHOR CONTRIBUTIONS
Jinghui Zhang: Conceptualization; data curation; formal analysis; investigation; methodology; software; validation; visualization; writing – original draft; writing – review and editing. Yusuke Mizuuchi: Conceptualization; funding acquisition; project administration; writing – review and editing. Kenoki Ohuchida: Conceptualization; funding acquisition; project administration; writing – review and editing. Kyoko Hisano: Data curation; methodology. Yuki Shimada: Data curation; methodology. Chikanori Tsutsumi: Formal analysis; methodology. Naoki Katayama: Formal analysis; methodology. Bryan C. Tan: Formal analysis; methodology. Kinuko Nagayoshi: Formal analysis; investigation; methodology. Koji Tamura: Formal analysis; investigation; methodology. Takaaki Fujimoto: Formal analysis; investigation; methodology. Naoki Ikenaga: Conceptualization; formal analysis; methodology. Kohei Nakata: Conceptualization; formal analysis; methodology. Yoshinao Oda: Resources; writing – review and editing. Masafumi Nakamura: Project administration; supervision; writing – review and editing.
ACKNOWLEDGMENTS
We are grateful to E. Manabe and S. Sadatomi (Kyushu University) for their expert technical assistance. We also thank Gabrielle White Wolf, PhD, from Edanz (https://jp.edanz.com/ac) for editing a draft of this manuscript.
FUNDING INFORMATION
This study was supported by JSPS KAKENHI (JP22K07283, JP23K08093, JP23K27461, JP22H00480, and JP24K11849) and The Shinnihon Foundation of Advanced Medical Treatment Research (2022).
CONFLICT OF INTEREST STATEMENT
The authors declare no conflict of interest. Dr. Yoshinao Oda, the coauthor for this study, is the associate editor of Cancer Science.
ETHICS STATEMENT
Approval of the research protocol by an Institutional Reviewer Board: This study was approved by the Ethics Committee of Kyushu University (approval number: 2023--79 and 22002--00).
Informed Consent: N/A.
Registry and the Registration No. of the study/trial: N/A.
Animal Studies: N/A.
Open Research
DATA AVAILABILITY STATEMENT
The raw and processed scRNA-seq data for this study cohort are available in the NCBI GEO database under the accession code GSE277905. The datasets (GSE132465/GSE144735)15 for this study can be found in the GEO database (https://www.ncbi.nlm.nih.gov/geo/query/acc.cgi?acc=GSE132465/GSE144735).


