TIMP1 promotes cell proliferation and invasion capability of right-sided colon cancers via the FAK/Akt signaling pathway
Abstract
Although right-sided colorectal cancer (CRC) shows a worse prognosis than left-sided CRC, the underlying mechanism remains unclear. We established patient-derived organoids (PDOs) from left- and right-sided CRCs and directly compared cell proliferation and invasion capability between them. We then analyzed the expression of numerous genes in signal transduction pathways to clarify the mechanism of the differential prognosis. Cell proliferation activity and invasion capability in right-sided cancer PDOs were significantly higher than in left-sided cancer PDOs and normal PDOs, as revealed by Cell Titer Glo and transwell assays, respectively. We then used quantitative RT-PCR to compare 184 genes in 30 pathways among right-sided and left-sided cancer and normal PDOs and found that the TIMP1 mRNA level was highest in right-sided PDOs. TIMP1 protein levels were upregulated in right-sided PDOs compared with normal PDOs but was downregulated in left-sided PDOs. TIMP1 knockdown with shRNA significantly decreased cell proliferation activity and invasion capability in right-sided PDOs but not in left-sided PDOs. Moreover, TIMP1 knockdown significantly decreased pFAK and pAkt expression levels in right-sided PDOs but not in left-sided PDOs. A database analysis of The Cancer Genome Atlas revealed that TIMP1 expression in right-sided CRCs was significantly higher than in left-sided CRCs. Kaplan–Meier survival analysis showed significantly shorter overall survival in high-TIMP1 patients versus low-TIMP1 patients with right-sided CRCs but not left-sided CRCs. Our data suggest that TIMP1 is overexpressed in right-sided CRCs and promotes cell proliferation and invasion capability through the TIMP1/FAK/Akt pathway, leading to a poor prognosis. The TIMP1/FAK/Akt pathway can be a target for therapeutic agents in right-sided CRCs.
1 INTRODUCTION
Colorectal cancer (CRC) is one of the leading causes of cancer-related death worldwide.1 Although most early-stage CRCs can be cured by endoscopic or surgical resection, metastatic CRC is mostly incurable, leading to a poor prognosis. Despite recent advances in molecular-targeted therapy, the overall survival (OS) for metastatic CRCs ranges from 25.0 to 33.1 months. It is also noteworthy that OS for right-sided CRCs is shorter than that of left-sided CRCs; that is, 18.3–23.0 vs 28.0–38.3 months, respectively.2 However, the exact reason why OS for right-sided CRCs is so short remains unclarified.
Recently, much attention has been paid to the differences between right-sided and left-sided CRCs, not only in terms of OS but also the response to molecular-targeted agents, which has been reported to differ substantially between right-sided and left-sided CRCs. Left-sided CRCs (RAS wild-type [WT]) are very sensitive to anti-epidermal growth factor receptor (EGFR) therapy. while right-sided CRCs (RAS WT) are insensitive.3-5 In contrast, right-sided CRCs are more sensitive to anti-vascular endothelial growth factor (VEGF) antibody regimens than left-sided CRC.3 Therefore, the European Society for Medical Oncology (ESMO) guidelines on metastatic CRCs recommend anti-EGFR antibody therapy for left-sided CRC. whereas anti-VEGF antibody therapy is recommended for right-sided CRC as first-line therapy, although the precise mechanism underlying the difference in efficacy is unclear.6 Moreover, BRAF mutation,7 microsatellite instability (MSI)8, 9 and CIMP positivity10 occur frequently in right-sided CRCs but not in left-sided CRCs. Such differences in gene alterations may partially explain the short OS of right-sided CRCs. However, in an analysis of CRCs limited to only RAS/BRAF WT, the OS of right-sided CRC was short.11 Therefore, it is necessary to clarify the underlying mechanism of the short OS in right-sided CRCs to improve its poor prognosis.
There are also physiological differences in cell function, metabolism, microbiota, and gene expression, as well as embryology, between the right-sided and left-sided colorectum.12-14 These differences in origin cells for carcinogenesis may affect the malignant potential of right-sided and left-sided CRCs.
The poor prognosis with short survival in patients with right-sided CRC is speculatively attributed to rapid growth, high invasion/metastasis capability, and drug resistance of cancer cells. Recent molecular analysis for these malignant features in CRCs revealed activation of signal transduction pathways, including the MAP kinase pathway,15 the IGF/IGFR pathway,16 and the EGF/EGFR pathway.17 However, the relevance of each signal transduction pathway in the differences between right- and left-sided CRCs remains unclear. Clarifying the role of each signaling pathway in right-sided versus left-sided CRCs has been difficult for the following reasons. First, it has been impossible until recently to compare malignant potential and underlying signal transduction pathways between right-sided and left-sided CRCs using live cells. In fact, no studies to date have comprehensively analyzed and compared the signal transduction pathways in right-sided versus left-sided CRCs. Second, previous studies have used cancer cell lines, the origins of which (i.e., right-sided or left-sided) are often unclear, and these cell lines have many gene mutations and methylations that make them inappropriate for gene knockdown/transfection experiments.
Sato et al.18 reported a new culture technique for patient-derived organoids (PDOs), which has enabled in vitro long-term three-dimensional culture of intestinal cells, including CRCs and normal colorectal epithelia from clinically obtained specimens. Employing this technique, we have been able to directly compare malignant potential, such as proliferation/invasion activity between right-sided and left-sided CRCs, and to perform gene transfection assays to analyze targeted gene functions.
Therefore, in this study, establishing PDOs from right-sided and left-sided CRC as well as normal epithelial cells, we first compared cell proliferation activity and invasion capability between right- and left-sided PDOs. We then investigated gene expression in numerous signal transduction pathways associated with cell proliferation and invasion capability. Because we ultimately identified tissue inhibitor matrix metalloproteinase 1 (TIMP1) as an important gene in right-sided PDOs, we clarified the role of the TIMP1 gene by performing knockdown experiments with PDOs. Finally, we confirmed our results using a public database.
2 MATERIALS AND METHODS
2.1 Patients and tissue samples
We enrolled 15 patients with seven right-sided and eight left-sided CRCs and obtained 14 paired biopsy specimens from each cancer and surrounding normal epithelia at least 5 cm away from the lesion to establish an organoid (PDO). Of these, we used only eight cancer PDOs (four right-sided and four left-sided CRCs), which carried WT KRAS, WT BRAF, mutated TP53, and microsatellite stable (MSS) and the corresponding normal epithelial PDOs to perform in vitro experiments under genetically similar conditions.
2.2 Crypt isolation and organoid culture
Crypt isolation and organoid culture were performed as we previously described.19 In brief, epithelial fragments were adequately washed with cold PBS and crypts were isolated by incubation in 0.5 mM EDTA with shaking at 4°C. Isolated crypts were incubated in digestion buffer consisting of DMEM with 2.5% FBS, collagenase type IX, and dispase type II, and epithelial cells were mechanically dissociated by pipetting. Isolated cells were embedded in Matrigel (Corning) and seeded in 48-well plates, followed by polymerization at 37°C. Subsequently, embedded crypts were cultured with the culture medium as described previously.18
2.3 Cell viability assay
Organoid cell viability was determined by Cell Titer Glo assay (Promega), as previously described.20
2.4 RNA extraction and quantitative RT-PCR
RNA extraction and quantitative RT-PCR were performed as previously described.21 The simultaneous assay of mRNA gene expression of organoids was performed in custom-designed TaqMan Array Plates (Applied Biosystems), consisting of four endogenous controls (18 s, GAPDH, HPRT, and GUSB) and 184 target genes associated with the prognosis of CRC, as previously reported.22-25 The TaqMan primer/probes used are listed in Table S2.
The detailed methods for the invasion assay, inhibitor experiments, lentiviral transduction, western blotting, The Cancer Genome Atlas data analysis and statistical analysis are described in Appendix S1.
3 RESULTS
3.1 Higher cell proliferation activity in right-sided colorectal cancer compared with left-sided colorectal cancer
To compare the malignant potential of cancer cells between right-sided and left-sided CRCs, we first established a total of eight paired cancer and normal epithelial organoids from four right-sided and four left-sided CRCs. The patient characteristics are presented in Table S1. We cultured those PDOs for 1 – 7 days and directly compared cell proliferation between them by Cell Titer Glo assay. Cell viability in right-sided cancer PDOs was significantly higher than in left-sided cancer PDOs at day 7 (8.98 ± 0.95 vs 5.18 ± 1.08; p = 0.0019; Figure 1A). Moreover, the viability of right-sided and left-sided cancer PDOs was significantly higher than in the respective corresponding normal PDOs (8.98 ± 0.95 vs 1.61 ± 0.46 and 5.18 ± 1.08 vs 1.87 ± 0.43; p < 0.0001 and p = 0.0013, respectively; Figure 1A). No significant difference was observed between right-sided and left-sided normal PDOs.
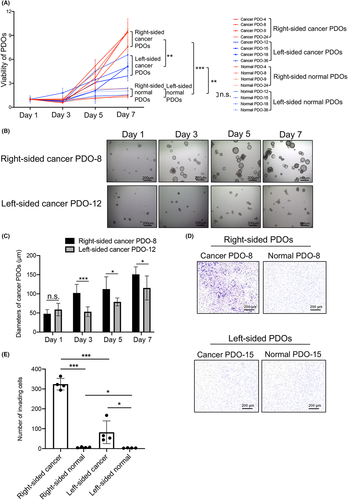
To confirm the difference in cell proliferation activity in PDOs, we measured the diameter of organoid clusters in six randomly selected areas in right-sided and left-sided cancer PDOs. Representative images are shown in Figure 1B. The diameters of most clusters of right-sided cancer PDO-8 increased rapidly from day 1 to day 7, whereas the diameters of clusters of left-sided cancer PDO-12 increased slowly over time. Quantitative analysis showed significantly higher diameters in right-sided cancer PDO-8 than in left-sided cancer PDO-12 at day 3 (p = 0.0009), day 5 (p = 0.0344), and day 7 (p = 0.0403; Figure 1C).
3.2 Higher cell invasion capability in right-sided colorectal cancer than in left-sided colorectal cancer
To further investigate the malignant potential of right- and left-sided CRCs, we performed an invasion assay using four right-sided and four left-sided paired PDOs to compare their invasion capability. Representative images of paired PDOs are shown in Figure 1D. Right-sided cancer PDO-8 exhibited many more invading cells than corresponding normal PDO-8. However, left-sided cancer PDO-15 exhibited slightly more invading cells than corresponding normal PDO-15. Similar images were obtained in other right-sided and left-sided PDOs (Figure S1). The quantitative analysis of invading cells revealed significantly more invading cells in right-sided CRC PDOs than in left-sided CRC PDOs (324.00 ± 25.34 vs 82.25 ± 49.49; p = 0.0003; Figure 1E). The number of invading cells in right-sided and left-sided cancer PDOs was significantly greater than in respective corresponding normal PDOs (p = 0.0003 and p = 0.0323, respectively; Figure 1E). Interestingly, the number of invading cells in right-sided normal PDOs was higher than in left-sided normal PDOs (p = 0.0333; Figure 1E).
3.3 Predominant activation of tissue inhibitor matrix metalloproteinase 1-related signaling pathway in right-sided colorectal cancer
To investigate the mechanism of higher cell proliferation activity and higher cell invasion capability of right-sided CRCs, we performed gene expression assays of 184 genes in 30 signal transduction pathways associated with cell proliferation and invasion capability using three paired cancer and normal PDOs. The relatively higher mRNA expression in right-sided versus left-sided CRC PDOs was ranked, and the top five genes identified by this approach were S100P, DHH, SDC2, TIMP1, and MSN (Figure 2A). We further verified the mRNA levels of these five genes using all four paired PDOs from both sides. The relative mRNA level of TIMP1 in all four right-sided cancer PDOs was higher than that of all four left-sided cancer PDOs (1.00 ± 0.23 vs 0.09 ± 0.06; p = 0.0002; Figure 2B). The mRNA levels of MSN and DHH in right-sided cancer PDOs tended to be higher compared with left-sided PDOs, although the difference was not statistically significant (p = 0.0638 and p = 0.1262; respectively; Figure 2B). Regarding S100P and SDC2, the difference in the relative mRNA levels between the four right-sided and four left-sided PDOs did not reach statistical significance.
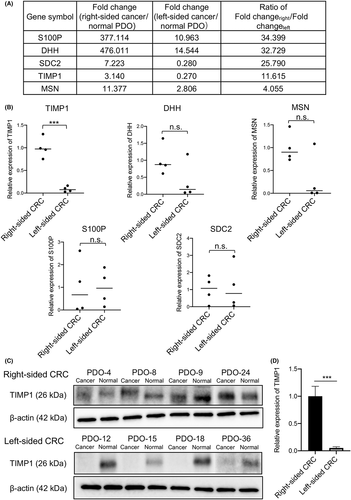
We then examined TIMP1 protein expression by western blotting in cancer and normal PDOs on both sides. The TIMP1 protein signals in all four right-sided cancer PDOs were stronger than those in the corresponding normal PDOs. In contrast, the TIMP1 protein signals in all four left-sided PDOs were much lower than in the corresponding normal PDOs (Figure 2C). Quantitative analysis of TIMP1 protein signals, normalized according to the β-actin signal and corresponding normal PDO TIMP1 signal, revealed that TIMP1 protein expression in right-sided CRCs was significantly higher than in left-sided CRCs (1.00 ± 0.18 and 0.05 ± 0.02; p < 0.0001; Figure 2D). These results suggest that the TIMP1-related signal transduction pathway is predominantly activated in right-sided CRC.
3.4 Tissue inhibitor matrix metalloproteinase 1 knockdown inhibits cell proliferation activity and invasion capability of right-sided colorectal cancer
To investigate the role of TIMP1 in right-sided CRCs, we knocked down the TIMP1 gene using two different lentiviral shRNAs (TRCN299345 and TRCN303682; hereafter defined as sh#1 and sh#2, respectively) in two right-sided and two left-sided cancer PDOs that were randomly selected. TIMP1 mRNA levels in right-sided PDO-4 transfected with TIMP1 shRNAs (PDO-4sh#1 and sh#2) were inhibited by 94.5% and 96.9%, respectively, compared with PDO-4 transfected with scramble shRNA (PDO-4NC) (Figure 3A). TIMP1 protein expression in PDO-4sh#1 and sh#2 was also markedly inhibited compared with PDO-4NC (Figure 3B). Similarly, TIMP1 mRNA levels in left-sided cancer PDO-12 transfected with shRNAs (PDO-12sh#1 and sh#2) were inhibited by 92.5% and 96.0%, respectively (Figure 3A), and no TIMP1 protein was observed in those PDOs (Figure 3B). When cell proliferation activity was examined from day 1 to day 7 by Cell Titer Glo assay, the viability of right-sided PDO-4sh#1 and sh#2 cells was significantly lower than that of PDO-4NC cells (p = 0.0001 and p < 0.0001, respectively; Figure 3C). However, the viability of left-sided PDO-12sh#1 and sh#2 cells was similar to that of PDO-12NC cells with no statistically significant difference (Figure 3C).
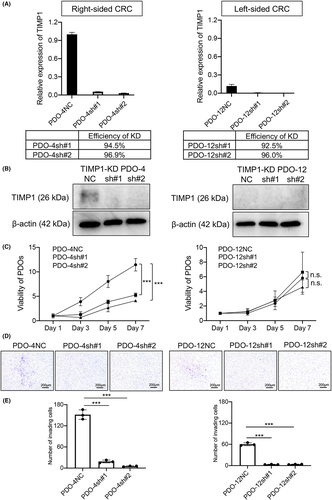
We next investigated the invasion capability of right-sided and left-sided PDO cells with TIMP1 knockdown. Representative images of invasion assays with PDO-4sh#1 and sh#2 as well as PDO-4NC cells are shown in Figure 3D. Invading cells in PDO-4sh#1 and sh#2 were noticeably fewer compared with PDO-4NC. Quantitative analysis revealed a significantly lower number of invading cells in PDO-4sh#1 and sh#2 than in PDO-4NC (p < 0.0001 for each; Figure 3E). Representative images from the invasion assay of left-sided PDO-12sh#1/#2 and PDO-12NC cells are shown in Figure 3D. There were fewer invading cells in PDO-12sh#1 and sh#2 than in PDO-12NC. Quantitative analysis revealed a significantly lower number of invading cells in PDO-12sh#1 and sh#2 than in PDO-12NC (p < 0.0001 for each; Figure 3E).
We also confirmed similar results for cell proliferation activity and invasion capability using right-sided cancer PDO-8 and left-sided cancer PDO-18 with TIMP1 knockdown (Figure S2). Thus, our results clearly indicate that TIMP1 plays an important role in cell proliferation activity and invasion capability, predominantly in right-sided CRCs.
3.5 Tissue inhibitor matrix metalloproteinase 1 activates FAK/Akt signal transduction pathway in right-sided colorectal cancer
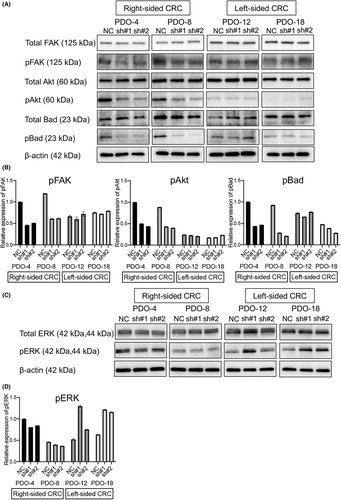
To investigate TIMP1-related signal transduction pathways involved in cell proliferation activity and invasion capability, we examined the protein expression of key molecules in the FAK/Akt and MAPK pathways downstream of TIMP1 using four right-sided and left-sided TIMP1 knockdown PDOs. The expression of phosphorylated FAK (pFAK) protein in right-sided PDO-4sh#1 and sh#2 was manifestly lower compared with PDO-4NC (Figure 4A). Similar results were obtained for right-sided PDO-8sh#1/sh#2 compared with PDO-8NC. However, pFAK protein levels in the two left-sided knockdown PDOs were similar to those in each of the PDO negative controls. Similarly, downstream pAkt and pBad protein levels were decreased in right-sided TIMP1 knockdown PODs, whereas the levels were almost unchanged in left-sided TIMP1 knockdown PODs (Figure 4A). Quantitative analysis of band signals revealed that pFAK, pAkt, and pBad protein levels were significantly decreased by TIMP1 knockdown in right-sided PDOs, whereas those in the left-sided PDOs were unchanged by TIMP1 knockdown (Figure 4B), suggesting predominant activation of the FAK/Akt/Bad signaling pathway in right-sided but not left-sided PDO. Interestingly, higher expression of pAkt was observed in three of four right-sided cancer PDOs than in any of the four left-sided cancer PDOs (Figure S3). Quantitative analysis revealed that pAkt levels in right-sided cancer PDOs were significantly higher than those in left-sided cancer PDOs (p = 0.0210, Figure S3).
We then investigated the inhibitory effects of selective FAK and Akt inhibitors on cell proliferation and invasion capability in right-sided PDOs as well as left-sided PDOs. When the four right-sided PDOs (PDO-4/8/9/24) were treated with the selective Akt inhibitor MK-2206 for 7 days according to the methods described in Appendix S1, the viability of PDOs was significantly reduced compared with respective control PDOs, which were treated with vehicle alone; the reduction was 76.3% in PDO-4, 87.0% in PDO-8, 80.0% in PDO-9, and 79.5% in PDO-24, with an overall average (±SD) of 80.7 ± 4.5%, while the average reduction in the four left-sided PDOs was 53.8% ± 13.5%, which was significantly lower than that in right-sided PDOs (p = 0.0092) (Figure S4). In the invasion assay, the number of invading cells in right-sided PDOs treated with MK-2206 was significantly reduced by 92.1% ± 4.2%, while the reduction for four left-sided PDOs was 70.7% ± 11.7%, which was significantly lower than that in right-sided PDOs (p = 0.0137) (Figure S4). These data indicate that a selective Akt inhibitor had a greater effect on the cell proliferation and invasion capability of right-sided CRC PDOs than those of left-sided CRC PDOs. Similar results were obtained in experiments using the selective FAK inhibitor GSK2256098 (Figure S5).
In addition, we examined pERK protein expression, a downstream molecule of the MAPK signaling pathway, which is the other TIMP1-related pathway, in both-sided TIMP1 knockdown PDOs. However, the pERK levels in right-sided PDO-4 and PDO-8 were unchanged by TIMP1 knockdown. In contrast, pERK levels in left-sided PDO-12 and PDO-18 were increased by TIMP1 knockdown (Figure 4C). Quantitative analysis revealed that the pERK protein level in right-sided PDO-4 and PDO-8 were unchanged by TIMP1 knockdown, but the pERK level in left-sided PDO-8 and PDO-18 were conversely increased by TIMP1 knockdown (Figure 4D).
These results suggest that TIMP1 plays a crucial role in cell proliferation and invasion capability in right-sided CRC via FAK/Akt/Bad signaling.
3.6 Tissue inhibitor matrix metalloproteinase 1 expression and survival in high- and low-tissue inhibitor matrix metalloproteinase 1 colorectal cancers
To evaluate TIMP1 expression in a large number of right- and left-sided CRCs, we analyzed the public database of TCGA-COAD and TCGA-READ, which includes mRNA gene profiling data and tumor location information from a cohort of 587 patients. The median TIMP1 expression level in 251 right-sided CRCs was significantly higher than in 366 left-sided CRCs (9.2364 vs 8.9833, p = 0.0046; Figure 5A).
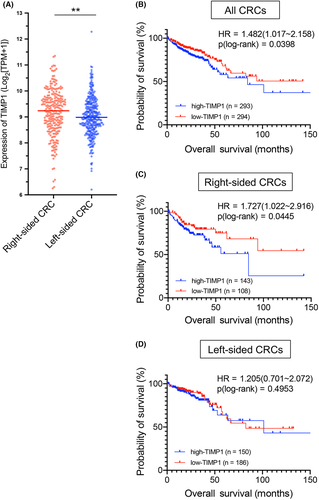
To further evaluate the association between TIMP1 expression and CRC prognosis, we compared OS between the high- and low-TIMP1 groups by Kaplan–Meier analysis. In the analysis of all patients (n = 587), OS in the high-TIMP1 group was significantly shorter than in the low-TIMP1 group (19.27 vs 21.42 months; HR = 1.482; 95% Cl, 1.017–2.158; p = 0.0398; Figure 5B). Similarly, in the analysis of right-sided CRCs (n = 251), OS in the high-TIMP1 group was significantly shorter than in the low-TIMP1 group (18.30 vs 23.52 months; HR = 1.727, 95% Cl, 1.022–2.916; p = 0.0445; Figure 5C). However, in the analysis of left-sided CRCs (n = 336), no significant difference in OS was observed between the two groups (24.27 vs 21.23 months; HR = 1.205, 95% Cl, 0.7010–2.072; p = 0.4953; Figure 5D). These results clearly indicate that TIMP1 plays an important role in determining the poor prognosis of right-sided CRC.
3.7 Activation of epidermal growth factor receptor signaling is predominant in left-sided colorectal cancer
It has been reported that left-sided CRC with RAS WT is more sensitive to anti-EGFR agents,26 and that expression of key molecules in the EGFR signaling pathway is higher in left-sided CRC tissues.27, 28 Therefore, we investigated the expression of the EGF receptor family (EGFR, ERBB2, and ERBB3) and key ligands in the EGFR signaling pathway using PDOs. EGFR mRNA levels in left-sided PDOs were significantly higher than in right-sided PDOs (1.01 ± 0.27 vs 1.94 ± 0.44; p = 0.0361; Figure 6A). Similarly, the levels of ERBB2 and ERBB3 mRNA in left-sided PDOs tended to be higher than those in right-sided PDOs, although the difference did not reach statistical significance. In the analysis of ligands, the amphiregulin (AREG) mRNA level in left-sided PDOs was significantly higher than in right-sided PDOs (0.60 ± 0.35 vs 1.49 ± 0.12; p = 0.0139; Figure 6B). However, the TGFα (TGFA) level was significantly higher in right-sided PDOs compared with left-sided PDOs (0.94 ± 0.15 vs 0.18 ± 0.04; p = 0.0009). The levels of mRNA for the other ligands, including epiregulin (EREG), neuregulin 2 (NRG2), NRG4, and EGF, did not show any significant difference between the two sides.
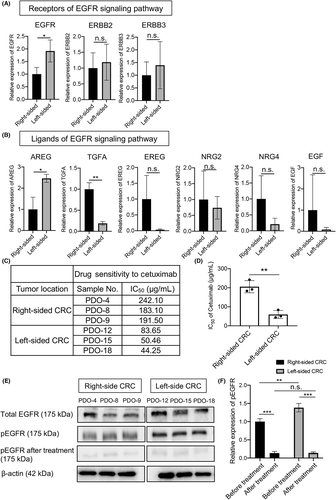
To verify the clinical benefit of anti-EGFR agents in left-sided CRCs, we examined the sensitivity of PDOs to cetuximab by Cell Titer Glo assay. The IC50 values of cetuximab against left-sided PDOs were much lower than any of the right-sided PDOs (Figure 6C). The mean IC50 value in left-sided PDOs was significantly lower than in right-sided PDOs (54.45 ± 21.18 vs 205.57 ± 31.92 μg/ml; p = 0.0027; Figure 6D), indicating significantly higher sensitivity of left-sided PDOs compared with right-sided PDOs.
We then analyzed total EGFR and phosphorylated EGFR (pEGFR) protein levels before and after treatment with cetuximab by western blotting. Before treatment, pEGFR levels in all three left-sided PDOs were obviously higher than those in any of the three right-sided PDOs, although total EGFR protein levels on both sides were similar to each other. However, after treatment with cetuximab for 72 h, only faint expression was observed in right- and left-sided PDOs (Figure 6E). Quantitative analysis revealed that the pEGFR level in left-sided PDOs was significantly higher than in right-sided PDOs before treatment, but cetuximab treatment markedly inhibited pEGFR levels to similarly very faint levels (Figure 6F). That is, the reduction of pEGFR levels following cetuximab treatment in left-sided PDOs (90.3% ± 1.1%) was significantly higher than that in right-sided PDOs (86.3% ± 1.2%; p = 0.0136). Because pEGFR levels are reportedly correlated with cell proliferation activity and/or malignant potential in CRCs,29, 30 these results suggest that the greater reduction in left-sided PDOs causes stronger tumor cell inhibition (i.e. higher susceptibility) to anti-EGFR agents. Thus, the EGFR signaling pathway is more predominantly activated in left-sided cancer PDOs.
To investigate the correlation between activation of the EGFR signaling pathway and the status of TIMP1, we then examined protein levels of pEGFR and total EGFR in TIMP1 knockdown PDOs and PDO NCs by western blotting (Figure S6). The pEGFR levels in left-sided PDO NCs (PDO-12/18 NC) were obviously higher than in right-sided PDO NCs (PDO-4/8 NC), similar to the findings for left-sided and right-sided PDOs in Figure 6E. However, the pEGFR levels in TIMP1 knockdown PDOs were similar to those of the respective PDO NCs for both left-sided PDOs (PDO-12sh#1/sh#2, PDO-18sh#1/sh#2) and right-sided PDOs (PDO-4sh#1/sh#2, PDO-8sh#1/sh#2). Although cetuximab treatment inhibited pEGFR levels to a greater degree in left-sided PDOs than in right-sided PDOs, the inhibitory effects of cetuximab on pEGFR levels in TIMP1 knockdown PDOs were similar to those of the respective PDO NCs in both left- and right-sided PDOs. These results suggest no significant direct correlation between the status of TIMP1 and activation of the EGFR signaling pathway or susceptibility to anti-EGFR agents.
4 DISCUSSION
In this study, we found that PDOs from right-sided CRCs had higher cell proliferation activity and higher invasion capability than PDOs from left-sided CRCs, which we assumed accounts for the poorer prognosis of right-sided CRCs. We also revealed that the TIMP1/FAK/Akt signal transduction pathway is predominantly activated in right-sided cancer PDOs, which was associated with their higher cell proliferation activity and invasion capability. Additionally, it was confirmed by analysis of a large sample cohort in the TCGA database that the higher expression of TIMP1 was strongly correlated with shorter OS in right-sided CRCs but not left-sided CRCs. In contrast, we identified predominant activation of the EGFR signaling pathway in left-sided PDOs. These findings strongly suggest that TIMP1 is a prognostic indicator in right-sided CRC and should be an appropriate target for cancer therapy to improve the disease’s prognosis. This is the first report that directly compares the malignant potential and numerous gene expression of signaling pathway between right-sided and left-sided PDOs.
Tissue inhibitor matrix metalloproteinase 1 is a member of the TIMP family that inhibits the activity of matrix metalloproteinases (MMPs). TIMP1, independent of the protease inhibitor of MMPs, has been reported to have cytokine-like function for promoting cell proliferation and to be associated with anti-apoptosis and metastasis.31 TIMP1 is also reportedly a poor prognostic factor in multiple cancers including CRC,32 gastric cancer,33 breast cancer,34 and lung cancer.35 TIMP1 expression in CRC tissues was reportedly correlated with metastasis, advanced stages, and prognosis.36 However, contradictory studies showing no significant correlation between TIMP1 expression and prognosis have also been reported.37, 38 Regarding this point, importantly, we found in this study that TIMP1 was upregulated in right-sided cancer PDOs compared with normal PDOs, but TIMP1 was downregulated in left-sided cancer PDOs compared with normal PDOs; the ratio of right-sided to left-sided PDOs was 11.6. The contradiction among previous studies can be explained by our results; namely, TIMP1 plays a pivotal role in right-sided CRCs but not in left-sided CRCs. In fact, the TCGA public database analysis showed a significant difference in OS between high- and low-TIMP1 groups for right-sided CRCs but not left-sided CRCs. Regarding the TIMP1 mRNA expression levels in TCGA database analysis, the difference between right- and left-sided CRCs was not so substantial. This may be explained by the fact that the TIMP1 mRNA expression was analyzed using cancer tissues that included not only cancer cells but also interstitial cells, such as lymphocytes and fibroblasts, both of which have been reported to express TIMP1.39, 40
There have been mainly two TIMP1-related signal transduction pathways identified in CRCsP: the TIMP1/FAK/Akt pathway and the TIMP1/MAPK pathway.36 In this study, however, TIMP1 knockdown experiments using cancer PDOs clearly indicated that the TIMP1/FAK/Akt pathway was activated only in right-sided cancer PDOs while the TIMP1/MAPK pathway was not activated in either right- or left-sided PDOs. This is consistent with previous studies showing that TIMP1/FAK/Akt is associated with cancer proliferation activity and migration capability.36 Furthermore, we detected significantly higher expression of pAkt in all right-sided cancer PDOs than in any of the left-sided cancer PDOs (p = 0.0210; Figure S3), consistent with the findings that the TIMP1/FAK/Akt pathway is activated in right-sided cancer PDOs. Moreover, our finding that Akt/FAK inhibitors exhibited strong inhibitory effects on right-sided PDOs support the data on the activation of the TIMP1/FAK/Akt pathway in right-sided PDOs and may lead to the development of new agents to overcome the malignant potential of right-sided CRCs.
It has been widely reported that right-sided CRCs show a poorer prognosis than left-sided CRCs. We postulated that the poorer prognosis is attributable to the high proliferation activity, invasion/metastasis capability, and drug resistance. Although we did not mention drug sensitivity, we investigated the sensitivity of both-sided cancer PDOs to 5-FU, oxaliplatin, and irinotecan (SN38), which are used clinically as first-line chemotherapy. However, we did not find any significant differences in sensitivity (IC50s) to these drugs between right-sided and left-sided PDOs (data not shown), consistent with previous clinical trials of these drugs; there was no significantly different response to first-line chemotherapy with these drugs between right- and left-sided CRC.11 Eventually, regarding the genetic mutations of cancer PDOs, we used only PDO with RAS WT, BRAF WT, TP53 mutant, and MSS to compare right- and left-sided PDOs under the similar condition in this study. However, we found that the EGFR signaling pathway was predominantly activated in left-sided CRCs. Moreover, the IC50 value for cetuximab, an anti-EGFR agent, in left-side cancer PDOs was significantly lower than in right-sided cancer PDOs, consistent with previous reports.27, 28 Additionally, we did not find any significant correlation between activation of the EGFR pathway and TIMP1 status.
The major limitation of this study is that the number of PDOs studied was small. In fact, we found somewhat of a discrepancy between the data from TaqMan Array Plates for mRNA screening and RT-PCR, which might be partially due to small sample size. However, we were able to confirm high TIMP1 expression in right-sided PDOs and the correlation between high TIMP1 expression and poor prognosis in right-sided CRCs using the TCGA database with a large sample cohort. Because some studies have shown that the serum TIMP1 level can be used as a biomarker for CRCs,41 we are currently investigating the difference in serum TIMP1 levels between right-sided and left-sided CRCs.
In conclusion, we demonstrated that right-sided cancer PDOs had higher cell proliferation activity and higher invasion capability than left-sided cancer PDOs, possibly leading to a poorer prognosis in patients with right-sided CRCs. We revealed that the TIMP1/FAK/Akt signal transduction pathway was predominantly activated in right-sided cancer, and this signal transduction pathway may be a viable therapeutic target for improving the prognosis in right-sided CRCs.
ACKNOWLEDGMENT
The authors gratefully acknowledge helpful assistance of Misato Hirata (Tokushima University Graduate School).
DISCLOSURE
The authors have no conflict of interest.
APPROVAL OF THE RESEARCH PROTOCOL BY AN INSTITUTIONAL REVIEWER BOARD
This study was approved by the Ethics Committee of Tokushima University Hospital (No. 3085-2).
INFORMED CONSENT
The written informed consent was obtained from all patients.


