MYO10 contributes to the malignant phenotypes of colorectal cancer via RACK1 by activating integrin/Src/FAK signaling
Abstract
Liver metastases still remain a major cause of colorectal cancer (CRC) patient death. MYO10 is upregulated in several tumor types; however, its significance and the underlying mechanism in CRC are not entirely clear. Here, we found that MYO10 was highly expressed in CRC tumor tissues, especially in liver metastasis tissues. MYO10 knockout reduced CRC cell proliferation, invasion, and migration in vitro and CRC metastasis in vivo. We identified RACK1 by LC-MS/MS and demonstrated that MYO10 interacts with and stabilizes RACK1. Mechanistically, MYO10 promotes CRC cell progression and metastasis via ubiquitination-mediated RACK1 degradation and integrin/Src/FAK signaling activation. Therefore, the MYO10/RACK1/integrin/Src/FAK axis may play an important role in CRC progression and metastasis.
Abbreviations
-
- CCK-8
-
- cell-counting kit-8
-
- CRC
-
- colorectal cancer
-
- CRISPR
-
- clustered regularly interspaced short palindromic repeats
-
- DFS
-
- disease-free survival
-
- IHC
-
- immunohistochemical staining
-
- KEGG
-
- Kyoto Encyclopedia of Genes and Genomes
-
- LC-MS/MS
-
- liquid chromatograph mass spectrometer/mass spectrometer
-
- NSCLC
-
- non-small cell lung cancer
-
- qRT-PCR
-
- real-time quantitative polymerase chain reaction
-
- siRNA
-
- small interfering RNA
-
- TCGA
-
- The Cancer Genome Atlas
1 INTRODUCTION
Colorectal cancer (CRC) is the third most common diagnosed cancer,1 and about 50% of CRC patients develop metastatic disease.2 CRC metastasis is the leading cause of cancer mortality.3 Therefore, understanding the biological mechanism of metastasis is important for development of new treatment strategies and markers predictive of CRC metastasis.
MYO10 (also known as Myosin-X or Myo X) belongs to the family of unconventional myosins. MYO10 is broadly distributed in many tissues4 and involved in numerous essential biological process, for example, orientation of the mitotic spindle,5 endothelial cell migration and angiogenesis,6 filopodia formation,7 and cell motility.8 In addition, numerous studies have found that MYO10 is highly expressed in melanoma,9 breast cancer,10, 11 non–small cell lung cancer,12 prostate cancer,13 and cervical cancer,14 compared with normal tissues, and promotes proliferation, invasion, and migration of tumor cells. However, its functional role in metastasis, especially in liver metastasis, has yet to be fully characterized.
Receptor of activated protein C kinase 1 (RACK1) is a member of the Trp-Asp (WD) repeats family, which functions as a scaffold protein to transduce signals.15 RACK1 regulates numerous cellular processes, including growth, differentiation, invasion, and migration.16-20 The dysregulation of RACK1 is implicated in the development of numerous tumors types.15Studies have shown that RACK1 promotes the progression and chemoresistance in liver cancer,21 while RACK1 inhibits tumor metastases of gastric cancer.22 Thus, RACK1 may exert variable or even opposing roles in different types of cells or tissues.
In this study, we examined the role of MYO10 in progression and metastasis of CRC. Bioinformatic analyses found that MYO10 is highly expressed in CRC. Further experiments showed that MYO10 knockout inhibits tumorigenesis and metastasis in vitro and in vivo through the integrin/Src/FAK signaling pathway. In addition, MYO10 interacts with RACK1 and regulates its ubiquitination and proteasomal degradation in CRC. Therefore, MYO10 may play an important role in CRC tumorigenesis and hepatic metastasis.
2 MATERIALS AND METHODS
2.1 Cell lines and cell culture
Human CRC cell lines HCT116, SW620, SW480, DLD1, HCT8, HT29; human colonic epithelial cells NCM460; human embryonic kidney cells 293 T; and mouse colon cancer CT26 cells were purchased from the Cell Library of the Chinese Academy of Sciences. These cell lines were authenticated by short tandem repeat analysis and cultured in a 37°C, 5% CO2 incubator with culture media according to manufacturer's instructions.
2.2 Knockout of MYO10 by using CRISPR/Cas9 vector
For generation of the MYO10 knockout cell lines, the lentiCRISPR method was used.23 The guide RNAs (sgRNA) targeting MYO10 (Table S1) were designed at http://crispor.tefor.net/crispor.py. Lentivirus was produced according to the manufacturer's instructions. Cells were infected with lentiviral media, and then monoclonal cells were screened by a limiting dilution assay and confirmed by immunoblotting.
2.3 siRNA and plasmids construction and cell transfection or infection
The siRNAs targeting RACK1 mRNA were designed and synthesized by Tsingke. Sequences were as follows: si-RACK1: 5′-CUCUGGAUCUCGAGAUAAATT-3′, si-Control: 5′-UUC UCC GAA CGU GUC ACG UTT-3′. The siRNAs and plasmids were transfected into cells using Lipofectamine® 3000 transfection reagent (Invitrogen) according to the instruction.
The human MYO10 cDNA was subcloned into pEGFPC1 and pCDH-CMV-MCS-EF1-GFP vector. The human RACK1 and ITGB1 cDNA was subcloned into a pEnMCV-3×FLAG-SV40-Neo vector (MiaoLingPlasmid). Lentiviral packaging was carried out according to the instruction. The CT26-KO1 cells were subsequently infected with human-MYO10-OE lentivirus, and GFP-positive cells were selected with FACS AriaIII flow cytometer (BD Biosciences).
2.4 RNA extraction and qRT-PCR
Total RNA was extracted by the TRIZOL method and reverse-transcribed using a reverse transcription reagents (Vazyme). Each reaction of 20 μl containing 2 μl of primers (Table S2), 500 ng cDNA, and 10 μl AceQ® SYBR Green Master Mix (Vazyme) and qRT-PCR were performed in a CFX-96 instrument (BIORAD).
2.5 RNA-sequencing analysis
RNA-sequencing RNA samples were obtained from control and MYO10 knockout CT26 cells described above. Each sample was prepared in triplicate, and the nine samples were sent to BGI for high-through sequencing with DNBseq platform. RNA-sequencing data are available at NCBI under SRA accession number SRP355594.
2.6 Immunoblotting and antibodies
Cells were collected and lysed in RIPA buffer and incubated on ice for 30 minutes and centrifuged for 15 minutes (13,000 × g, 4°C). The proteins were transferred to the PVDF membrane after electrophoresis. Then, the membranes were blocked in 5% skim milk for 2 hours, incubated overnight at 4°C with the appropriate diluted primary antibodies, washed 5 × 10 minutes in TBST (TBS with 0.1% Tween20), and incubated with secondary antibody diluted in TBST for 1 hour. After washing five times for 10 minutes with TBST, bands were visualized with an ECL Western blot detection system (Tianneng). Information on the antibodies used is listed in Table S3.
2.7 Immunofluorescence and phalloidin staining
Cells were seeded in confocal dishes for 24 hours and fixed in 4% paraformaldehyde (PFA) (Aspen) for 30 minutes after 24 hours of incubation. The cells were treated with 0.1% TritonX-100 for 15 minutes and blocked with 5% normal donkey serum for 1 hour at room temperature. Subsequently primary antibody incubation was performed overnight at 4°C. After rinsing five times with PBS, the cells were incubated with appropriate fluorescent secondary antibody (Antgene) or Rhodamine Phalloidin (Invitrogen) for 1 hour at room temperature shielded from light. Nuclei were counterstained with DAPI (VectorLabs). Images were captured using a confocal laser-scanning microscope (SP8, Leica).
2.8 Immunoprecipitation and mass spectrometry identification
Cells were collected and lysed in IP buffer, and supernatant was collected and incubated with primary antibody overnight at 4°C. The protein-antibody complex was incubated with protein A/G magnetic beads (MCE) for 6 hours at 4°C. Protein-antibody-bead complexes were washed five times in PBST (PBS with 0.5% TritonX-100), and proteins were eluted by boiling in 1 × SDS-loading buffer for 5 minutes at 100°C for analysis by Western blot or LC-MS/MS mass spectrometry (BGI).
2.9 Ubiquitination assay
293 T cells were transfected with various combinations of plasmids, along with or without Myc-Ub. Thirty-six hours after transfection, cells were treated with MG132 for 6 hours before cell collection. Then cell lysates were immunoprecipitated with anti-FLAG antibody and analyzed by immunoblot using anti-Myc antibody to detect ubiquitinated proteins.
2.10 Cell proliferation assay
Cells were plated in 96-well plates (1000 cells/well) in quadruplicate. Following 24, 48, 72, 96, and 120 hours of cell incubation, 10 μl of cell-counting kit-8 (CCK-8) working solution (Vazyme) was added to the wells. Finally, absorbance at 450 nm was measured using a microplate reader (SpectraMax CMAX Plus, Molecular Devices).
2.11 Colony formation (2D) and soft-agar growth (3D) assay
For colony formation assay, the cells were plated in six-well plates (500 cells/well) and cultured for 12-14 days. After fixation in 4% PFA, colonies were stained with 0.1% crystal violet and counted.
For soft-agar assay, 1 × 10⁴ cells were plated in six-well plates in growth medium containing 0.6% agar on a layer of solidified media containing 1.2% agar. After 12-14 days of growth, the colonies were counted.
2.12 Wound-healing assay
Cells were seeded in six-well plates (5 × 10⁵ cells/well) and grown to 100% confluence. The scratch wound was generated using a 10-μl pipette tip and then the medium was replaced by serum-free medium. Scratch wounds were photographed at indicated time points.
2.13 Cell invasion and migration assays
Cells (5 × 10⁴ cells/well) were plated in the upper chamber (Corning) with (Transwell invasion assay) or without (Transwell migration assay) matrigel (BD Biosciences), and growth media with 20% FBS were added to the lower chamber. Twenty-four hours later, cells were fixed with 4% PFA, stained with 0.1% crystal violet, and counted under a microscope.
2.14 Animal studies and MRI
Four-to-five-week-old female BALB/c mice and BALB/c nude mice were purchased from Vital River Laboratories, housed in specific pathogen-free facilities in the Laboratory Animal Facility of Zhongnan Hospital. The HCT8 cells (NC, KO1, and KO2 cells, 5 × 10⁶ cells per mouse) and CT26 cells (NC, KO1, KO2, KO1-Ctrl, and KO1-homo-MYO10 cells, 5 × 10⁵ cells per mouse) were subcutaneously inoculated under the right armpits of mice or the dorsal flank area of the mice. Tumor size was measured every 2 days with Vernier calipers, and tumor volume was calculated using the standard formula: volume = length × (width)2/2.
For the liver metastasis model, the spleen was exposed through incision and tumor cells (CT26-NC, CT26-KO1, HCT8-NC, HCT8-KO1) were injected. Twenty to twenty-five days later, the mice were anesthetized using isoflurane, and MRI was conducted to scan tumors at the Wuhan Institute of Physics and Mathematics, Chinese Academy of Sciences, using a 7 T small animal MRI scanner (Biospec70/20USR). Then, all mice were sacrificed, and liver metastasis was evaluated. All animals were treated in accordance with guidelines of the Wuhan University Institutional Animal Care and Use Committee (ethics approval number: 2018042).
2.15 Immunohistochemistry
Immunohistochemical detection of Ki-67 in paraffin embedded mouse subcutaneous tumors and liver tissues was carried out using an antibody against Ki-67. DAB was used as a chromogen (reacted for 10 minutes), and hematoxylin was used as a counterstain. The histological sections were photographed under a light microscope (Olympus BX53).
2.16 Data mining based on available online datasets
Transcriptomic data and clinical data for CRC patients were downloaded from The Cancer Genome Atlas (TCGA) database (https://portal.gdc.cancer.gov/). The data of normal tissue samples were obtained from GTEx V8 release version (https://gtexportal.org/home/datasets). The dataset GSE41258 used was downloaded from the Gene Expression Omnibus (GEO) database (https://www.ncbi.nlm.nih.gov/geo/). Data analysis was performed in R software (version 4.1.2).
2.17 Clinical specimens
Paraffin-embedded CRC tissue sections were obtained from Zhongnan Hospital at Wuhan University in China. The study was approved by the ethics committee of Zhongnan Hospital, Wuhan University, China (ethic approval number: 2013020).
2.18 Statistical analysis
Statistical analyses were performed using SPSS 16.0. Mean ± SD was used to express normally distributed data, and Student's t test was used to perform comparison. Categorical data were analyzed with either Fisher exact test or chi-square test. Spearman rank correlation test was used in the correlation analysis. For disease-free survival (DFS), Kaplan-Meier and log-rank tests were used to perform analysis. Statistical significance was considered as a P value <0.05.
3 RESULTS
3.1 MYO10 knockout inhibits proliferation of CRC cells
Analysis of TCGA and GTEx databases indicates that MYO10 mRNA is upregulated in tumor tissues in CRC patients (Figure 1A). In addition, we found that elevated MYO10 expression is associated with liver metastasis (Figure 1B) and the higher MYO10 expression correlates with reduced DFS (Figure 1C). Then, we examined the level of MYO10 in CRC cells and observed that MYO10 was highly expressed in CRC cells compared with normal colon cell line NCM460 by qRT-PCR and immunoblotting (Figure 1D,E).
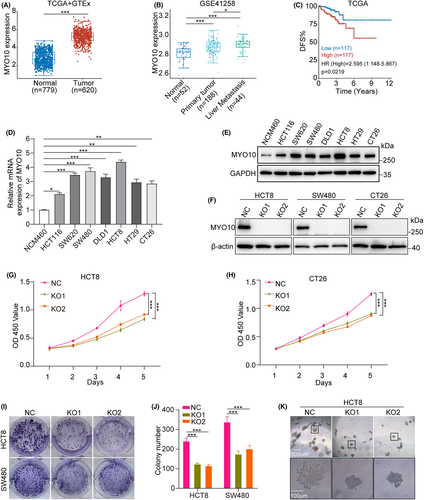
To further explore the biological role of MYO10, CRISPR/Cas9 technology was used to generate two independent knockout cell lines (KO1 and KO2) and control cells (NC) (Figure 1F). After MYO10 knockout, the proliferation, colony-formation abilities, and 3D colony-formation abilities of CRC cell lines were significantly decreased (Figure 1G–K). Taken together, these results suggested that MYO10 might be a vital regulator of proliferation in CRC cell lines.
3.2 MYO10 promotes filopodia formation, migration, and invasion of CRC cells
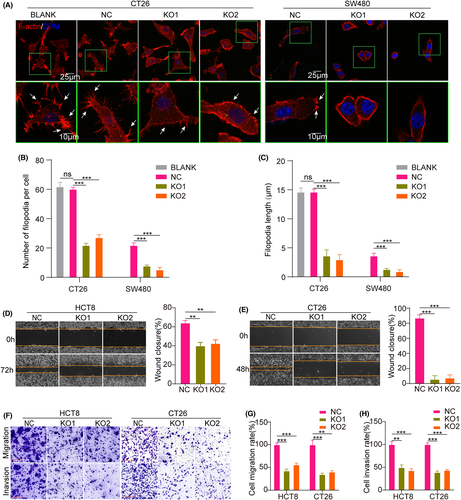
Researchers found that MYO10 expression facilitates filopodia formation and invasion.24 To gauge the relationship between MYO10 and cell metastatic ability, immunofluorescence staining showed that the number and length of filopodia were significantly reduced after MYO10 knockout in CT26 and SW480 cells (Figure 2A–C). Moreover, the wound-healing rates, migration, and invasion of CT26 and HCT8 cells were significantly attenuated by knockout of MYO10, compared with control cells (Figure 2D–H). Similar phenomenon was observed in SW480 cells (Figure S1A–E). These findings highlight that MYO10 acts as an important contributor to filopodia formation and elongation and metastasis in CRC cells.
3.3 Knocking out MYO10 suppressed tumor growth and liver metastasis of CRC in mouse models
To further evaluate the oncogenic role of MYO10 on CRC cells in vivo, murine subcutaneous models were established. We found that knockout of MYO10 significantly reduced the tumorgenicity of HCT8 cells in subcutaneous xenografts in BALB/c nude mice (Figure 3A,B). IHC staining showed that the percentage of Ki67 positive cells was greatly decreased following MYO10 knockout in xenograft tumors (Figure 3C). An unexpected result was that formation of subcutaneous tumors was not observed in the KO group (mice injected with MYO10 knockout CT26 cells) (Figure 3D,E). In summary, these data indicate that MYO10 knockout inhibits tumorigenesis of CRC cells in vivo.
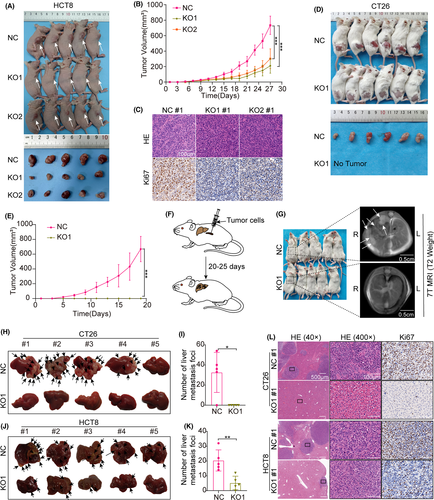
Next, we tested how deletion of MYO10 affected in vivo hepatic tumor seeding following intrasplenic injection of CT26 and HCT8 cells in BALB/c or BALB/c nude mice (Figure 3F). Twenty days later, we examined the abdomen of these BALB/c mice with a 7 T MRI scanner (Figure 3G). When the livers were dissected out, we found that transferred liver tumors were formed in 80% (4/5) of mice injected with CT26 control cells, but not in those injected with MYO10 knockout cells (Figure 3H,I). Additionally, we found that the liver metastasis tumors were significantly lower in the MYO10 knockout group (HCT8-KO1) than in the control group (HCT8-NC) in BALB/c nude mice (Figure 3J,K). HE and IHC staining of the liver tissue indicated the metastasis nodules in the control group but not in the CT26-MYO10-KO group, and in the BALB/c nude mice of the HCT8-NC group, the diameter and number of liver metastasis foci were larger and higher than those in the MYO10 knockout group (Figure 3L). These results demonstrate that the knockout of MYO10 significantly inhibits CRC liver metastasis in vivo.
3.4 MYO10 interacted and colocalized with RACK1 in CRC cells
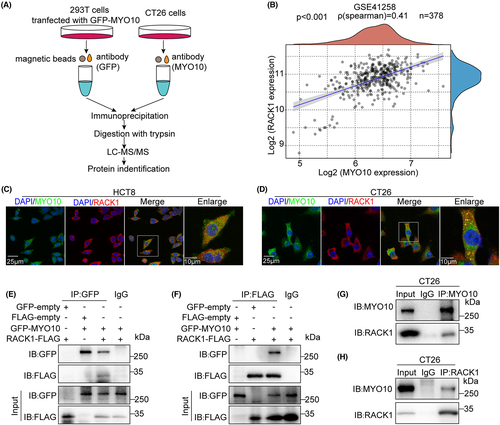
To obtain insight into the mechanism of action of MYO10, we sought to identify potential proteins targeting the MYO10 interaction. 293 T cells were transfected with GFP-MYO10 plasmids and CT26 cells as endogenous sample. Whole cell lysates were collected for immunoprecipitation with anti-GFP antibody or anti-MYO10 antibody separately, and the binding partners were identified by LC-MS/MS (Figures 4A, S2). We identified 543 human proteins and 611 mouse proteins, respectively (Table S4, S5). Among them, RACK1 is associated with the organization of the actin cytoskeleton;25 we therefore chose this protein for subsequent studies. A correlation was found between MYO10 expression and the expression of RACK1 in the GSE41258 dataset (Figure 4B). Immunofluorescence staining indicated that MYO10 colocalized with RACK1 in HCT8 and CT26 cells (Figure 4C,D). Immunoprecipitation assay showed the interaction between both exogenous and endogenous MYO10 with RACK1 (Figure 4E–H). These results suggested that MYO10 interacts and colocalizes with RACK1.
3.5 MYO10 regulates RACK1 stability
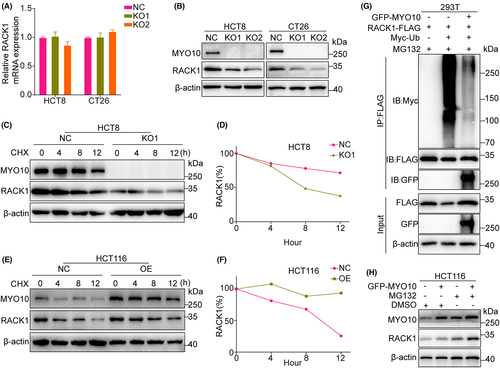
To prove the underlying mechanism by which MYO10 regulates RACK1, we performed qRT-PCR and immunoblotting and found a concomitant decrease in RACK1 protein levels but not in mRNA levels with MYO10 knockout (Figure 5A,B). Therefore, we postulated that RACK1 might be regulated by post-translational modifications (PTMs) that affect its stability. Cycloheximide (CHX) chase experiments showed a shorter half-life of RACK1 in MYO10 knockout HCT8 cells compared with the control cells, while opposite phenomena were observed in HCT116 cells overexpressing MYO10 (Figure 5C–F). It has been documented that RACK1 can be degraded by the ubiquitin-proteasome pathway.26, 27Ubiquitination assays showed that overexpression of MYO10 significantly decreased the level of polyubiquitination of RACK1 in 293 T cells (Figure 5G). In addition, we observed that the protein level of RACK1 elevated as the expression level of MYO10 increased, and the degradation of RACK1 was partly inhibited by the proteasome inhibitor MG132 (Figure 5H). Taken together, MYO10 maintains the stability of RACK1 via the ubiquitination-proteasome pathway.
3.6 MYO10 regulates integrin/Src/FAK signaling in CRC
To delineate the molecular mechanisms through which MYO10 regulates proliferation and metastasis of CRC cells, high-throughput mRNA sequencing (RNA-seq) were conducted in two MYO10 knockout cells of CT26 (KO1 and KO2) and controls. The KO1 and KO2 groups exhibited a distinct gene expression profile, with 1327 and 256 differentially expressed genes (DEGs) when compared with control cells, respectively (fold change >1.5, p < 0.05) (Figure 6A). Moreover, KEGG enrichment analysis of 140 common DEGs revealed that “ECM-receptor interaction” was the most enriched pathway (Figure 6B).
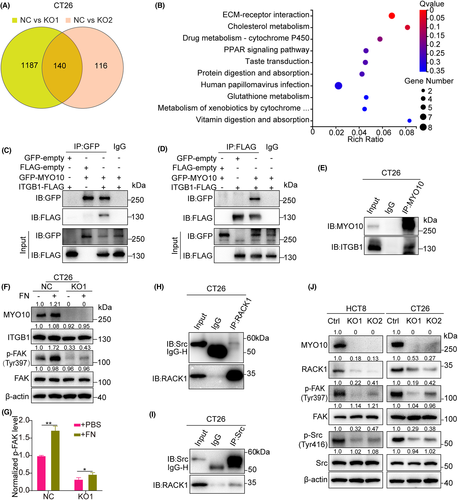
Recently, it was reported that MYO10 regulates integrin β1 activity at filopodia tips.28 As shown in Figure 6C,D, GFP-MYO10 was successfully coimmunoprecipitated by ITGB1-FLAG. Additionally, endogenous interaction between MYO10 and ITGB1 was revealed in CT26 cells (Figure 6E). Fibronectin (FN) is the major ligand for integrin α5β1 and αvβ1.29 Knockout of MYO10 reduced FN-dependent activation of FAK signaling (Figures 6F–G, S3). It was reported that RACK1 interacts with Src in osteoclasts.30 Likewise, we confirmed this interaction between RACK1 and Src in CT26 cells (Figure 6H–I). Moreover, we found that the protein level of RACK1 and the phosphorylated Src (Tyr416) and phosphorylated FAK (Tyr397) levels were decreased without alteration of the total protein levels after MYO10 knockout (Figures 6J, S4). Collectively, these results suggested that MYO10 might partly participate in the promotion of progression and metastasis through the integrin/Src/FAK pathway.
3.7 MYO10 regulates integrin/Src/FAK signaling in a RACK1-dependent manner
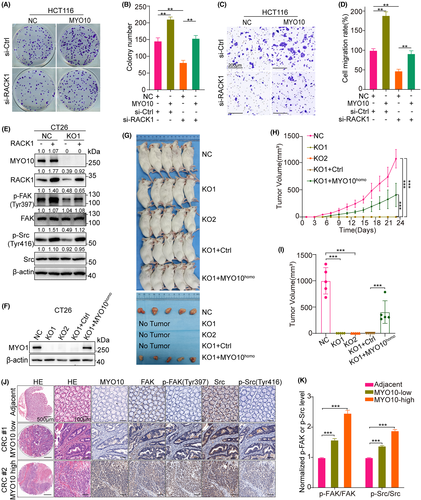
To further verify whether MYO10 promotes CRC progression and metastasis by the regulation of RACK1, the siRACK1 and the MYO10-overexpressing HCT116 cells were prepared. Colony-formation assay showed that the suppression of RACK1 partly inhibits the colony number increased by MYO10 overexpression (Figure 7A,B). Moreover, knocking down RACK1 reversed the MYO10-induced cell migration of HCT116 cells (Figure 7C,D). Immunoblotting confirmed that overexpression of RACK1 could rescue the downregulation of p-Src (Tyr416) and p-FAK (Tyr397) protein level caused by MYO10 knockout (Figures 7E, S5). To confirm whether the poor tumorigenicity of CT26-KO cells in vivo was caused by knockout of MYO10, we used a lentiviral vector to partly restore the protein level of MYO10 in CT26-KO1 cell lines (Figure 7F). The engraftment potential of CT26-KO1 cells was partly rescued in vivo by overexpression of human MYO10 gene, while the volume of the tumor relatively small as compared to the CT26-NC group (Figure 7G–I). Immunofluorescence staining of human colorectal tissue microarrays revealed that FAK protein and FAK tyrosine phosphorylation (Tyr397) levels are elevated in CRC tumors compared with adjacent normal tissue; the same trend was observed for Src and Src tyrosine phosphorylation (Tyr416). Moreover, FAK and Src phosphorylation levels were higher in MYO10-high tumor tissues as compared with MYO10-low tumor tissues (Figure 7J,K). Together, these results demonstrate that MYO10 may act as an oncogene by regulating RACK1's functions in CRC.
4 DISCUSSION
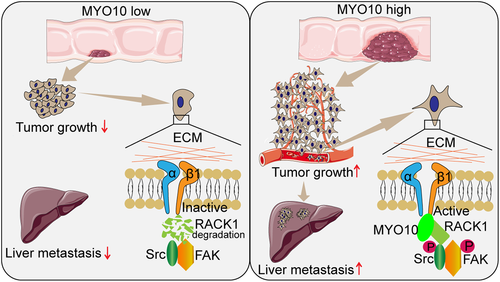
Despite significant advances in the treatment of metastatic disease to the liver, hepatic metastases still remain a major cause of death in CRC patients.31 To date, few studies have been carried out to elucidate the relationship between MYO10 and CRC progression. In our study, the expression of MYO10 was upregulated in CRC patients and was correlated with a metastatic phenotype. Data from in vitro and in vivo experiments confirmed that MYO10 enhanced the progression and metastasis ability of CRC cells by interacting with RACK1. MYO10 reduced the proteasomal degradation of RACK1 and enhanced protein stability, which further induced the activation of the integrin/Src/FAK pathway. Together, our findings suggested that MYO10 promotes CRC progression and metastasis via RACK1 by modulating Src /FAK signaling activation (Figure 8).
It has been reported that MYO10 is associated with filopodia formation and elongation.32 Studies showed that filopodia promote neurite outgrowth,33, 34 and knockdown of MYO10 impair neuronal adhesion.35 MYO10 is highly expressed in several types of cancer, and increased MYO10 promotes breast cancer invasion and metastasis.10, 11 Moreover, elevated MYO10 predicts poor prognosis and promotes cell proliferation and migration in cervical cancer.14Some researchers found that MYO10-driven filopodia are crucial for leader driven NSCLC collective invasion.36 Recently, it has been demonstrated that MYO10 drives genomic instability and inflammation in cancer.37 Here, we first reported the correlation between high expression of MYO10 and CRC development and further clarified the function and mechanism underlying this process.
In the LC-MS/MS results, RACK1 was found to be a potential MYO10-interacting protein, and we further confirmed the interaction between MYO10 and RACK1. Researchers have found that RACK1 has different properties in different neoplasms, with some suppressing tumorigenesis while others promoting tumor progression.19, 21, 22, 38-40 It was found that RACK1 acts as a tumor-promoting factor in CRC.41 Moreover, RACK1 promotes tumorigenicity of CRC by inducing cell autophagy.42 Our data showed that the protein level of RACK1 is downregulated in MYO10 knockout CRC cells, but there was no decrease in the mRNA level. The half-life of the RACK1 protein was markedly decreased in MYO10 knockout cells, while MYO10 overexpression increased the half-life of RACK1. In MYO10-overexpressing cells, proteasome inhibitor MG132 inhibited the degradation of RACK1, thus indicating that MYO10 and RACK1 interaction may cause a structural change and result in the reduction of RACK1 ubiquitination and degradation.
Recent studies suggested that MYO10 and talin regulate integrin activity at filopodia tips.28 Integrins α5β1 and αvβ1 interact with FN and other ECM proteins to facilitate cancer progression,43 and FN is the major ligand for integrin α5β1 and αvβ1, triggering the integrin/FAK signal pathway after binding.44 Studies revealed that MYO10 is not directly interacting with FN36. LC-MS/MS and immunoprecipitation data revealed that MYO10 interacts with integrin β1. Although integrin β1 protein expression showed no significant change, knocking out MYO10 significantly reduced FN-dependent activation of FAK signaling. The scaffold protein RACK1 links the integrin effector focal adhesion kinase (FAK) to other proteins.45 A study found that high RACK1 expression increased phosphorylation of Src at Tyr416 in neuroblastoma.46 Active Src (p-Src Tyr416) localizes to filopodia and plays a critical role in filopodia induction.24 In our research, we confirmed the interaction between RACK1 and Src in CRC cells, and the phosphorylation levels of Src (Tyr416) and FAK (Tyr397) were significantly inhibited in MYO10 knockout cells. Thus, MYO10 interacts with RACK1 and regulates integrin/Src/FAK signaling in CRC cells.
In conclusion, our studies demonstrated that MYO10 can promote the progression and metastasis of CRC. We found that MYO10 interacts with RACK1 and regulates the activation of integrin β1 and integrin/Src/FAK signaling in CRC. Our work provided new insights into the pathogenesis of CRC and may suggest an avenue for the treatment of liver metastasis.
ACKNOWLEDGMENTS
We would like to thank Prof. Bin Zhang, Tongji Medical College of Huazhong University of Science & Technology, for his gift of lentiCRISPR v2 and package plasmids. This study used The Cancer Genome Atlas (TCGA) portal and Gene Expression Omnibus (GEO) database. We acknowledge the efforts of the National Cancer Institute in the creation of these databases and the Figuredraw platform.
FUNDING INFORMATION
National Natural Science Foundation of China (Grant/Award Number: ‘81370070’, ‘81472799’).
DISCLOSURE
There are no competing interests any of the authors.
ETHICS STATEMENT
Approval of the research protocol by an Institutional Reviewer Board. Paraffin-embedded colorectal cancer tissue sections were obtained from Zhongnan Hospital at Wuhan University in China. The study was approved by the ethics committee of Zhongnan Hospital, Wuhan University, China (ethics approval number: 2013020).
INFORMED CONSENT
All clinical samples were obtained with informed consent by the patients.
ANIMAL STUDIES
All animals were treated in accordance with guidelines of the Wuhan University Institutional Animal Care and Use Committee (ethics approval number: 2018042).


