Metabolic characterization of invaded cells of the pancreatic cancer cell line, PANC-1
Funding Information
Grant-in-Aid for Scientific Research (C) (grant no. 22461934 to TI) and for Young Scientists (B) (grant no. 15K19833 for MF) from the Japan Society for the Promotion of Science.
Abstract
We previously reported that about 0.4% of cells in the cultured human pancreatic cancer cell line, PANC-1, can invade matrigel during the transwell invasion assay, suggesting that these invaded PANC-1 cells may have specific characteristics to keep their invasive potential. To identify the metabolic characterization specific in the invaded PANC-1 cells, metabolome analysis of the invaded PANC-1 compared with the whole cultured PANC-1 was performed using CE-TOFMS, and concentrations of 110 metabolites were measured. In contrast to the whole cultured cells, the invaded PANC-1 was characterized as a population with reduced levels of amino acids and TCA cycle intermediates, and decreased and increased intermediates in glycolysis and nucleic acid metabolism. In particular, the ratio of both adenosine and guanosine energy charge was reduced in the invaded cells, revealing that the consumption of ATP and GTP was high in the invaded cells, and thus suggesting that ATP- or GTP-generating pathways are stimulated. In addition, the GSH/GSSG ratio was low in the invaded cells, but these cells had a higher surviving fraction after exposure to hydrogen peroxide. Thus, the invaded cells were the population resistant to oxidative stress. Furthermore, reduction in intracellular GSH content inhibited PANC-1 invasiveness, indicated that GSH has an important role in PANC-1 invasiveness. Overall, we propose the invaded cells have several unique metabolic profiles.
Metastasis is the primary cause of mortality in cancer patients.1, 2 During the early steps of metastasis, tumor cells have to invade through the tumor tissue.3 Thus, understanding the characteristics of the distinct tumor cell population exhibiting the invasive phenotype compared with the non-invasive cell population is fundamental for developing novel strategies to counter metastasis.
Boyden chamber transwell assay is one of the commonly used experimental setups for determining the tumor cell invasiveness in vitro.4 The two mediums in the chambers, usually serum-free medium is placed in the upper well and serum-containing medium is placed in the bottom well, are separated by a porous membrane on which a thin layer of extracellular matrix (ECM) is coated. Interestingly, when cells of an identical cell line are seeded in the upper well of the transwell, only a small population of cells invades through the ECM. In our experiments using four human pancreatic cancer cell lines, 0.2–2.6% of the cells invaded under the same assay conditions.5, 6 In the case of PANC-1 cells, about 0.4% of the seeded cells invaded through ECM and reached the bottom of the porous membrane. These invaded PANC-1 cells exhibited nitric oxide (NO) production compared with the whole cultured PANC-1, and the NOS-NO-PI3K-AKT2 pathway was activated.6 Phosphorylated-AKT2 was co-localized with phosphorylated-GIRDIN, which is an essential factor for actin organization and lamellipodia formation,7, 8 suggesting that the invaded cell population may have unique characteristics relevant to the invasive phenotype.
Metabolomics is a rapidly growing field of post-genomics research.9, 10 Metabolism is either directly or indirectly involved in every cell function; thus, the metabolic profile is believed to be relevant information reflecting the phenotype of any cell.9, 11-13 Cells in the invasive process are required to alternate their ECM-adhesion state and display directional polarity in modifying their shapes. During the mesenchymal mode of motility, cells produce proteases to penetrate the ECM and move through the ECM, forming a leading edge at the front and a lagging edge at the back of the cell body. On the other hand, cells in the amoeboid mode move through the ECM as rounded bodies, forming bleb-like protrusions without breaking the ECM.14, 15 Thus, in contrast to the cell population of non-invasive cells, the cells exhibiting the invasive potential require different kinds of materials, such as amino acids, nucleic acids, lipids or fatty acids, which may show as unique features in the metabolome. Since the metabolites consumed in different cell lines are thought to be affected by their different genetic backgrounds, collecting the distinct cell population exhibiting the invasive phenotype from cells of the identical cell line would be intriguing for analyzing the metabolism relevant to the invasive phenotype. However, to our knowledge, no study has been conducted to examine the metabolic characterization of a cell population exhibiting the invasive phenotype within the identical cell line.
In the present study, we used the PANC-1 cell line and collected the PANC-1 invaded cells that reached the undersurface of the transwell membrane. Since most PANC-1 cells, about 99.6% within the whole cultured cell line, failed to reach the undersurface of the transwell, and only about 0.4% of PANC-1 cells could invade in our invasion assay,6 we decided to use the whole cultured PANC-1 cell line as the control group for comparison with the collected invaded group. We analyzed the metabolic characterization specific in the PANC-1 invaded cells compared with the whole cultured PANC-1.
Materials and Methods
Cell culture and reagents
The human pancreatic cancer cell line, PANC-1 was purchased from ATCC (Manassas, VA, USA) and cultured in Dulbecco's modified Eagle's medium (DMEM; Nissui Pharmaceutical Co., Tokyo, Japan) supplemented with 10% fetal bovine serum (FBS, HyClone Laboratories, GE Healthcare, Logan, UT, USA), 2 mM L-glutamine, and 100 U/mL penicillin/streptomycin (Gibco, Gaithersburg, MD, USA) in a humidified atmosphere with 5% CO2 at 37°C. SUM149, a human inflammatory ductal carcinoma cell line, was purchased from Asterand Bioscience (Ann Arbor, MI, USA) and grown in Ham's F-12 medium (Gibco) supplemented with 5% FBS (GE Healthcare), 5 μg/mL insulin (Sigma Aldrich, St. Louis, MO, USA), 1 μg/mL hydrocortisone (Sigma Aldrich), and 100 U/mL penicillin/streptomycin (Gibco). L-buthionine-sulfoximine (BSO), an inhibitor of GSH biosynthesis, was purchased from Sigma Aldrich. Cells in logarithmic growth phase seeded at an appropriate density were used for all experiments.
Real time imaging of the invading cells from the 3D spheroid
Cells were seeded into a 96-well ultra-low attachment plate (Corning, NY, USA, 1 × 10⁴ cells/ well) with 100 μL DMEM supplemented with 10% FBS, 2 mM L-glutamine, and 100 U/mL penicillin/streptomycin, and spheroid formation was proceeded with by incubating the plate in a 5% CO2 incubator at 37°C for 72 h. Half of the media, 50 μL, was carefully removed, and 50 μL of matrigel with concentration of 6 mg/mL protein (BD Biosciences, Franklin Lakes, NJ, USA) was poured into each well so that the final concentration of matrigel was 3 mg/mL; this was solidified for 2 h in the CO2 incubator. The plate was then centrifuged at 100 g for 3 min, and movies of the real time imaging of the spheroid embedded in the matrigel were captured using IncuCyte Zoom (Essen BioScience Inc., Ann Arbor, MI, USA).
Preparing the invaded cells and whole cultured cells
To prepare the invaded cells, Boyden chamber transwell invasion assays were performed as described previously.6, 16 Briefly, cells were trypsinized and viable cell numbers were counted with trypan blue. Cells were then separated into two sets; one of them was for the collection of whole cultured cells, the other set is for preparing the invaded cells, respectively. For the collection of whole cultured cells, cells were suspended into serum-added DMEM, and 1 × 10⁶ cells were seeded on the 10 cm culture dish. For collecting the invaded cells, cells were suspended into serum-free DMEM containing 0.35% BSA, and 1 × 10⁶ cells were seeded into the upper well of the transwell chamber (the 24 mm transwell insert diameter with a pore size of 8 μm, Corning) coated with 21 μL matrigel (3 mg/mL concentration); 90 transwells were used for each experiment. DMEM supplemented with 10% fetal bovine serum was added to the lower well as a chemoattractant. After incubation for 24 h from the time of cell seeding on the matrigel, the non-invasive cells remaining on the matrigel-coated side were wiped off with a cotton swab, and the cells that reached the undersurface of transwell membrane were collected by incubating the cells with accutase (Innovative Cell Technologies, San Diego, CA, USA) for 30 min at room temperature. Invaded cells, which were collected from thirty transwells, were pooled together so that three sets of invaded cell groups were made, and we used those three sets to test reproducibility of metabolites analysis. At the same time point with the collection of the invaded cells, the whole cultured cells were also collected with accutase for 30 min incubation at room temperature. Collected cells were suspended in DMEM and used for the metabolome analysis.
Sample preparation for the metabolome analysis
The invaded cells and the whole cultured cells (1 × 10⁵ cells/sample for the invaded cells, and 1 × 10⁶ cells/sample for the whole cultured cells, respectively) were used for the extraction of intracellular metabolites. Cells were collected by centrifugation at 1000 g for 5 min at room temperature and washed twice with 5% mannitol solution. Cells were then treated with methanol to inactivate enzymes. Cell extract was treated with milliQ containing internal standards (Human Metabolome Technologies, Inc., Tsuruoka, Yamagata, Japan). The extract was centrifuged at 2300 g and 4°C for 5 min, and the aqueous layer was filtrated through a Millipore 5-kDa cutoff filter (Merck Millipore, Billerica, MS, USA) at 9100 g and 4°C for 120 min. The concentrated filtrate was then re-suspended into 50 μL of milliQ for the CE-MS analysis.
Metabolome analysis by CE-TOFMS
CE-TOFMS was performed using an Agilent CE Capillary Electrophoresis System with an Agilent 6210 Time of Flight mass spectrometer, Agilent 1100 isocratic HPLC pump, Agilent G1603A CE-MS adapter kit, and Agilent G1607A CE-ESI-MS sprayer kit (Agilent Technologies, Waldbronn, Germany), as described in the previous papers.17-20 The systems were controlled by the Agilent G2201AA ChemStation software version B.03.01 for CE (Agilent Technologies). The metabolites were analyzed by using a fused silica capillary with the electrophoresis buffer (Human Metabolome Technologies) as the electrolyte. The sample was injected at a pressure of 50 mbar for 10 s in cation analysis and 25 s in anion analysis. The spectrometer was scanned from m/z 50 to 1000.
Metabolome data analysis
Raw data measured by CE-TOFMS was analyzed using the MasterHands software (Keio University, Tsuruoka, Japan), and peak information including m/z, migration time for CE-TOFMS measurement (MT), and peak area were obtained.21 Signal peaks corresponding to isotopomers, adduct ions, and other product ions of known metabolites were excluded, and the remaining peaks were annotated with the putative metabolites from the HMT metabolite database (Human Metabolome Technologies) based on their MTs and m/z values determined by TOFMS. The tolerance range for the peak annotation was configured at ±0.5 min for MT, and ±10 ppm for m/z. In addition, peak areas were normalized against those of the internal standards, and the resultant relative area values were normalized by the sample amount. Principal component analysis (PCA) were performed by the software, SampleStat (Human Metabolome Technologies).
Calculation of energy charge

GSH and GSSG measurement

Cell viability assays
Invaded PANC-1 cells or the whole cultured PANC-1 cells were plated as 7000 cells per well in black 96-well plates and allowed to attach overnight in CO2 incubator at 37°C. The next day, appropriate concentrations of hydrogen peroxide (H2O2) were added with or without the addition of 50 mM N-acetylcysteine (NAC) solution pre-adjusted with NaOH to a pH of 7. Cells were further incubated for 24 h in a CO2 incubator, and cell viability was measured with CellTiter blue, according to the manufacture's protocol (Promega).
Statistical analysis
Statistical analyses were performed using unpaired Student's t-test. All of the statistical analyses were performed using a two-sided test. A P < 0.05 was considered significant.
Results
Real time-imaging of invading cells from the 3D spheroid embedded in matrigel
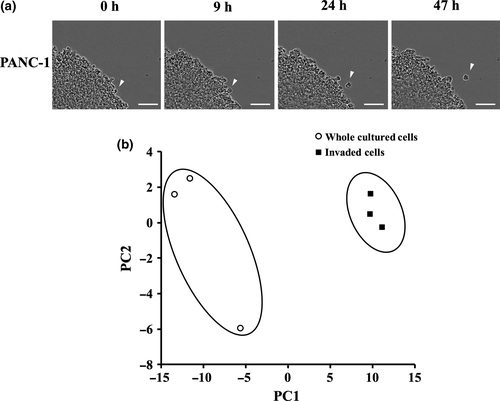
Before collecting the invaded PANC-1 cells from the underneath of the transwell chamber, we first checked the cells exhibiting invasive potential within the whole cultured PANC-1. The PANC-1 spheroid was embedded in matrigel of the same rigidity as that used in the invasion assay, and the cells from the spheroid invading into the matrigel were observed with real-time imaging. As in Movie S1 and Figure 1(a), we confirmed that the invading PANC-1 cell clearly moved apart from the spheroid, which is distinct from the spheroid population.
Metabolomics profile of invaded PANC-1 cells compared with the whole cultured PANC-1
Invaded PANC-1 cells and the whole cultured PANC-1 were collected (Fig. S1), and metabolites in these cells were analyzed by CE-TOFMS. PCA indicated that the metabolomics profile of the invaded cells was very distinct from those of the whole cultured PANC-1 (Fig. S1b). Among the metabolites whose concentrations were detected, the levels of 43 metabolites were significantly decreased in the invaded PANC-1 compared with the whole cultured cells; these were 18 amino acids, three glycolytic intermediate metabolites, three TCA cycle intermediates, and nine compounds produced during nucleic acids metabolism (Table 1). In contrast, the levels of only six metabolites were significantly increased in the invaded cells compared with the whole cultured cells, including two glycolytic metabolites, 3-Phoshoglyceric acid (3PG) and phosphoenolpyruvic acid (PEP), and four intermediates from nucleic acids metabolism, IMP, GMP, AMP, and UMP (Table 2).
| Metabolite | KEGG ID | HMDB ID | Major category | Ratio (INV/WCC)* |
|---|---|---|---|---|
| Ornithine | C00077,C00515,C01602 | HMDB00214,HMDB03374 | Amino acid metabolism (arginine, glycine, proline, serine, threonine) | 0.15 ± 0.07 |
| Thr | C00188,C00820 | HMDB00167 | Essential amino acid | 0.14 ± 0.04 |
| Glucose 6-phosphate | C00668,C01172,C00092 | HMDB01401 | Sugar metabolism (Carbohydrate metabolism, Glycogen, Glycolysis) | 0.18 ± 0.05 |
| Betaine | C00719 | HMDB00043 | Amino acid metabolism (glycine, methionine, serine, threonine) | 0.17 ± 0.04 |
| Lys | C00047,C00739,C16440 | HMDB00182,HMDB03405 | Essential amino acid | 0.20 ± 0.05 |
| Ile | C00407,C06418,C16434 | HMDB00172 | Essential amino acid | 0.21 ± 0.04 |
| Gly | C00037 | HMDB00123 | Non-essential amino acid | 0.21 ± 0.04 |
| Met | C00073,C00855,C01733 | HMDB00696 | Essential amino acid | 0.21 ± 0.03 |
| Arg | C00062,C00792 | HMDB00517,HMDB03416 | Non-essential amino acid | 0.22 ± 0.05 |
| β-Ala | C00099 | HMDB00056 | Amino acid metabolism | 0.22 ± 0.06 |
| Tyr | C00082,C01536,C06420 | HMDB00158 | Non-essential amino acid | 0.25 ± 0.06 |
| Creatine | C00300 | HMDB00064 | Creatine metabolism | 0.27 ± 0.06 |
| Val | C00183,C06417,C16436 | HMDB00883 | Essential amino acid | 0.27 ± 0.05 |
| Succinic acid | C00042 | HMDB00254 | TCA cycle | 0.28 ± 0.10 |
| Glu | C00025,C00217,C00302 | HMDB00148,HMDB03339 | Non-essential amino acid | 0.28 ± 0.06 |
| His | C00135,C00768,C06419 | HMDB00177 | Essential amino acid | 0.29 ± 0.05 |
| Phe | C00079,C02057,C02265 | HMDB00159 | Essential amino acid | 0.29 ± 0.07 |
| Leu | C00123,C01570,C16439 | HMDB00687 | Essential amino acid | 0.30 ± 0.07 |
| Pro | C00148,C00763,C16435 | HMDB00162,HMDB03411 | Non-essential amino acid | 0.32 ± 0.07 |
| Choline | C00114 | HMDB00097 | Lipid, Fatty Acid metabolism | 0.35 ± 0.08 |
| Ala | C00041,C00133,C01401 | HMDB00161,HMDB01310 | Non-essential amino acid | 0.37 ± 0.04 |
| CTP | C00063 | HMDB00082 | Nucleic acid metabolism, Pyrimidine | 0.37 ± 0.01 |
| UTP | C00075 | HMDB00285 | Nucleic acid metabolism, Pyrimidine | 0.38 ± 0.03 |
| Guanosine | C00387 | HMDB00133 | Nucleic acid metabolism, Purine | 0.40 ± 0.10 |
| Trp | C00078,C00525,C00806 | HMDB00929 | Essential amino acid | 0.39 ± 0.08 |
| ATP | C00002 | HMDB00538 | Nucleic acid metabolism, Purine | 0.39 ± 0.02 |
| Glycerol 3-phosphate | C00093 | HMDB00126 | Sugar metabolism (Glycolysis) | 0.42 ± 0.08 |
| Ser | C00065,C00716,C00740 | HMDB00187,HMDB03406 | Non-essential amino acid | 0.42 ± 0.07 |
| Glutathione (GSH) | C00051 | HMDB00125 | Glutathione metabolism | 0.44 ± 0.11 |
| Lactic acid | C00186,C00256,C01432 | HMDB00190,HMDB01311 | Sugar metabolism (Glycolysis) | 0.46 ± 0.14 |
| Asp | C00049,C00402,C16433 | HMDB00191,HMDB06483 | Non-essential amino acid | 0.47 ± 0.14 |
| GTP | C00044 | HMDB01273 | Nucleic acid metabolism, Purine | 0.45 ± 0.02 |
| Malic acid | C00149,C00497,C00711 | HMDB00156,HMDB00744 | TCA cycle | 0.47 ± 0.04 |
| CDP | C00112 | HMDB01546 | Nucleic acid metabolism, Pyrimidine | 0.48 ± 0.11 |
| ADP | C00008 | HMDB01341 | Nucleic acid metabolism, Purine | 0.48 ± 0.03 |
| Citrulline | C00327 | HMDB00904 | Urea cycle | 0.54 ± 0.23 |
| NAD+ | C00003 | HMDB00902 | Electron carrier | 0.54 ± 0.06 |
| Asn | C00152,C01905,C16438 | HMDB00168 | Non-essential amino acid | 0.56 ± 0.05 |
| UDP | C00015 | HMDB00295 | Nuleic acid metabolism, Pyrimidine | 0.57 ± 0.07 |
| S-Adenosylmethionine | C00019 | HMDB01185 | Methyl-group donor | 0.59 ± 0.11 |
| Citric acid | C00158 | HMDB00094 | TCA cycle | 0.59 ± 0.01 |
| Glutathione (GSSG)_divalent | C00127 | HMDB03337 | Glutathione metabolism | 0.61 ± 0.08 |
| GDP | C00035 | HMDB01201 | Nucleic acid metabolism, Purine | 0.70 ± 0.08 |
- *The ratio was calcultaed by dividing the metabolite concentrations of invaded cells with those of the whole cultured cells. The metabolites which were significantly decreased in INV compared to WCC were listed in the table. P < 0.05, n = 3.
| Metabolite | KEGG ID | HMDB ID | Major category | Ratio (INV/WCC)* |
|---|---|---|---|---|
| 3-Phosphoglyceric acid | C00197 | HMDB00807 | Sugar metabolism (Glycolysis) | 3.13 ± 0.56 |
| IMP | C00130 | HMDB00175 | Nuleic acid metabolism, Purine | 2.01 ± 0.28 |
| Phosphoenolpyruvic acid | C00074 | HMDB00263 | Sugar metabolism (Glycolysis) | 1.86 ± 0.30 |
| GMP | C00144 | HMDB01397 | Nuleic acid metabolism, Purine | 1.50 ± 0.16 |
| AMP | C00020 | HMDB00045 | Nuleic acid metabolism, Purine | 1.36 ± 0.20 |
| UMP | C00105 | HMDB00288 | Nuleic acid metabolism, Pyrimidine | 1.20 ± 0.11 |
- *The ratio was calculated by dividing the metabolite concentrations of invaded cells with those of the whole cultured cells. The metabolites which were significantly increased in INV compared to WCC were listed in the table. P < 0.05, n = 3.
The 20 amino acids can be divided into two groups, essential or non-essential amino acids. Most of the amino acids, 18 out of the 20 amino acids, were reduced in the invaded cells (Table 1), and we further divided those amino acids into essential or non-essential amino acid groups and calculated the total amounts for each group. The results showed that both levels, essential and non-essential, were similarly reduced in the invaded cells compared with the whole cultured cells (Fig. 2a).
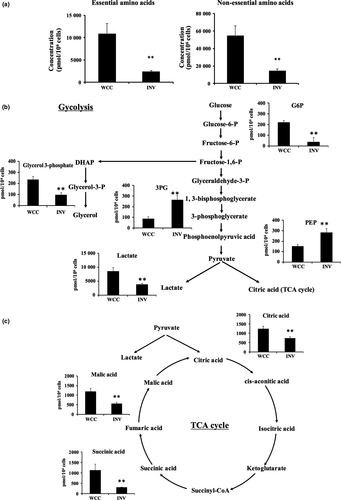
On the other hand, the glycolytic intermediates of the invaded PANC-1 showed both reductions and increases in their concentrations compared with those of whole cultured cells; the level of G6P was reduced in the invaded cells, whereas the downstream metabolites, 3PG and PEP, were both increased (Fig. 2b). In addition, lactate levels were decreased in the invaded cells, suggesting that lactate fermentation is less activated in the invaded cells (Fig. 2b).
For the TCA cycle, citric acid, succinic acid, and malic acid were all reduced in the invaded cells (Fig. 2c); thus, those metabolites may have been used more than they were produced in the invaded cells, or they were simply consumed less in the invaded cells.
Nucleic acid metabolism and the energy charge of PANC-1 invaded cells compared with the whole cultured PANC-1
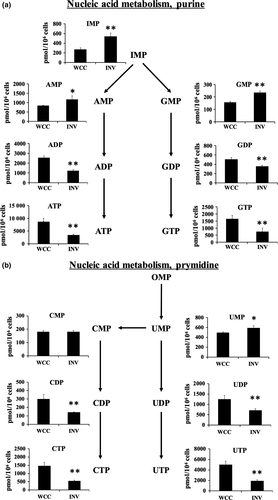
For the nucleic acid metabolism, significantly higher concentrations of nucleoside monophosphates, AMP, GMP, and UMP among other purine or pyrimidine nucleotides, were found in the invaded cells compared with the whole cultured PANC-1 (Fig. 3a,b). In contrast, most of other nucleoside di- or triphosphates, ADP, ATP, GDP, GTP, CDP, CTP, UDP, and UTP, were reduced in invaded cells (Fig. 3a,b).
From the concentrations of adenylate and guanylate nucleotides, the AEC and GEC were calculated using the formula indicated in the Materials and Methods.22 Interestingly, both the AEC and GEC were significantly lower in the invaded cells compared with the whole cultured cells, at 0.69 for the invaded cells and 0.82 for the whole cultured cells, respectively (Table 3), indicating that the invading cells consumed more ATP and GTP. Accordingly, this suggests the ATP-generating pathways were stimulated in the invaded cells, as was indicated in a recent report.22
Arginine metabolism of the PANC-1 invaded cells compared with the whole cultured PANC-1
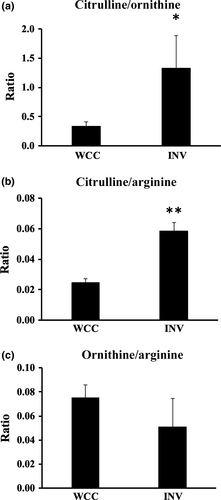
We recently demonstrated that invaded PANC-1 cells exhibited NO production and the NOS-NO-PI3K-AKT2-GIRDIN pathway was activated compared with the whole cultured PANC-1,6 suggesting that the invaded cell population may have a unique metabolic profile relating to NO production. Arginine is a substrate for the NO-producing enzyme, NOS; NOS converts arginine to citrulline with the concomitant production of NO.24 However, arginine is also metabolized to be ornithine via another enzyme, arginase, without the production of NO. Interestingly, the ratio of citrulline to ornithine, an indicator of the consumption of arginine by NOS versus arginase,24 was significantly greater in the invaded PANC-1 compared with the whole cultured cells, at 1.11 and 0.33, respectively (Fig. 4a). In addition, the ratio of citrulline to arginine, reflecting NOS activity,24 was increased in the invaded cells (Fig. 4b), whereas the ratio of ornithine to arginine, indicating the arginase activity,24 showed no significant difference between the invaded cells and the whole cultured cells (Fig. 4c). Thus, in the invaded PANC-1, the utilization of arginine by NOS was more activated than the consumption by arginine, which may be related to our recent findings of higher production of NO in the invaded cells.6
GSH/GSSG ratio for estimating the cellular oxidative stress
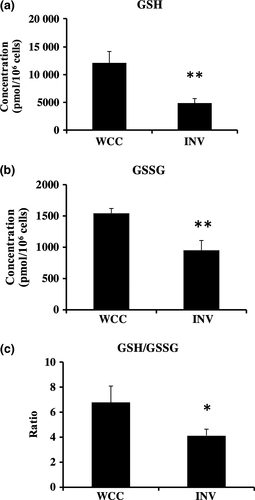
Glutathione is one of the major factors involved in antioxidation.25 Intracellular glutathione usually exists in its reduced form (GSH), and GSH is converted into the oxidized form (GSSG) by stimulation with oxidative stress. When cells are exposed to oxidative stress, GSSG are accumulated, and the ratio of GSH to GSSG will decrease. Therefore, the GSH/GSSG ratio is a useful indicator of oxidative stress in cells and has been used as the index of intracellular oxidative stress.25 We used GSH and GSSG concentrations measured by CE-TOFMS as well as the GSH/GSSG-Glo Assay kit, and calculated the GSH/GSSG ratio shown in Figure 5 and S1, respectively. We found the GSH/GSSG ratio was significantly lower in the invaded cells compared with the whole cultured PANC-1 (Fig. 5, S2). This was also true in the other cell line, SUM149; the GSH/GSSG ratio in invaded SUM149 was lower than that of the whole cultured SUM149 (Fig. S3).
Invaded PANC-1 cells were more resistant to oxidative stress than the whole cultured PANC-1
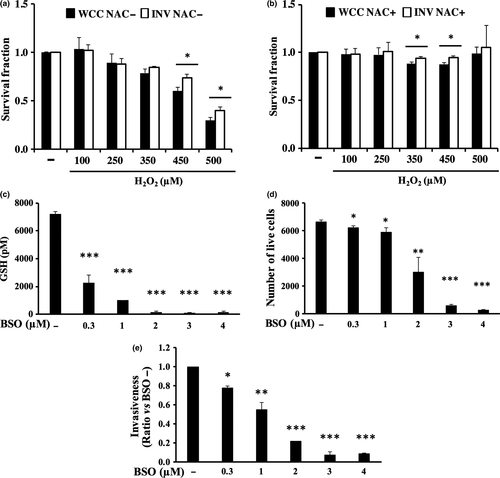
From our results, the GSH/GSSG ratio was significantly lower in the invaded cells compared with the whole cultured cells, indicating that the invaded cells may have experienced higher oxidative stress than the whole cultured cells. Greater production of oxidants results in higher oxidative stress to cells, which then impairs cellular functions.26 Thus, we next compared the sensitivity of invaded or whole cultured PANC-1 cells to oxidative stress by performing the cell surviving assay with the addition of H2O2 to the culture media with or without antioxidant, NAC, treatment. The results showed that the survival fractions of invaded cells after exposure to 450 or 500 μM H2O2 were significantly higher than those of whole cultured cells (Fig. 6a,b), suggested that invaded PANC-1 cells were more resistant to oxidative stress than the whole cultured PANC-1.
Reduction of GSH levels inhibited PANC-1 invasion
So far, the invaded cells are suggested to experience higher oxidative stress but also greater resistance to it. In addition, we showed the invaded cells consumed more amount of GSH than the whole cultured cells in Figure 5(a), indicated that intercellular GSH may have an important role in invaded cells to withstand the higher oxidative stress. De novo GSH synthesis is one of the important factors maintaining the intracellular GSH level.27 Among the enzymes involved in the GSH synthesis, γ-glutamylcysteine synthetase (γ-GCS) is the rate-limiting enzyme. In order to clarify the role of GSH in PANC-1 invasion, we next performed the invasion assay with using an irreversible inhibitor of γ-GCS, L-buthionine-sulfoximine (BSO).28 Treatment of PANC-1 cells with 0.3, 1, 2, 3, or 4 μM BSO for 24 h clearly reduced the intercellular GSH content in a dose-dependent manner (Fig. 6c). Interestingly, although 0.3 μM BSO or 1 μM BSO diminished only 8% or 11% of cell numbers (Fig. 6d), 0.3 μM BSO or 1 μM BSO clearly inhibited PANC-1 invasion; 23%, or 46% reduction, respectively (Fig. 6e). Thus, it is indicated that intracellular GSH has role in PANC-1invasion.
Discussion
In this study, we demonstrated that the metabolic profiles of the invaded PANC-1 cells were distinct from those of the whole cultured PANC-1. In contrast to the whole cultured PANC-1, the invaded PANC-1 cells were characterized as the population with reduced levels of amino acids and TCA cycle intermediates, decreased and increased intermediates in glycolysis, increased consumption of ATP and GTP with assumed activation of ATP or GTP-generating pathways, higher arginine utilization by NOS, and higher oxidative stress but also greater resistance to it.
Among the unique metabolic profiles found in the invaded cells, arginine was metabolized more likely to be citrulline in the invaded cells (Fig. 4), and NOS is required in this process. Interestingly, we already have reported the role of NOS in PANC-1 invasion in the recent study.6 Treatment of PANC-1 with NOS inhibitor diminished the invasiveness, whereas addition of NO donor increased the invasiveness. In fact, NOS-NO-PI3K-AKT2-GIRDIN pathway was activated in the invaded PANC-1. Since GIRDIN is known as an essential factor for actin organization and lamellipodia formation, the invaded cells were thought to have unique characteristics relevant to the invasive phenotype. It is hypothesized that higher activity of NOS required in the invaded cells caused higher arginine conversion to be citrulline, and as a result, the unique profile in arginine metabolism was found in the invaded cells.
A few studies have reported metabolic changes during the progression of metastasis.29, 30 Lu et al. have compared the metabolome of the normal mouse mammary epithelial cell line to those of an isogenic series of cell lines exhibiting higher metastatic potential in vivo.30 They found that the glycolytic intermediates, 3PG, PEP, and pyruvate, were upregulated in the metastatic cell lines, and the GSH/GSSG ratio was decreased,30 just as we also detected increased levels in 3PG and PEP as well as the reduced ratio of GSH/GSSG in the invaded PANC-1 cells. Since invasiveness is one of the more important abilities in metastasizing cells, increased levels of 3PG and PEP and the reduced ratio of GSH/GSSG may be one of the unique metabolic features relevant to the invasive potential. The specific accumulation of 3PG and PEP was observed when cells redirect glycolytic carbon into the serine and glycine biosynthesis pathway.31 Biochemical evidence has indicated that the phosphate group from PEP can be transferred to the histidine residue of phosphoglycerate mutase (PGAM), where phosphorylated PGAM is thought to increase the ratio of 3PG to 2PG; thus, PEP and 3PG in particular are accumulated.31, 32 We have not yet determined the phosphorylation levels of PGAM nor the activity of serine synthesis, but it would be intriguing to further study whether the specific accumulation of 3PG and PEP observed in the invaded PANC-1 were the result of glucose flux directed to serine synthesis or not.31
Consistent with our finding that the PANC-1 invaded cells showed reduced levels of GSH/GSSG, Piskounova et al. also reported that metastatic cells showed lower values for the ratio of GSH/GSSG.33 Piskounova used tumor-bearing mice to compare the metabolites of subcutaneous tumors with those of circulating tumor cells (CTC) or lung-metastasized cells and reported that CTC and metastasized cells were experiencing higher oxidative stress and showing lower GSH/GSSG ratios than those observed in the subcutaneous tumors. The low GSH/GSSG ratio in the invaded cells in our study also indicating that the invaded cells have experienced higher oxidative stress. Recent review has reported that intracellular ROS act to promote cell migration;34 (i) NOX2 is known to form complex with p47phox, Rac1, and PAK1 at the leading edge of the cell, where the complex generate superoxide in the extracellular space; (ii) Superoxide is then converted to be H2O2 and enters into the cytoplasm, where H2O2 oxidizes protein tyrosine phosphatases and enhances cell migration. Therefore, ROS is required for migration in particular cells. However, excess amount of ROS should be eliminated quickly via the cellular anti-oxidant system including GSH, because high levels of ROS is toxic to the cells. Thus, it is hypothesized that invaded cells in our study were required to consume more amount of GSH to overcome the oxidative stress during invasion. Because GSH is converted into GSSG by stimulation with ROS, consuming GSH leads lowering the intracellular GSH levels with accumulating the GSSG levels, resulted in the decreased ratio of GSH/GSSG, as we found in the invaded cells, the cells just reached the undersurface of transwell membrane. De novo GSH synthesis has significant role to maintain the intracellular GSH level.35 Among the enzymes involved in the GSH synthesis, γ-GCS is the rate-limiting enzyme, which catalyze glutamic acid into γ-glutamylcysteine, and of note, this step is feedback-regulated by intracellular GSH level.27 When the invading cells consumed GSH to overcome the oxidative stress during invasion, it made lowering GSH level, which were then hypothesized to activate de novo GSH synthesis via feedback regulation.35 In fact, we found that de novo GSH synthesis had role in PANC-1 invasiveness because the reduction in intracellular GSH with using BSO diminished PANC-1 invasiveness (Fig. 6e). Thus, it is hypothesized that higher ROS was produced in the cells in order to invade, which caused more consumption of GSH to overcome the ROS, leading accumulation of GSSG, which causes the reduction in GSH/GSSG levels, and the cells were required GSH synthesis to overcome the oxidative stress.
Cell movement through ECM involves precise regulation of cell adhesion and de-adhesion to ECM proteins.36-39 Several reports have shown that de-adhesion to ECM is observed during the invasive process, such as in the contractile machinery of amoeboid movement, as well as in the focal adhesion disassembly and detachment of the trailing edge observed in mesenchymal movement.36-40 Interestingly, in epithelial cells, de-adhesion to ECM causes reduced glucose uptake, ATP depletion, and increased oxidative stress, which leads to the programmed cell death, anoikis.41 In contrast, ovarian cancer cells showed increased invasiveness under de-adherant conditions with enhanced mitochondrial oxidative phosphorylation and ATP production; thus, the cells can overcome the energy deficit during the de-adherant conditions.42 In addition, the CTC of 4T1 mammary epithelial cancer cells exhibited enhanced mitochondria biogenesis and respiration,43 suggesting that CTCs overcome the energy deficit by activating mitochondrial respiration. Since hyperactivation of mitochondria was thought to generate higher oxidative stress,29 this suggests the capability to overcome oxidative stress is also the fundamental ability to successfully become invasive. Our findings agree with this idea that the invaded PANC-1 cells were more resistant to oxidative stress compared with the whole cultured PANC-1. In addition, the invading PANC-1 showing low AEC indicated that those cells consume more energy, and accordingly, the ATP-generating pathways are thought to be stimulated, as it was suggested in a recent report.22 Unfortunately, it is unclear whether the invaded cells rely on mitochondrial respiration for ATP generation because pyruvate and acetyl-coA concentrations were failed to be measured; thus, further investigation is required to clarify the mitochondrial involvement in ATP generation, as well as the reactive oxygen generation in the invaded PANC-1 cells.
In this study, we proposed that invaded cells have unique metabolic profiles, especially higher consumption of ATP and GTP, with assumed activation of ATP- or GTP-generating pathways, and higher oxidative stress but with resistance to that stress. It is interesting that this distinct cell population within the identical cell line exhibits such a unique metabolic profile, since the genetic background of the invaded cells and whole cultured cells are identical. Thus, it may be intriguing to study the possible involvement of epigenetics in the regulation of invaded cells. Further efforts should investigate the universality of our findings by analyzing many more cell lines as well as doing in vivo studies.
Acknowledgments
We thank Human Metabolome Technologies., Inc., and Essen BioScience Inc., for the helpful discussions and advice, Yoshimi Shoji for technical help, and Medical English Service for providing English editorial assistance. This work was supported in part by Grant-in-Aid for Scientific Research (C) (grant no. 22461934 to TI) and for Young Scientists (B) (grant no. 15K19833 for MF) from the Japan Society for the Promotion of Science.
Disclosure Statement
The authors declare that they have no competing financial interest.
Abbreviations
-
- 2PG
-
- 2-phoshoglyceric acid
-
- 3PG
-
- 3-phoshoglyceric acid
-
- ADP
-
- adenosine diphosphate
-
- AEC
-
- adenylate energy charge
-
- AMP
-
- adenosine monophosphate
-
- ATP
-
- adenosine triphosphate
-
- BSO
-
- L-buthionine-sulfoximine
-
- CDP
-
- cytidine diphosphate
-
- CE-TOFMS
-
- capillary electrophoresis-time-of-flight mass spectrometry
-
- CTC
-
- circulating tumor cells
-
- CTP
-
- cytidine triphosphate
-
- DMEM
-
- dulbecco's modified Eagle's medium
-
- ECM
-
- extracellular matrix
-
- FCS
-
- fetal calf serum
-
- G6P
-
- glucose-6-phosphate
-
- GDP
-
- guanosine diphosphate
-
- GEC
-
- guanylate energy charge
-
- GIRDIN
-
- girders of actin filament
-
- GMP
-
- guanosine monophosphate
-
- GSH
-
- reduced glutathione
-
- GSSG
-
- oxidized glutathione
-
- GTP
-
- guanosine triphosphate
-
- H2O2
-
- hydrogen peroxide
-
- IMP
-
- inosine monophosphate
-
- INV
-
- invaded cells
-
- NAC
-
- N-acetylcysteine
-
- NO
-
- nitric oxide
-
- NOS
-
- nitric oxide synthase
-
- OMP
-
- orotidine 5'-monophosphate
-
- PCA
-
- principal component analysis
-
- PEP
-
- phosphoenolpyruvic acid
-
- PGAM
-
- phosphoglycerate mutase
-
- TCA cycle
-
- tricarboxylic acid cycle
-
- UDP
-
- uridine monophosphate
-
- UMP
-
- uridine diphosphate
-
- UTP
-
- uridine triphosphate
-
- WCC
-
- whole cultured cells


