Brefeldin A inhibits clathrin-dependent endocytosis and ion transport in Chara internodal cells
Abstract
Background
The Characeae are multicellular green algae, which are closely related to higher plants. Their internodal cells are a convenient model to study membrane transport and organelle interactions.
Results
In this study, we report on the effect of brefeldin A (BFA), an inhibitor of vesicle trafficking, on internodal cells of Chara australis. BFA induced the commonly observed agglomeration of Golgi bodies and trans Golgi network into ‘brefeldin compartments’ at concentrations between 6 and 500 μM and within 30–120 min treatment. In contrast to most other cells, however, BFA inhibited endocytosis and significantly decreased the number of clathrin-coated pits and clathrin-coated vesicles at the plasma membrane. BFA did not inhibit secretion of organelles at wounds induced by puncturing or local light damage but prevented the formation of cellulosic wound walls probably because of insufficient membrane recycling. We also found that BFA inhibited the formation of alkaline and acid regions along the cell surface (‘pH banding pattern’) which facilitates carbon uptake required for photosynthesis; we hypothesise that this is due to insufficient recycling of ion transporters. During long-term treatments over several days, BFA delayed the formation of complex 3D plasma membranes (charasomes). Interestingly, BFA had no detectable effect on clathrin-dependent charasome degradation. Protein sequence analysis suggests that the peculiar effects of BFA in Chara internodal cells are due to a mutation in the guanine-nucleotide exchange factor GNOM required for recruitment of membrane coats via activation of ADP-ribosylation factor proteins.
Conclusions and Significance
This work provides an overview on the effects of BFA on different processes in C. australis. It revealed similarities but also distinct differences in vesicle trafficking between higher plant and algal cells. It shows that characean internodal cells are a promising model to study interactions between seemingly distant metabolic pathways.
Abbreviations
-
- AFW
-
- artificial fresh water
-
- ARF
-
- ADP-ribosylation factor
-
- BCECF
-
- 2′,7′-bis-(carboxyethyl)-5-carboxyfluorescein
-
- BFA
-
- brefeldin A
-
- GEF
-
- guanine-nucleotide exchange factor
-
- TGN
-
- trans-Golgi network
Introduction
Much of our knowledge about cellular organisation and dynamics of organelles has been derived from studies using (more or less) specific inhibitors. Among them, brefeldin A (BFA) has been and still is widely used to investigate vesicle trafficking in animal, fungal and plant cells. The macrocyclic lactone is produced by various fungi [Wang et al., 2002] and causes leaf spot disease in, for instance, safflower (Carthamustinctorius L.) [Tietjen et al., 1985].
The target of BFA is the SEC7 region of guanine-nucleotide exchange factors (GEF) which activates ARF (ADP-ribosylation factor) proteins [Chardin and McCormick, 1999; Jackson and Casanova, 2000]. ARFs are small GTPases involved in the recruitment of membrane coats required for cargo sorting and for the release (budding) of vesicles [Donaldson and Jackson, 2000; Jackson and Casanova, 2000; Yorimitsu et al., 2014; Singh and Jürgens, 2018]. The main target of BFA in Arabidopsis thaliana is the ARF GEF GNOM which is required for the proper polar localisation of the auxin transporter PIN1 [Steinmann et al., 1999]. Arabidopsis also possesses a BFA-insensitive ARF GEF, known as GNOMLIKE 1 (GNL1) [Richter et al., 2007; Teh and Moore, 2007; Naramoto et al., 2014]. Both ARFs (GNOM and GNL1) localise to Golgi bodies although at distinct regions [Naramoto et al., 2014] where they are involved in the formation of COPI vesicles [Singh and Jürgens, 2018]. A mutation in Arabidopis GNOM causes perturbation of endocytosis [Naramoto et al., 2010] and in tobacco, NtGNL1a is BFA sensitive [Jelinkova et al., 2015].
The effect of BFA in plant cells is concentration, species and tissue dependent [Robinson et al., 2008; Jasik and Schmelzer, 2014]. In most plant cells investigated so far, BFA inhibits exocytosis and vacuolar protein transport [e.g. Naramoto et al., 2010], whereas endocytosis is much less affected [Nebenführ et al., 2002; Jasik et al., 2016; Paponov et al., 2019]. In pollen tubes, endocytosis is significantly enhanced by BFA [e.g. Emans et al., 2002;Wang et al., 2005], whereas in BY2 cells, BFA has been reported to arrest endocytosis [Jelinkova et al., 2015].
A common feature of BFA treatment, however, is the formation of BFA compartments or BFA bodies consisting of agglomerations of Golgi bodies and/or trans-Golgi network (TGN), or of their remnants, respectively [Satiat-Jeunemaitre and Hawes, 1992; Satiat-Jeunemaitre et al., 1996; SaintJore et al., 2002; Grebe et al., 2003; Dettmer et al., 2006; Lam et al., 2009; Langhans et al., 2011; Uemura et al., 2014]. Golgi stacks may also fuse with the endoplasmic reticulum with corresponding redistribution of proteins [e.g. Satiat-Jeunemaitre et al., 1996; Geldner et al., 2003]. Redistribution of Golgi protein GNOM to the TGN upon BFA treatment has also been reported [Naramoto et al., 2014]. The action of BFA is reversible and a recent study showed that Golgi and TGN recover independently of each other [Ito et al., 2017].
In the present study, we describe the effect of BFA in the characean green alga, C. australis, a member of the Streptophyta, and therefore closely related to higher plants [Nishiyama et al., 2018 and references therein]. Their huge internodes are important model cells for the study of membrane transport and photosynthesis [Beilby and Casanova, 2014; Beilby, 2016]. They are also excellently suited for in vivo imaging; secretory vesicles are large enough to be visualised with bright field optics [Foissner et al., 1996], and the possibility to induce different types of wounds [Foissner and Wasteneys, 2012; Foissner and Wasteneys, 2014] make them an interesting system to study various aspects of vesicle trafficking, secretion and membrane recycling. Vesicle trafficking, exocytosis and endocytosis are also involved in the formation of complex 3D membrane invaginations, charasomes, which harbour numerous H+ ATPases [Schmoelzer et al., 2011;Pertl-Obermeyer et al., 2018]. These transporters are required for the acidification of the medium that facilitates uptake of carbon required for photosynthesis [reviewed by Beilby and Casanova, 2014]. Along the cell surface the acid regions (H+ efflux) alternate with alkaline bands (probably OH− influx) in order to maintain homoeostasis of cytosolic pH and this pH banding pattern correlates with regions of high and low photosynthesis, respectively [Plieth et al., 1994; Bulychev and Vredenberg, 2003 and references therein]. Previously, we investigated the participation of Chara RAB GTPases ARA6 and ARA7 in exo- and endocytosis [Hoepflinger et al., 2013; 2015] and studied the effect of wortmannin, an inhibitor of PIP3 and PIP4 kinases [Foissner et al., 2016]. This work revealed similarities but also distinct differences in vesicle trafficking between higher plant and algal cells. Here, we show that BFA at concentrations between 6 and 500 μM induced the accumulation of Golgi and TGN into BFA compartments within 30–120 min treatment, whereas the secretion of wound walls was not affected. More interestingly, however, BFA immediately and significantly decreased the number of coated pits and coated vesicles at the plasma membrane, which resulted in the complete arrest of endocytosis. This suggests that BFA-sensitive proteins are located not only at the Golgi but also at the plasma membrane, where they are probably involved in the formation of clathrin coats required for endocytosis. The concomitant inhibition of the pH banding pattern by BFA is interpreted as a consequence of endocytosis arrest.
Results
BFA inhibits internalisation of FM dyes and induces the formation of BFA compartments
The effect of BFA on the abundance and morphology of organelles involved in endocytosis was investigated with the fluorescent styryl dye FM 1–43, which allows studying membrane trafficking of selected organelles also in characean internodes that are so far refractory to genetic manipulation.
In order to get an undisturbed view into the endoplasm, we created chloroplast-free windows by irradiation with intense blue light at least one day prior to the experiments (Figure 1A; see Materials and methods). Within the window, numerous fluorescent organelles could be observed in control cells after pulse labelling with FM1-43 for 2 min (Figure 1B). Surprisingly, only few organelles were present in cells treated with 6 μM BFA, especially when the staining solution was already supplemented with the inhibitor (Figure 1C). FM-stained organelles were completely absent in cells treated with 100 μM BFA (Figure 1D), suggesting that BFA inhibits endocytosis in Chara internodal cells.
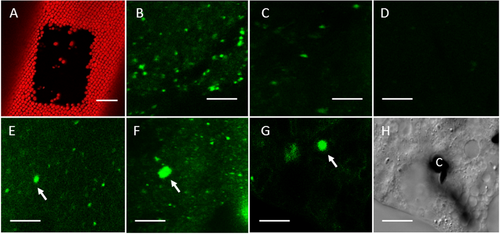
Effect of BFA on FM1-43-internalisation
(A) FM-uptake was studied in chloroplast-free areas (image shows the autofluorescence of stationary chloroplasts). (B) FM1-43-fluorescent organelles in a cell pulse labelled with FM1-43 for 2 min and incubated in control medium for 30 min. (C) and (D) Endoplasm of cells treated with 6 μM BFA (C) and with 100 μM BFA (D) for 30 min after pulse labelling with BFA containing FM1-43 solution. (E–H) FM1-43-stained organelles in cells incubated in control medium for 15 min after pulse labelling and then treated with 100 μM BFA for 30 min (E), with 100 μM BFA for 2 h (F) and in a cytoplasmic droplet obtained from a cell treated with 500 μM BFA for 30 min (G; H is the corresponding differential interference contrast image; C, chloroplast). Putative BFA compartments are indicated by arrows. Bars are 50 μm (A) and 10 μm (B-H).
The typical effect of BFA is the aggregation of Golgi bodies and TGN into BFA compartments or BFA bodies. Because of the inhibitory effect of BFA on FM internalisation in Chara internodal cells, enlarged fluorescent organelles became visible only when FM1-43-stained cells were incubated in control medium for several minutes before BFA treatment (Figures 1E–1H). Apparently, during this time the styryl dye distributed from the plasma membrane to the TGN, which is a major component of BFA compartments (see electron microscopy), and hence made the BFA bodies visible both in the flowing endoplasm (Figures 1E and F) and in cytoplasmic droplets squeezed out from internodal cells (Figures 1G and 1H).
In order to quantify these findings, we produced time series and calculated the number and area (size) of FM-fluorescent organelles in each frame. The diagrams in Figure 2 were obtained from cells that were stained with FM1-43 dissolved in artificial fresh water (AFW; controls) or in BFA containing medium, respectively. After 2 min of pulse labelling, cells were further incubated in dye-free AFW or BFA medium for 30 min. Figure 2A shows that treatment of cells with 100 μM BFA caused a significant reduction in the number and total area of FM1-43-stained organelles per 10,000 μm2 endoplasm. At a concentration of 6 μM, the number of FM-fluorescent organelles was not affected but the total area increased due to the formation of BFA compartments, which is reflected by the significant increase in the mean and maximal area of organelles per video frame (Figure 2B). Electron microscopy confirmed that BFA compartments formed also at higher concentrations (e.g. Figure 3B). These BFA compartments were rarely detected in the confocal laser scanning microscope and had a smaller size because of insufficient FM internalisation (see Figures 1E–1G).

Effect of BFA on number and area of organelles stained by FM1-43
(A) Total number and total area (size) of FM-stained organelles per 10,000 μm2 endoplasm. (B) Mean and maximal area (size) of FM-stained organelles per video image. Cells were pulse labelled with FM1-43 dissolved in AFW (controls) or in BFA medium, respectively and incubated in dye-free AFW or BFA for 30 min. Area and number of fluorescent organelles were analysed using ImageJ. Data are means ± SD obtained from at least 216 frames per experiment. All means between control and BFA-treated cells are significantly different (P ≤ 0.01, two-tailed t-test).
The inhibitory effect of BFA on FM internalisation was even more pronounced when cells were treated with BFA 10 min before pulse labelling and further incubated in BFA for 30 min. In this case, a significant inhibition of endocytosis was noted already at 6 μM BFA (Supplementary Figure 1).
The formation of BFA bodies was reversible within 2 h in the concentration range between 6 and 100 μM (not shown but compare Figure 4).
BFA inhibits formation of clathrin coats
We next applied electron microscopy in order to get more insight into the inhibitory effect of BFA on endocytosis and on the formation of BFA bodies. In characean internodal cells, Golgi bodies, TGN, mitochondria, nuclei and multivesicular bodies are mostly present in the streaming endoplasm, whereas the cortical cytoplasm is dominated by files of stationary chloroplasts [Foissner and Wasteneys, 2014]. Figures 3A–3C show the fine structure of organelles relevant for this study in control cells. After chemical fixation, the TGN (Figures 3A and 3B) can easily be distinguished from the Golgi body by its reticulate shape and the presence of clathrin-coated regions (arrow head in Figure 3B). Clathrin-coated pits involved in endocytosis preferentially detach from the smooth plasma membrane regions located between the charasomes (Figure 3C) [compare Hoepflinger et al., 2017].
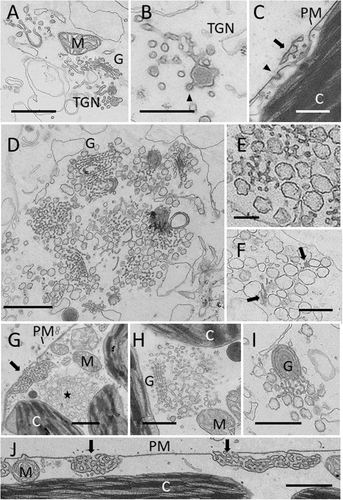
Fine structure of control internodal cells of Chara australis (A–C) and of BFA-treated cells (D–J)
(A) Golgi body (G), TGN and mitochondrion (M) in the endoplasm. (B) Detail of TGN; arrow head indicates coated region. (C) Coated pit (arrow head) at the smooth part of the plasma membrane (PM), the arrow indicates a charasome (C, chloroplast). (D) Typical BFA compartment with Golgi bodies surrounding a central core of reticulate cisternae and vesicles. (E) Detail of the central core which has a TGN-like appearance but lacks membrane coats. (F) Cluster of vesicles in the endoplasm. Note putative Golgi remnants (arrows). (G) Cluster of vesicles in the cortical cytoplasm; the arrow indicates a charasome. Panel H shows a single Golgi body with blown up trans side or TGN (uncoated) and (I) shows a Golgi body with curved cisternae. (J) Coated pits and coated vesicles are absent from the plasma membrane of BFA-treated cells (arrows indicate charasomes). Internodal cells were treated with 200 μM BFA for 30 min (D, E, I) and for 2 h (F–H, J) before fixation (see Materials and methods for further information). Bars are 1 μm (A, D, G, I, J), 500 nm (B, C, E, F, H).
Treatment of cells with BFA prior to fixation affected the morphology and distribution of Golgi bodies and TGN (Figures 3D–3I) and inhibited the formation of membrane coats at the TGN (Figure 3E) and the plasma membrane (Figure 3J). Typical BFA compartments were found in the endoplasm. They consisted of Golgi bodies surrounding a core of vesicles and reticulate membranes reminiscent of the TGN, but without conspicuous membrane coats (Figures 3D and 3E). Clusters of vesicles were present in the endoplasm and between the cortical chloroplasts (Figures 3F and 3G). Some of them contained flattened cisternae, reminiscent of Golgi cisternae (Figure 3F, arrows). Single Golgi bodies were still observed apart from the BFA bodies (Figures 3H and 3I). Their trans-side or their associated TGN was sometimes enlarged (Figure 3H), other Golgi bodies had curved cisternae (Figure 3I). We cannot exclude, however, that these ‘single’ Golgi bodies were situated at the periphery of BFA compartments.
A conspicuous feature of BFA-treated internodal cells was the low number of clathrin-coated pits and vesicles at the plasma membrane (compare Figure 3J). The statistical analysis of electron microscopic sections of cells treated with 200 μM BFA for 30 min (Figure 4) and for 2 h (not shown) revealed a significant decrease in the mean number of coated pits and coated vesicles per 100 μm plasma membrane (Figure 4). This effect was reversible and the relative number of coated vesicles and coated pits significantly increased again when cells were allowed to recover in control solution for 2 h.
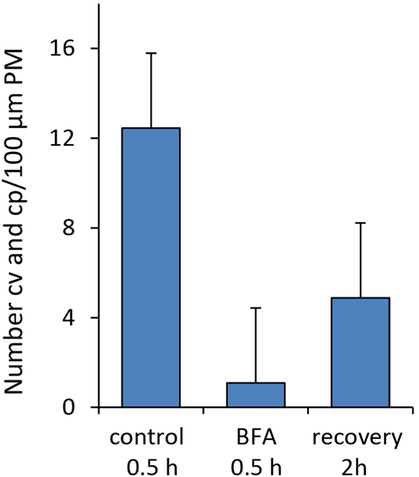
Effect of 200 μM BFA on the number of coated pits (cp) and coated vesicles (cv) at the plasma membrane (PM)
Control and recovering cells were treated with 1% DMSO. Data are means ± SD; means of BFA treated and controls or recovery are significantly different (two-tailed t-test P≤0.02).
BFA inhibits pH banding and affects the cytoplasmic pH
Characean internodal cells develop alternating regions of acid and alkaline pH at their surface when exposed to light [Beilby and Bisson, 2012 for review]. The pH banding pattern can be visualised with the aid of pH indicating phenol red or fluorescent dyes [Absolonova et al., 2018] or with the more accurate and immediate method of using ion-sensitive electrodes to map the pH at the cell surface [Bulychev et al., 2001]. Figure 5A shows the concentration dependent inhibitory effect of BFA on the formation of alkaline bands visualised by phenol red which is due to the decrease in alkaline surface pH (Figure 5B). A prerequisite for pH banding is cytoplasmic streaming and photosynthesis. The velocity of cytoplasmic streaming was not affected by BFA (Figure 5C), and photosynthesis-related parameter, chlorophyll fluorescence F’ (Figure 5D) at light intensities sufficient for pH banding returned to normal level after a series of oscillations. The rate of linear electron transport, which is proportional to the quantum yield of PSII electron flow in chloroplasts, was also insensitive to BFA in the absence of banding at low-intensity continuous light (Supplementary Figure 2). These data suggest a more direct effect of BFA on pH banding.
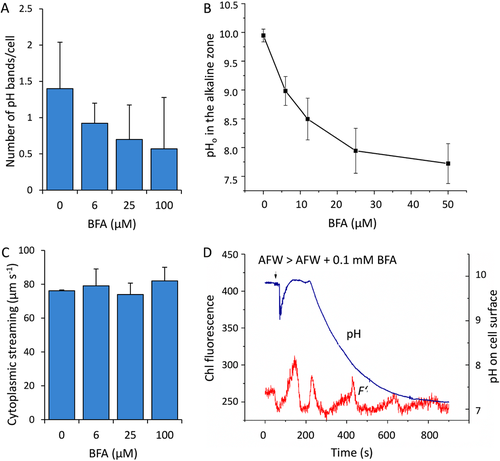
Effect of BFA concentration on pH banding, cytoplasmic streaming and photosynthetic activity in internodal cells
(A) Effect of BFA on number of pH bands counted in phenol red and (B) on local pH in the alkaline zone measured with a pH electrode after 30 min incubation in the absence or in the presence of BFA. (C) Velocity of cytoplasmic streaming before and 30 min after addition of BFA. (D) Time course of pH change and the influence of BFA on chlorophyll fluorescence F’ after application of 100 μM BFA measured at photon flux density of 78 μmol m−2 s−1. Data are means ± SD (A, C) and means ± SEM (B); means of control and BFA-treated cells in A are significantly different (two tailed t-test; P ≤ 0.05).
It has been suggested that inhibition of clathrin-mediated endocytosis by uncouplers is due to cytoplasmic acidification [Dejonghe et al., 2016]. In order to exclude an unspecific effect of BFA, we measured pHcyt in the cortical cytoplasm of control cells and of BFA-treated cells microinjected with fluorescent 2′,7′-bis-(carboxyethyl)-5-carboxyfluorescein (BCECF). In control cells (n = 12), the cytoplasmic pH varied along the cell length and the measured values were most frequently situated around pH 7.5 (Figure 6). However, local extreme values of pH 8–8.5 were found in some cells. So far, it is not clear whether this variability correlated with the pH banding pattern at the cell surface. The effect of BFA, however, was similar in all of the five cells investigated. The pH became considerably more uniform and the values dropped up to 0.5 pH units but were rarely much lower than pH 7. This finding is illustrated by the two cells in Figure 6. In control conditions, the values of the cytoplasmic pH varied locally between pH 7.15 ± 0.05 and 7.51 ± 0.22 in the left cell and from pH 7.09 ± 0.09 to pH 7.75 ± 0.26 in the right cell (see grey bars). After incubating the cells with 200 μM BFA for 40 min, the pHcyt decreased and the spatial inhomogeneity was abolished (notice the red bars). In the left cell, the values were situated between 6.90 ± 0.04 and 6.95 ± 0.05, whereas in the right cell, the cytoplasmic pH dropped to levels from 6.79 ± 0.09 to 6.99 ± 0.09. The observed decrease is thus far below that expected to be responsible for the inhibition of endocytosis (pH < 6.5) [Dejonghe et al., 2016]. Therefore, it is unlikely that BFA inhibits endocytosis via acidification of the cytoplasm.
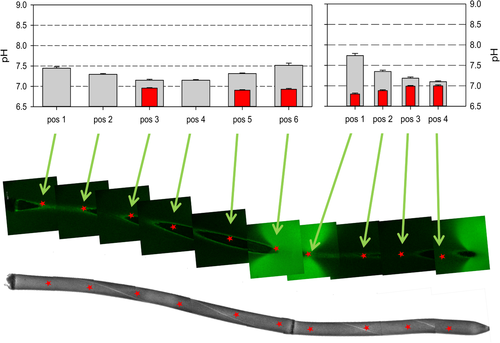
Effect of BFA on cytoplasmic pH
The bright field image (below) shows two adjacent branchlet internodal cells microinjected with BCECF, a fluorescent indicator for cytoplasmic pH. The white stripes are the chloroplast free neutral lines, which separate up and downstreaming endoplasm; measured regions are indicated by red stars. The fluorescence image (middle) shows the location of alkaline bands (bright green) along the surface of the cells incubated in medium supplemented with 10 μM pH indicator FITC-dextran prior to addition of BFA. The graphs indicate the cytoplasmic pH before (grey bars) and after 40 min treatment with 200 μM BFA (red bars). Missing data are due to the inability to focus into the cytoplasm.
BFA does not affect secretion in Chara but inhibits the deposition of a cellulosic cell wall
We next examined the effect of BFA on wounding-induced exocytosis. In Chara, two types of wound walls can be distinguished depending on the type and extent of wounding [Foissner and Wasteneys, 2012].
First, we studied wound healing after local irradiation with intense light, which – after the release of chloroplasts - causes the massive deposition of vesicles and other organelles in the absence of endocytosis. The resulting ‘amorphous wound walls’ therefore include not only the contents of vesicles and other organelles but also their membranes (Figures 7A and 7B). Only in the final stage of wound healing (after 2 h in this experiment), a continuous plasma membrane is formed by fusion (exocytosis) of individual secretory vesicles and surplus membrane is recycled via coated pits and vesicles (Figure 7B) [Foissner and Wasteneys, 2012 and references therein]. In BFA-treated cells, neither the deposition of the amorphous wound wall nor the regeneration of a continuous plasma membrane was inhibited (Figure 7C). The area of the wound wall approximately corresponded to the area of local irradiation both in control and BFA-treated cells (202 ± 16 versus 198 ± 22 μm2; n = 5 cells for each treatment). However, coated pits and coated vesicles were not observed indicating that BFA inhibited the formation of clathrin coats at the plasma membrane (Figure 7D).
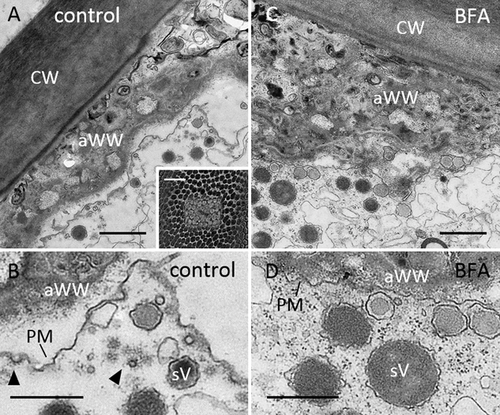
Effect of BFA on healing of wound walls induced by local irradiation with intense light
Cells were fixed for electron microscopy 2 h after wounding. (A, B) An amorphous wound wall (aWW) has been deposited beneath the cell wall (CW) of an untreated internodal cell. The bright field image in the inset shows bleached chloroplasts in the irradiated region. The higher magnification B shows numerous coated vesicles and coated pits (arrow heads) pinching off the plasma membrane (PM) beneath the wound wall. sV, secretory vesicles. (C, D) BFA does not inhibit the deposition of an amorphous wound wall but membrane recycling is arrested (note absence of coated pits and coated vesicles in D). Bars are 10 μm (inset in A), 1 μm (A and C), 500 nm (B and D).
The effect of BFA on the secretion of fibrillar wound walls was studied in mechanically injured cells (n = 5 cells for each condition). After puncturing the cell with a fine needle, the cell wall hole became first sealed by a plug consisting of vacuolar components and cytoplasmic residues. This plug was then covered by an amorphous layer, onto which a thick fibrillar layer was secreted in control cells (Figures 8A–8C). Fibrillar wound walls are devoid of membranes and contain crystalline cellulose, just as the normal cell wall (Figures 8C and 8D). They are formed via exocytosis of secretory vesicles which is linked with membrane recycling [for references see Anderson and Kieber 2020]. The discharged content of the secretory vesicles provides the matrix of the cell wall and the vesicle membrane delivers the cellulose synthase (CesA) complexes. These complexes use cytoplasmic UDP-glucose to produce cellulose fibrils extending into the apoplast (extracellular matrix). The CesA complexes have an estimated residence time of less than 6 min [Sampathkumar et al. 2013] and must be continuously recycled via coated vesicles (Figure 8D) [compare Foissner and Wasteneys, 2012; Anderson and Kieber 2020]. In BFA-treated cells, a thick amorphous wound wall was secreted after puncturing (Figures 8E–8H). The plasma membrane beneath the amorphous wound wall was devoid of coated pits and coated vesicles and no fibrillar layer was deposited (Figure 8H).
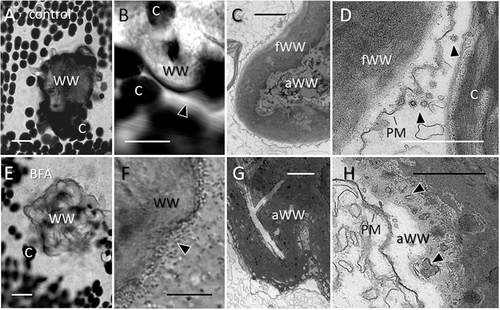
Effect of BFA on healing of puncture wounds
The upper panel shows healed puncture wounds in control cells and the lower panel shows puncture wounds in cells treated with 150 μM BFA. (A, B) A wound wall (WW) has been deposited beneath the cell wall hole and around damaged chloroplasts (C). Cytoplasmic streaming has been regenerated (arrow head in B indicate streaks of fast-moving organelles). (C, D) The inner amorphous wound wall (aWW) is covered by a membrane-free fibrillar wound wall (fWW) in control cells. Note numerous coated vesicles (arrow heads) at the plasma membrane (PM; D). (E, F) BFA does not inhibit wound healing but cytoplasmic streaming is still disturbed (arrow head in F shows secretory vesicles performing saltatory movements at the wound wall. (G, H) Electron microscopy reveals that the amorphous wound wall in the BFA-treated cell is not covered by a fibrillar layer because of disturbed membrane recycling. Note absence of coated vesicles at the plasma membrane (PM) and membrane residues within the amorphous wound wall (arrow heads in H). The bright field images were taken 2 h after wounding (A, B and E, F) and the electron micrographs are from cells fixed 30 min after wounding (C, D and G, H). Bars are 20 μm (A, E), 10 μm (B, F), 2 μm (C, G) and 1 μm (D, H).
In untreated cells, the thickness of the fibrillar wound wall varied between 1 and 5 μm even at the same puncture wound which makes it difficult to carry out a precise quantification. However, in BFA-treated cells, we never detected a continuous membrane-free layer which is sufficient for evidencing a significant difference.
A prerequisite for the deposition of wound walls is the transient reorganisation of actin filament bundles into an actin filament meshwork supporting saltatory movements of organelles towards and away from the wound [Foissner et al., 1996]. In controls, parallel actin bundles and continuous cytoplasmic streaming usually recovered within one hour (Figure 8B; arrowhead indicates streaks of fast-moving organelles). In BFA-treated cells, secretory vesicles still performed saltatory movements (Figure 8F) indicating delayed regeneration of continuous actin filament bundles.
BFA interferes with charasome formation but has no effect on charasome degradation
The plasma membrane beneath the acid regions of Chara internodal cells is convoluted into complex 3D domains presumably in order to accommodate H+ ATPases required for proton transport to the extracellular space. The light-dependent formation of these ‘charasomes’ requires targeted exocytosis of TGN vesicles and local inhibition of endocytosis [Franceschi and Lucas, 1982; Hoepflinger et al., 2017]. Dark incubation of cells causes their degradation [Bisson et al., 1991] and involves membrane retrieval via coated vesicles [Hoepflinger et al., 2017].
For our experiments on charasome formation, we used cells previously incubated in darkness for 11 days, and which therefore had a mostly smooth plasma membrane. These cells were then exposed to light for 8 days in the absence or presence of BFA. After recording the pH banding pattern with phenol red cells were stained with FM1-43 and examined in the confocal laser scanning microscope for the presence of charasomes (see inset in Figure 9A). In the experiment illustrated in Figure 9A, about 30% of the cells died in 1.5 μM BFA after 8 days. The charasomes in the surviving cells were smaller and less abundant than in controls and the maximal charasome area fraction (% of charasomes occupying the cell surface) per cell was significantly lower although distinct pH banding patterns, which favour charasome formation [Schmoelzer et al., 2011; Absolonova et al., 2018], were similar to that in control cells at the end of the experiment (0.82 ± 0.88 versus 0.96 ± 0.74 alkaline bands/cell).
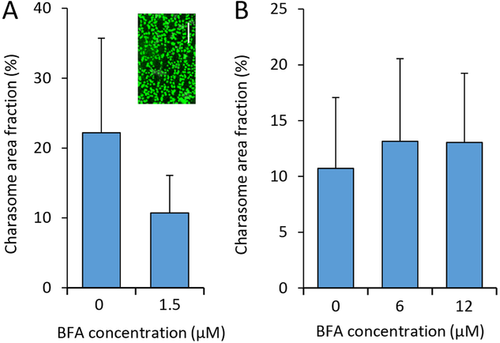
Effect of BFA on charasome formation and degradation
(A) Charasome formation is significantly inhibited at 1.5 μM BFA (two-tailed t-test, P = 0.027). (B) Charasome degradation is not affected by BFA. Area and number of charasomes were measured in cells stained with fluorescent FM1-43FX (see inset in A; bar is 10 μm). Maximal charasome area fractions per cell (% of surface area occupied by charasomes) were obtained from at least 13 internodes per experiment. Data represent means ± SD.
The effect of BFA on charasome degradation was studied in cells previously exposed to normal light dark regime and light intensity. The mortality rate of cells exposed to 12 μM BFA was about 35% and the maximal charasome area fraction per cell in the surviving internodes varied between 25 and 30% (not shown). After dark incubation for 11 days, the mean and median values decreased to about 10% in both control cells and in cells treated with 6 or 12 μM BFA (Figure 9B). Thus, BFA had no significant effect on charasome degradation.
These experiments also showed that long-term treatment with BFA was quite harmful to cells, although toxic concentrations varied between culture batches. Furthermore, BFA seemed to be more toxic in cells exposed to light than in dark-treated cells.
Possible target proteins of BFA in Chara
Unfortunately, the genome of C. australis is not sequenced yet. Thus, we decided to have a look at the closest relative, C. braunii [Nishiyama et al., 2018].
In A. thaliana, the ARF GEF GNOM is the main target of BFA, whereas the related GNL1 is not affected by BFA [Richter et al., 2007]. We therefore used two sequences from A. thaliana (AtGNOM, At1g13980 and AtGNL1, At5g39500) to screen for homologous proteins in the Chara braunii genome [Nishiyama et al., 2018]. According to protein sequence alignments (BLAST), the C. braunii protein CbGNOM showed 61% homology to AtGNOM and 49% to AtGNL1, whereas the other two C. braunii proteins revealed homologies in the range of 25–30%. Among themselves, the C. braunii sequences showed only a 20–33% homology. Data are summarised in Supplementary Table 1.
In order to detect important domains within the three C. braunii proteins, Interpro analyses were performed and a protein sequence alignment of AtGNOM, NtGNL1a and CbGNOM was used to display the locations of conserved regions (Supplementary Figure 3). As expected, the proteins revealed an N-terminal GEF domain (IPR032691) as well as a Sec7 domain (IPR000904). The position of the BFA-sensitive region was marked according to Jelinkova et al. (2015). This region spans 23 amino acids within the Sec7 domain (compare Supplementary Figure 3). BFA sensitive proteins show a serine at position 5 of this region and a methionine at position 8 (Figure 10). If the serine is exchanged to alanine (S5>A) or the methionine to leucine (M8>L), the proteins are described to be BFA resistant [Jelinkova et al., 2015].
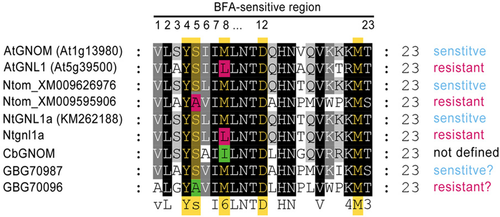
Multiple protein sequence alignment of BFA-sensitive regions within the Sec7 domain of different proteins
Proteins described in Jelinkova et al. (2015): Arabidopsis thaliana: AtGNOM (At1g13980), AtGNL1 (At5g38500); Nicotiana tomentosiformis: Ntom_XM009626976, Ntom_XM009595906; Nicotiana tabacum: NtGNL1a (KM262188) and Ntgnl1a. Chara braunii proteins: CbGNOM (GBG74811), GBG70987 and GBG70096. Amino acids described to be involved in the function of BFA sensitivity/resistance are highlighted in yellow; amino acids mediating BFA-sensitivity are marked in green and amino acids mediating BFA resistance are marked in red.
C. braunii CbGNOM, GBG70987 and GBG70096 were screened for similar regions. As shown in Figure 10, all three proteins have highly homologous BFA-sensitive regions. GBG70987 shows a serine at position 5 as well as a methionine at position 8 and can therefore be assumed to be BFA sensitive. On the other hand, GBG70096 shows an alanine at position 5 and a methionine at position 8. When compared with the sequence analyses of Jelinkova et al. (2015), this could point to a BFA-resistant protein function. Interestingly, CbGNOM shows a serine at position 5 and an isoleucine at position 8.
Discussion
BFA is an effective inhibitor of clathrin coat formation in Chara
In Chara internodal cells, BFA immediately and nearly completely arrested FM internalisation in a wide concentration range between 6 and 500 μM in contrast to most higher plant cells where BFA was reported to have no or even a stimulating effect on endocytosis in a concentration-dependent manner (see Introduction). So far, only clathrin-dependent endocytosis has been convincingly documented for Chara [Hoepflinger et al., 2017]. In control cells, clathrin-coated pits and clathrin-coated vesicles were frequently found at the plasma membrane, whereas treatment of cells with BFA significantly and reversibly decreased their number. In addition, BFA nearly completely arrested the formation of coated pits and coated vesicles at healing wounds thereby preventing the deposition of a membrane-free cellulosic wound wall. These data show that BFA had a severe inhibitory effect on clathrin-dependent constitutive and wounding-induced endocytosis in Chara internodal cells. BFA was much more effective than the endocytosis inhibitor ikarugamycin, which never completely arrested internalisation of FM dyes [Hoepflinger et al., 2017]. Ikarugamycin-treated cells were still able to produce coated pits but the release of clathrin-coated vesicles was inhibited [Hoepflinger et al., 2017]. The low abundance of coated pits in BFA-treated internodal cells indicates that BFA interfered with an earlier stage of endocytosis, that is the assembly of a clathrin coat.
BFA not only significantly decreased the number of coated pits and coated vesicles at the PM, but also at (remnants of) the TGN [compare e.g. Satiat-Jeunemaitre et al., 1996; Robinson et al., 1997; Grebe et al., 2003]. Interestingly, wortmannin, an inhibitor of phosphatidylinositol-3 (PI3) and phosphatidylinositol-4 (PI4) kinases, had a similar effect on the TGN clathrin coat but this is most likely due to the decrease in PI4P level [Foissner et al., 2016]. Mutants that decrease PI4P levels at the TGN were found to slow, or uncouple coat assembly via interference with clathrin adaptor proteins [Daboussi et al., 2012]. In contrast to BFA, however, wortmannin neither interfered with the formation of coated vesicles at the plasma membrane nor reduced endocytosis [Foissner et al., 2016].
The rapid, nearly immediate inhibition of FM-internalisation and clathrin coat formation at both the plasma membrane and the TGN in Chara indicates that a BFA-sensitive protein is present at the Golgi/TGN and at the plasma membrane. In A. thaliana, the BFA-sensitive AtGNOM is present at the Golgi bodies [Naramoto et al., 2014] but has also been reported to localise at the plasma membrane where it colocalises with clathrin [Naramoto et al., 2010]. Similarly, the FM4-64 fluorescence from the plasma membrane disappeared more slowly in the presence of BFA when GNOM was BFA sensitive than when it was BFA resistant [Naramoto et al., 2010]. It has also been found that BFA significantly reduced the density of clathrin-coated pits at the plasma membrane of Arabidopsis root epidermal cells [Ito et al., 2012]. Severe inhibition of endocytosis by BFA has been reported from tobacco BY-2 cells due to a BFA-sensitive NtGNL1a [Jelinkova et al., 2015].
In spite of the BFA-induced inhibition of endocytosis, Chara internodal cells formed typical BFA compartments mainly consisting of Golgi bodies and TGN. This indicates that the BFA compartments are agglomerations of existing organelles and that endocytosis does not substantially contribute to their growth unlike suggested for higher plant cells [e.g. Grebe et al., 2003; Viotti et al. 2010].
The formation of BFA bodies and the related decrease in organelle number and membrane surface are probably responsible for the accelerating effect of BFA on long-distance interaction between chloroplasts [Bulychev et al., 2018; Bulychev and Foissner, 2020].
The effect of BFA was also investigated in other streptophyte algae. Changes in the morphology and number of Golgi bodies has been commonly observed as well as inhibition of cell wall secretion and cell growth [e.g. Salomon and Meindl, 1996; Domozych et al., 2009; Domozych et al., 2020 and references therein]. In the flagellate Mesostigmaviride, BFA affected the number and size of contractile vacuoles, suggesting disturbed membrane recycling [Komsic-Buchmann et al., 2015]. However, the number of clathrin-coated pits and clathrin-coated vesicles associated with the contractile vacuoles was not reduced. So far, inhibition of clathrin coat formation at the plasma membrane and endocytosis has not been reported from unicellular streptophytes. Concerning the effect of BFA, these algae are therefore more similar to Arabidopsis, whereas Chara is more similar to Nicotiana.
BFA and inhibition of pH banding
Even at low concentrations, BFA nearly immediately inhibited the pH banding pattern generated by local accumulation (in charasomes) and/or activation of proton pumps and H+/OH− channels [Beilby and Bisson, 2012 for review]. PH banding requires cytoplasmic streaming and photosynthesis. However, streaming rates were similar in control and BFA-treated cells and photosynthetic electron transfer, measured under the conditions applied in this study, was not significantly affected by BFA. The BFA-induced changes in surface pH were in a similar time range as the inhibition of endocytosis. It is therefore reasonable to conclude that membrane recycling and a continuous supply of new transporters is required for the pH banding pattern. In Zea mays coleoptiles, the plasma membrane H+ ATPase has an apparent half-life of around 12 min [Hager et al., 1991] which is in a similar time range expected for Chara plasma membrane H+ ATPase on the basis of BFA-induced inhibition of pH banding.
The smoothening of the surface pH came along with a more homogeneous, slightly lowered cytosolic pH. Acidification has been reported to dramatically affect dynamics and recruitment of clathrin and associated adaptors [Dejonghe et al., 2016] and it has been suggested that inhibition of clathrin-mediated endocytosis by mitochondrial uncouplers and other inhibitors is due to a strong decrease in cytoplasmic pH [Dejonghe et al., 2016]. However, in Chara internodal cells, the changes in pHcyt were small and comparable to those observed after treatment with the photosynthesis inhibitor DCMU (3-(3,4-dichlorophenyl)-1,1-dimethylurea; own unpublished data). Earlier studies have shown that in the absence of photosynthesis, endocytosis is increased rather than inhibited as suggested by the degradation of charasomes [Schmoelzer et al., 2011]. The BFA-induced inhibition of endocytosis in internodal cells is therefore not due to the acidification of the cytoplasm.
BFA does not inhibit wound healing in characean internodal cells
In characean internodal cells, BFA did not inhibit the deposition of amorphous, membrane-containing wound walls induced by either puncturing or local irradiation with strong light. This does not indicate, however, that vesicle production by Golgi or TGN are unaffected by BFA. Vesicles required for wound healing are abundantly available in internodal cells and are ready to fuse with the plasma membrane upon injury [Foissner and Wasteneys, 2012]. BFA, however, inhibited the deposition of a fibrillar, cellulose-containing wound wall. In this case too, vesicles destined for exocytosis are probably abundant and the inhibitory effect of BFA was likely to be due to the inhibition of membrane recycling, a necessary prerequisite for the deposition of a cellulose-containing fibrillary wall [Foissner and Wasteneys, 2012].
Wounding of internodal cells causes the local reorganisation of the actin cytoskeleton from parallel bundles to a fine-meshed 3D-network which supports vesicle movement towards and away from the wound surface [Foissner and Wasteneys, 2000]. After wound healing, which usually requires 1–2 h, parallel actin bundles along the wound surface are regenerated and continuous cytoplasmic streaming is restored in control cells [Foissner and Wasteneys, 2012]. In BFA-treated cells, we still observed saltatory movements suggesting that the recovery of actin bundles was strongly delayed. This further indicates that membrane recycling and, possibly, exocytosis of newly formed TGN- or Golgi-vesicles are required for proper polymerisation and bundling of actin filaments. In Lilly pollen tubes, BFA reorganised the actin cytoskeleton from cortical actin bundles to a meshwork which extends from a subapical vesicle aggregate probably due to ectopic activation of actin-nucleating proteins [Hörmanseder et al., 2005]. These findings and the data presented in this study impressively show that the cytoskeleton not only determines the direction and velocity of organelles but also that organelle trafficking and distribution influences the organisation of the cytoskeleton.
BFA and charasomes
Formation of charasomes requires exocytosis of TGN-derived vesicles and local inhibition of membrane recycling [Lucas and Franceschi, 1981]. Charasome degradation has been shown to occur via clathrin-coated vesicles [Hoepflinger et al., 2017]. We therefore expected a stimulating effect of BFA on charasome formation and an inhibitory effect on charasome degradation. Contrary to our expectations, however, BFA inhibited charasome formation and had no detectable effect on charasome degradation. The inhibitory effect on charasome formation could perhaps be explained by a reduced supply of newly formed TGN vesicles which cannot bud off in the presence of BFA. Less understandable is why BFA did not inhibit or delay charasome degradation. A possible explanation for this lies in the fact that restructuring of charasomes is a long-lasting process which extends over several days [e.g. Schmoelzer et al., 2011]. Treatment of cells with BFA will affect not only charasome degradation but also constitutive endocytosis which is required for the survival of cells. This notion is consistent with the finding that the clathrin inhibitor ikarugamycin, which was less efficient in Chara internodal cells and never completely blocked endocytosis, significantly delayed the degradation of charasomes [Hoepflinger et al., 2017]. But clearly more studies are required to clarify these different effects.
GNOM and GNL proteins in Chara
The genome of C. braunii revealed three proteins with sequence similarities to GNOM and GNL proteins of higher plants. Protein GBG74811 showed the highest homologies to AtGNOM and was therefore called CbGNOM. The other two proteins showed a lesser degree of identical amino acids, but were nonetheless homologous forms of GNOM and GNL proteins. All three showed an N-terminal GEF domain (IPR032691), a Sec7 domain (IPR000904) and its BFA-sensitive region. According to Jelinkova et al. (2015), there is a specific set of amino acids involved in the mediation of BFA sensitivity or resistance. The involved amino acids are highlighted in yellow in Figure 10. Particularly the amino acids at position 5 and 8 of the BFA-sensitive region are key components in this functional change. Either an exchange from serine to alanine (position 5), or from methionine to leucine (position 8) results in BFA resistance. Based on these criteria, functional predictions can be made for the three C. braunii proteins. The BFA-sensitive region of GBG70987 shows a serine at position 5 and methionine at position 8 and is therefore most likely BFA sensitive. GBG70096 can be assumed to be BFA resistant, as it shows an alanine (position 5) and a methionine (position 8). CbGNOM on the other hand seems to be special. There is a serine at position 5, pointing to sensitivity. Interestingly, at position 8, we find neither methionine nor leucine. Instead, there is an isoleucine, which was not described for the BFA-sensitive region so far. Methionine, isoleucine and leucine belong to the group of hydrophobic amino acids and are chemically similar. Thus, drawing any conclusion is not possible yet. Further experiments, including independent verification of the sequence by cloning and sequencing as well as functional experiments are needed to clarify this point.
Materials and methods
Algal material, culture conditions and inhibitor treatments
Male thalli of C. australis R. Brown were grown in a substrate of soil, peat and sand as described previously [Hoepflinger et al., 2017]. After several weeks of growth, branchlet internodal cells from the third to the fifth whorl were isolated with a small pair of scissors and left in AFW (10−4 M NaCl, 10−4 M KCl, 10−3 M CaCl2) until use.
Working solutions of BFA (Sigma–Aldrich) were diluted with AFW from a 70 mM stock solution in DMSO and control media contained the equivalent concentration of the solvent. The pH of AFW was not significantly altered by BFA.
In vivo staining, microscopy and statistical analysis
For in vivo staining of charasomes and endosomes, internodal cells were pulse labelled for 2–5 min with green fluorescent FM1-43FX (N-(3-triethylammoniumpropyl)-4-(4-(dibutylamino)styryl)pyridinium dibromide; Thermo Fisher). The dye was used at a concentration of 10 μM diluted from a 500 μM stock solution in distilled water.
The ‘window technique’ was applied for the study of endocytosis [Kamitsubo, 1972]. Internodal cells were locally irradiated with the highest intensity of the blue light of a halide microscope lamp for 3 min at least 1 day prior to the experiments and using a 40× objective. This treatment causes the release of cortical chloroplasts and allows an undisturbed view on fluorescently stained endoplasmic organelles [Hoepflinger et al., 2017].
The effect of BFA on wound healing was studied in cells locally irradiated with the highest intensity of the blue light of a microscope Hg lamp for at least 15 min (40× objective) and in cells punctured with sharpened tungsten needles [Foissner, 1988].
Charasome formation and degradation was studied in branchlet internodal cells, which were isolated from the thallus, placed in microtiter plates and exposed to light (5 μE m−2 s−1, 16/8 h light dark regime) for 8 days or incubated in darkness for 11 days, respectively. Maximal charasome area fraction per cell was measured in FM1-43-stained cells as described in Hoepflinger et al. (2017).
The confocal laser scanning microscope used in this study was a Leica TCS SP5 coupled to a DMI 6000B inverted microscope. For the excitation of FM1-43FX, we used the 488 nm line of the argon laser and the emitted fluorescence was detected in the range 505–550 nm. All images included in this study are single optical sections.
For statistical analysis of fast-moving endosomes, data were collected from individual images of at least four videos (time series), each consisting of 60 frames. These images were taken with a 63× water immersion objective (numerical aperture 1.2) at maximal speed (1000 Hz) and using a HyD detector. Lower speed and normal detectors were used for imaging charasomes. The number and size of endosomal particles per area and the charasome area fractions (% of cell surface occupied by charasomes; Schmoelzer et al., 2011) were analysed using ImageJ (http://imagej.nih.gov/ij), Sigma Plot 13 (Systat Software) and Microsoft Excel (https://products.office.com).
Measurements of surface pH and chlorophyll fluorescence
Alkaline and acid bands were identified with 4 μM phenol red (phenolsulfonphthalein; Sigma) dissolved in AFW or by tip-sensitive antimony pH microelectrodes as described in Bulychev et al. (2001). Chlorophyll fluorescence was measured according to Bulychev and Foissner (2020).
Cytoplasmic pH measurements
The cytoplasmic pH was measured using the dual-excitation wavelength pH indicator BCECF conjugated to 10 kDa dextran (Molecular Probes). Very young branchlet internodal cells with lengths of up to 5 mm were injected with a few nanoliter from a 2 mM BCECF-10kD dextran dissolved in perfusion solution (200 mM sucrose, 70 mM KCl, 4.49 mM MgCl2, 5 mM EGTA, 1.48 mM CaCl2, 10 mM pipes; pH 7.3) [Williamson et al., 1989] using a CellTram Oil manual microinjector (Eppendorf Austria GmbH). Usually only one of the two cells in the branchlet was injected. Within one day, the dye distributed uniformly also to the neighbouring cell. Recovery of cytoplasmic streaming was a criterion of successful microinjection. Imaging was performed with the confocal laser scanning microscope. Whole cell images (bright field and fluorescence images) were reconstructed by stitching together single images (square tiles of 1.55 mm × 1.55 mm) taken at lower magnification (10× objective). For determining the pHcyt, the measurements were performed at high magnification (63× water immersion objective) on at least three regions (squares with a size of up to 54 μm × 54 μm) situated within the tiles. The focal plane was in the ectoplasm, slightly above the chloroplasts. The pHcyt values were determined by dual channel ratio imaging, using the sequential scan modus with excitation from the Ar laser lines at 458 and 488 nm. For the pixel-by-pixel image ratioing, the Leica LASAF quantification tool stack profile in conjunction with a ratio imaging calculator were used. Small ectoplasm areas between chloroplasts (ROIs) were manually chosen and the intensity ratios for these areas were determined. The intensity values were translated into pHcyt values by means of a calibration curve. For the calibration curve, image ratioing as stated above was performed on four cells, which were loaded by perfusion with 50 μM BCECF-dextran dissolved in perfusion solutions having pH values between 8 and 5.
During the measurements, cells were placed in AFW supplemented with 10 μM FITC conjugated to 10 kDa dextran, a cell-impermeable pH indicator that revealed the alkaline band pattern outside the cells. Coarse mapping for surface pH was performed using the 10× objective.
Electron microscopy
Chemical fixation was performed as described by Foissner (1991). Briefly, cells were fixed for 20 min at room temperature in 1% glutaraldehyde dissolved in phosphate buffer, pH 6.8. After several washes in buffer, cells were post fixed overnight at 4°C in 2% OsO4 dissolved in buffer. After dehydration in an ethanol series at 4°C, cells were embedded in Agar low viscosity resin (Agar Scientific) via propylene oxide. Thin sections were stained with uranyl acetate and lead citrate.
Micrographs of ultrathin sections were taken using elastic bright-field mode with a LEO 912 transmission electron microscope, equipped with in-column energy filter (Zeiss).
The number of coated pits and coated vesicles along the plasma membrane was counted on images measuring 6 × 6 μm2. At least three cells were investigated per experiment and in total 987 images were examined with an overall plasma membrane length of 7400 μm.
Protein sequence analyses
Two sequences from A. thaliana (AtGNOM, At1g13980 and AtGNL1, At5g39500) were used to screen for homologous proteins in the C. braunii genome [Nishiyama et al., 2018] using the local alignment search tool BLAST [Altschul et al., 1990] and the available datasets. The following three homologous C. braunii protein sequences were obtained: Hypothetical protein CBR_g19322, GenBank accession number: GBG74811 (CbGNOM, 1718 amino acids, calculated MW 183.4 kDa); Hypothetical protein CBR_g5727, GenBank accession number: GBG70096 (1913 amino acids, calculated MW 209.5 kDa); Hypothetical protein CBR_g8287, GenBank accession number: GBG70987 (1974 amino acids, calculated MW 216.3 kDa). Protein sequence alignments were performed using Clustal Omega (EMBL-EBI) and conserved regions were detected using InterPro [Mitchell et al., 2015].
Author contribution
I.F. designed the research; all authors performed experiments, analysed the data and contributed to the writing of the manuscript.
Funding
This research was funded by the Austrian Science Fund (FWF; project no. P 22957 and P 27536 to I.F.) and by the Russian Foundation for Basic Research (project no. 20-54-12015 to A.A.B.).
Conflict of interest statement
The authors have declared no conflict of interest.


