Development and validation of a deep learning model for morphological assessment of myeloproliferative neoplasms using clinical data and digital pathology
Rong Wang, Zhongxun Shi and Yuan Zhang contributed equally to the work as first authors.
Guanyu Yang, Wenyi Shen and Yongyue Wei contributed equally to this study.
Jianyong Li senior author.
Summary
The subjectivity of morphological assessment and the overlapping pathological features of different subtypes of myeloproliferative neoplasms (MPNs) make accurate diagnosis challenging. To improve the pathological assessment of MPNs, we developed a diagnosis model (fusion model) based on the combination of bone marrow whole-slide images (deep learning [DL] model) and clinical parameters (clinical model). Thousand and fifty-one MPN and non-MPN patients were divided into the training, internal testing and one internal and two external validation cohorts (the combined validation cohort). In the combined validation cohort, fusion model achieved higher areas under curve (AUCs) than clinical or DL model or both for MPNs and subtype identification. Compared with haematopathologists with different experience, clinical model achieved AUC which was comparable to seniors and higher than juniors (p = 0.0208) for polycythaemia vera. The AUCs of fusion model were comparable to seniors and higher than juniors for essential thrombocytosis (p = 0.0141), prefibrotic primary myelofibrosis (p = 0.0085) and overt primary myelofibrosis (p = 0.0330) identification. In conclusion, the performances of our proposed models are equivalent to senior haematopathologists and better than juniors, providing a new perspective on the utilization of DL algorithms in MPN morphological assessment.
Graphical Abstract
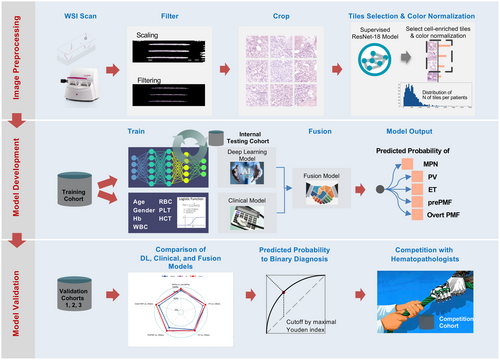
The subjectivity of morphological assessment and the overlapping pathological features of different subtypes of myeloproliferative neoplasms (MPNs) make accurate diagnosis challenging. To improve the pathological assessment of MPNs, we took both haematoxylin–eosin staining BM whole-slide images (WSI) and clinical features from 1051 MPN and non-MPN patients from seven hospitals in China, and developed artificial intelligence-assisted model based on the combination of WSI and clinical parameters for pathological diagnosis. Our model demonstrated well performance in distinguishing MPNs from non-MPN conditions and MPN subtypes. The diagnostic accuracies surpassed those of junior haematopathologists and were equivalent to seniors, providing a new perspective on the comprehensive utilization of deep learning models in MPN morphological assessment.
INTRODUCTION
Myeloproliferative neoplasms (MPNs) are a group of malignant clonal disorders that originate from haematopoietic stem cells. They are characterized by the proliferation of one or more myeloid lineages and an increased risk of transformation to acute myeloid leukaemia (AML).1 Clinical behaviours and outcomes are distinct between different subtypes, especially between primary myelofibrosis (PMF) and other subtypes,2 making accurate diagnosis crucial. Distinction between MPN subtypes is based on integrating clinical findings with molecular profiles and bone marrow (BM) morphological evaluation.3 Somatic Janus kinase 2 (JAK2), calreticulin (CALR) or myeloproliferative leukaemia protein (MPL) mutations (so-called ‘driver mutations’) are present in the majority of MPN patients and play an important role in the differentiation of MPNs from reactive conditions. However, these markers are powerless in cases of MPNs that lack driver mutations and in the differentiation of MPN subtypes. Since the 2016 World Health Organization (WHO) MPN diagnostic criteria, BM histology has been promoted from a minor to major criterion for all subtypes,4 and it has become the indispensable tool for the diagnosis of MPN subtypes. However, the subjectivity of morphological assessment and the markedly overlapping pathological features of different subtypes, especially for essential thrombocytosis (ET) and prefibrotic PMF (prePMF), lead to the lack of reproducibility between observers, making accurate pathological diagnosis challenging and controversial.5, 6
Deep learning (DL) techniques are showcasing significant improvements in digital pathology image analysis,7 and they provide numerous potential tools for physicians in general and state-of-the-art performance on various tasks such as disease detection, classification and survival prediction for malignant tumours.8-11 In haematological disorders, DL has been, therefore, attempted to enhance the diagnostic methods by turning from the conventional, subjective and laboratory characteristics of morphological features to objective, quantitative and automated characteristics of BM components and clinical information.12 Recent pilot studies with limited sample size (less than 200 samples) have demonstrated the potential of DL systems as effective assistive tools for MPN diagnosis based on the evaluation of megakaryocyte features and BM fibrosis grades, which are important features while lack of reproducibility between observers.13, 14 However, MPN morphological diagnosis requires global pathological assessment and previous models have relied on expensive and time-consuming manual annotations of single cell type or fibrosis grades. Moreover, the generalized performance of DL in large-scale deployments has not been reported.
To tackle the aforementioned challenges in terms of MPN pathological diagnosis, we have proposed a DL model that utilizes annotation-free haematoxylin–eosin (HE)-staining BM whole-slide images (WSIs) and included clinical information to improve the accuracy of pathological diagnosis. The model was developed and validated in a cohort of 1051 patients from seven representative hospitals, which is currently the largest available cohort in artificial intelligence (AI)-assisted MPN diagnostic model construction. Our model was able to effectively distinguish MPNs from non-MPNs and exhibited good performance in subtype differentiation, which was comparable to the performance of experienced haematopathologists, thereby providing a new perspective on the comprehensive utilization of DL algorithms in MPN pathological assessment.
MATERIALS AND METHODS
Study populations and diagnosis
A total of 1215 MPN patients, including polycythaemia vera (PV), ET, prePMF and overt PMF and non-MPN patients, admitted to seven hospitals in China from March 2012 to September 2021 were retrospectively selected. After WSI and clinical information filtering, 819 MPN patients, including 196 with PV, 225 with ET, 184 with prePMF and 214 with overt PMF, and 232 non-MPN patients with other haematological disorders or normal BM were finally enrolled in this study (Table 1). A final MPN diagnosis was made in accordance with the WHO (2016) MPN definitions.4 The distribution of non-MPNs diagnoses is shown in Table S1. All of the patients underwent BM biopsy with the length of specimens no less than 15 mm and the diameter no less than 2 mm. Paraffin embedding was used for section preparation. HE and reticulin staining were performed for MPN cases. Pathological diagnosis for each patient was reached by consensus of five experienced haematopathologists.
| Hospital | Non-MPNs | ET | PV | PrePMF | Overt PMF | Total |
|---|---|---|---|---|---|---|
| Jiangsu Province Hospital | 161 | 155 | 108 | 133 | 134 | 691 |
| Peking Union Medical College Hospital | 25 | 19 | 19 | 8 | 15 | 86 |
| Affiliated Provincial Hospital, Anhui Medical University | 9 | 6 | 12 | 16 | 10 | 53 |
| The First Affiliated Hospital of Soochow University | 13 | 16 | 14 | 4 | 12 | 59 |
| The First Affiliated Hospital of Nanchang University | 9 | 9 | 6 | 5 | 11 | 40 |
| Tongji Hospital, Tongji Medical College, Huazhong University of Science and Technology | 12 | 14 | 24 | 13 | 19 | 82 |
| Fujian Medical University Union Hospital | 3 | 6 | 13 | 5 | 13 | 40 |
| Total | 232 | 225 | 196 | 184 | 214 | 1051 |
- Abbreviations: ET, essential thrombocytosis; MPN, myeloproliferative neoplasm; prePMF, prefibrotic primary myelofibrosis; PV, polycythaemia vera.
Sample collection and data processing
WSIs of HE-stained BM biopsy specimens from MPN and non-MPN patients were collected and scanned at 0.2 μm/pixel using PANNORAMIC SCAN 150 (3DHISTECH Ltd., Budapest, Hungary) (scanner 1) and moticVM1000 (MOTIC Ltd., Xiamen, China) (scanner 2). Patients with poor image quality of WSIs, which prevented reaching a diagnostic conclusion, were excluded. Clinical characteristics and laboratory measurements were obtained from medical records. For patients who underwent BM biopsy only once, the samples at that time point were taken. For patients with several examinations in different time points, the most recent WSIs and corresponding clinical information were taken.
Development of a DL neural network
The workflow of image preprocessing in DL neural network development is shown in Figure 1A.
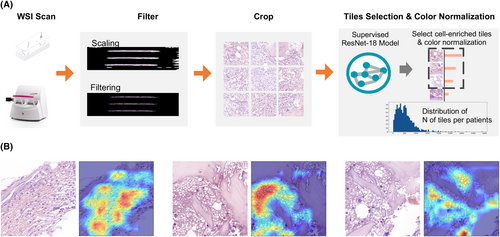
WSIs with patient-level diagnostic label without any cell type level or region of interest level annotation were scanned for DL model construction. Each WSI was cropped into 512 × 512 patches without overlap from 40× (0.2 μm/pixel) objective magnifications in order to capture detailed information of the images.15 Then, each patch underwent colour normalization using the Vahadane algorithm, which is specifically designed to mitigate the variability in stained conditions across different samples in histopathology, to minimize the inter-slide staining variability and to enhance the comparability of the patches. Considering that the cropped patches often contained significant amounts of blank background regions, whereas cell-enriched regions harboured more comprehensive information crucial for diagnosis. Therefore, a cell-enriched patch selection model based on the ResNet-18 network was trained for WSI preprocessing. Details of preprocessing using ResNet-18 are provided in Supporting Information, Methods.
We also used gradient-weighted class activation mapping (Grad-CAM) as the visual interpretability of the algorithm to generate saliency maps, which highlighted the most discriminative areas of the input images that contributed to the model's decision-making process. The CAMs generated by our model consistently focused on the pathological regions that exhibited abnormalities, such as the areas with visible cell deformation or dense clusters, which are key indicators of the presence of disease (Figure 1B). All of the experiments were performed on one NVIDIA GTX3090 GPU (24 GB), with implementation details provided in the Supporting Information, Methods.
SimCLR which is the state-of-the-art self-supervised constative learning algorithm was used for WSI training in the training cohort16 by exploring the inherent similarity between patches without requiring labelled data. A classic multiple instance learning (MIL) approach, specifically the instance-based MIL algorithm combined with a max-pooling strategy, was employed to form the whole image embedding according to attentional mechanisms as the bag embedding consisting of the embedding of representative patches that best match the exclusive characteristic of the subtype for classification. Details on SimCLR and MIL are provided in the Supporting Information, Methods. The last fully connected layer subjected to SoftMax16 activation obtained the normalized class probability for the four MPN subtypes as well as non-MPN cohort based on the average of embedding from the bag and the most representative patch; such output, in a format of n × 5 matrix, was considered the DL model score (DLMS) (Table S2). The focal loss17 was used as the objective function to diminish class imbalance and to achieve better generalization by focusing on hard examples and preventing the network from being overloaded with easy negatives during the training process.
Processing of clinical parameters and generation of the clinical model score
For each individual, a risk score which represents the log-odds of the MPN (or the subtype) was calculated as CMSsubtype for each subtype. The parameters with missing rates less than 30%, including age, gender, white blood cell count, haemoglobin (Hb), red blood cell count (RBC), haematocrit (HCT) and platelet (PLT) count , were recruited for clinical model development. The multiple imputation process was performed to handle missing values using R package mice, and the corresponding coefficients were pooled by Rubin's law during the multiple imputation process to account for imputation variance (Figure 2; Supporting Information, Methods).18
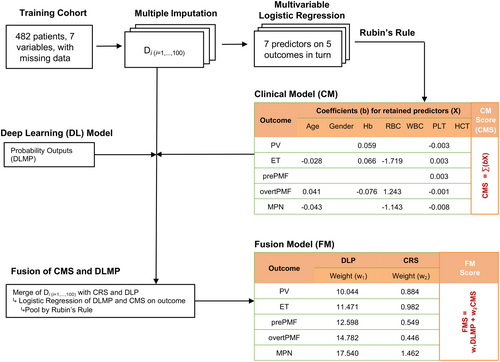
Multivariate logistic regression of all of the candidate variables was performed in the training cohort. The variables with a p-value lower than 0.05 (notated by xi, where i = 1,…, m, and m indicates the number of variables retained) were selected out as predictors, and they were linearly combined with the corresponding coefficient (bi) as weight to form the clinical model score for MPN diagnosis (CMSMPN) (Table S2). Similarly, for the MPN subtype diagnosis model, logistic regression on true labels of MPN subtypes versus the others was performed and the CMS for subtype was constructed.
Generation of fusion model score
For fusion model score (FMS) generation, bivariate logistic regression was used to combine the corresponding CMS and the normalized class probability from the DL model using regression coefficients as weights (Table S2; Figure 2).
Reader study
To compare the accuracy of the models with haematopathologists, six independent haematopathologists were involved in the reader study, including three juniors (less than 5 years of experience) and three seniors (more than 10 years of experience). Hundred patients including 16 with control, 20 with PV, 21 with ET, 12 with prePMF and 31 with overt PMF were randomly selected from the combined validation cohorts for reader study. We employed a random selection process using Python's internal pseudo-random number generator, which implements the Mersenne Twister algorithm, for sample selection. To further enhance the reproducibility of our experiment, we fixed the random seed to 10 and ensured that the sequence of pseudo-random numbers remains consistent across executions, allowing the same samples to be selected in repeated experiments. All the haematopathologists reviewed data of the 100 patients independently. True labels of the patients were masked. Research aims, WSIs and clinical information that used in the model development were provided.
Model evaluation and statistical analysis
Continuous variables were summarized by median (interquartile range), compared among groups using ANOVA. Categorical variables were summarized by frequency and proportion [n (%)] and compared using χ2 test. Area under curve (AUC) and 95% confidence interval (CI) of receiver operating characteristic (ROC) analysis were estimated by R package pROC to evaluate model accuracy. Sensitivity, specificity and accuracy were also estimated to assist in model evaluation. For patients with more than one predicted diagnosis using proposed model, the output was judged to be accurate if the true label of diagnosis was included. Comparisons between the haematopathologists and the models were based on the multireader multicase analysis of variance (MRMCaov) method19 which is implemented in the R package MRMCaov. Optimal cut-off points for the CMS, DLMS and FMS of MPNs or subtype diagnosis models were estimated by Youden index in the internal testing cohort. All of the analyses were performed using R Statistical Software version 4.2.1 and Python version 3.9.1.
RESULTS
Cohort setting and population characteristics
A total of 929 patients with all of the subtypes from five hospitals were divided into the training cohort (N = 482), the internal testing cohort (N = 224) and the internal validation cohort (validation cohort 1) (N = 223). Then, 122 patients were collected from two additional hospitals and divided into two external validation cohorts, namely, validation cohort 2 (N = 82) and validation cohort 3 (N = 40) (Figure S1). The distributions of the diagnoses in each cohort are shown in Table S3. Demographic and available clinical characteristics of non-MPNs and MPN subtypes in each cohort are presented in Tables S4–S8.
Development of the diagnosis model in the training and testing cohorts
First, the DL and clinical model were made first based on HE-stained WSIs of BM biopsy specimens and clinical parameters. For DL model development, 482 WSIs from the training cohort were used for patch feature extraction and classifying algorithm training, and the internal testing cohort was used for testing model performances to choose the best model. Training and testing loss curves and corresponding mean AUCs in the internal testing cohort of the DL model are described in Figure S2. For clinical model construction, multivariate logistic regression was performed in the training cohort and age, Hb, RBC and PLT were finally enrolled (Figure 2). The fusion model was constructed by combining the DL and clinical model with different weights for each subtype using logistic regression (Figure 2).
Validation of proposed diagnosis models
We next validated our diagnosis models in the validation cohort 1, 2 and 3 (together marked as the combined validation cohort). The performances in the combined validation cohort are shown in Table S9 and the results in each cohort are detailed in Tables S10–S12, showing largely consistent results.
Validation of MPN versus non-MPN diagnosis
For MPN versus non-MPN diagnosis, the fusion model achieved better performance compared with the clinical model and DL model. The AUC and accuracy of the fusion model were 0.931 (95% CI: 0.891–0.971) and 0.933 (95% CI: 0.900–0.956), respectively, which were significantly higher than those of the clinical model (AUC: 0.848, 95% CI: 0.804–0.892, p = 0.0014; accuracy: 0.783, 95% CI: 0.734–0.825, p < 0.0001) and the DL model (AUC: 0.891, 95% CI: 0.836–0.946, p = 0.0047; accuracy: 0.882, 95% CI: 0.841–0.913, p = 0.0004) in the combined validation cohort (Figure S3A,B; Table S9). Misclassified MPN cases into non-MPNs decreased from 55(19.9%) in the clinical model to 10 (3.6%) in the fusion model, mostly from overt PMF (Figure S3C,D).
Validation of MPN subtypes diagnosis
We next validated the three models in the differentiation of MPN subtypes in the combined validation cohort.
First, for PV diagnosis, the fusion model achieved better performance than the DL model and was comparable to the clinical model. The AUC and accuracy of the fusion model (AUC: 0.975, 95% CI: 0.960–0.990; accuracy, 0.911, 95% CI: 0.874–0.937) were higher than DL model (AUC, 0.864, 95% CI: 0.820–0.907, p < 0.0001; accuracy, 0.776, 95% CI: 0.727–0.819, p < 0.0001) (Figure 3A,B; Table S9). Fifty-five (23.4%) cases were misclassified into PV group in the DL model (Figure 4A,B), and the number decreased to 19 (8.1%) in the fusion model. Notably, the clinical model also showed good performance in PV identification with an AUC of 0.975 (95% CI: 0.960–0.991) and accuracy of 0.942 (95% CI: 0.911–0.963), which was comparable with the fusion model (AUC: p = 0.9700; accuracy: p = 0.1300) (Figure 3A,B), and only five (2.1%) non-PV cases were misclassified into PV group.
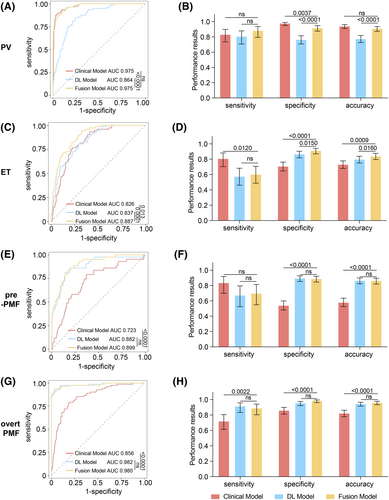
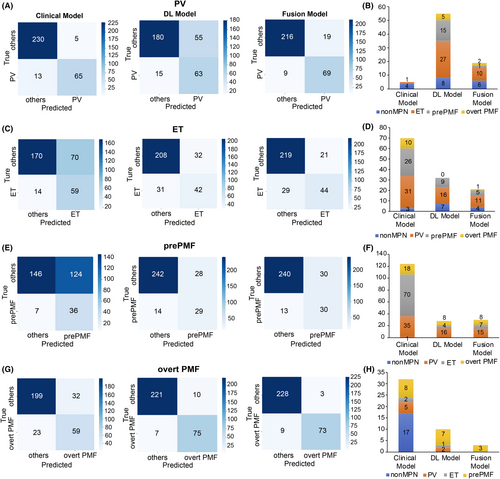
For ET identification, the fusion model showed better performance than both the clinical and DL models. The AUC of the fusion model (0.887, 95% CI: 0.850–0.925) was significantly improved compared with that of the DL model (0.837, 95% CI: 0.790–0.884, p = 0.0001) and the clinical model (0.826, 95% CI: 0.778–0.874, p = 0.0130) (Figure 3C,D; Table S9). The fusion model (0.840, 95% CI: 0.796–0.877) showed better accuracy than the clinical model (0.732, 95% CI: 0.680–0.778, p = 0.0009), with higher specificity (fusion model: 0.913, 95% CI: 0.870–0.942, clinical model: 0.708, 95% CI: 0.648–0.762, p = 0.012) and lower sensitivity (fusion model: 0.603, 95% CI: 0.488–0.707; clinical model: 0.808, 95% CI: 0.703–0.882, p < 0.0001) (Figure 3C; Table S9). Seventy (29.1%) cases were misclassified into ET group in the clinical model, mostly from PV (N = 31) and prePMF (N = 26), and the number decreased to 11 for PV and 5 for prePMF in fusion model (Figure 4C,D).
Similarly, for prePMF identification, the fusion model performed better than the clinical model and did not differ from the DL model. The fusion model showed an AUC of 0.899 (95% CI: 0.851–0.947) and accuracy 0.863 (95% CI: 0.820–0.896), which were higher than those of the clinical model (AUC: 0.723, 95% CI: 0.639–0.806, p = 0.00011; accuracy: 0.581, 95% CI: 0.526–0.635, p < 0.0001). Specificity improved significantly from 0.541 (95% CI: 0.481–0.599) in the clinical model to 0.889 in the fusion model (95% CI: 0.846–0.921, p < 0.0001) (Figure 3E,F; Table S9), reducing the misdiagnosis rate, especially from ET. Consistently, there were 124 (45.9%) cases misclassified into prePMF group, among which 70 were from ET (Figure 4E,F), and the number decreased to 4 in the fusion model (Figure 4F).
For overt PMF diagnosis, the performance of the fusion model was better than that of the clinical model and comparable to that of the DL model. The fusion model achieved an AUC of 0.980 (95% CI: 0.961–0.999) and accuracy of 0.962 (95% CI: 0.934–0.978), comparable to DL model (AUC: 0.982, 95% CI: 0.965–0.999, p = 0.4600; accuracy: 0.946, 95% CI: 0.915–0.966, p = 0.1800) and outperforming the clinical model (AUC: 0.856, 95% CI: 0.809–0.904, p < 0.0001; accuracy: 0.824, 95% CI: 0.778–0.862, p < 0.0001) (Figure 3G,H; Table S9). Notably, only three prePMF patients were misclassified into overt PMF group in the fusion model (Figure 4G,H), indicating that our model could effectively distinguish between prePMF and overt PMF.
Comparison study of haematopathologists and the proposed models
To compare the accuracies of the proposed models with those of the haematopathologists, a reader study was performed on six independent haematopathologists with different levels of experience. The speed of model output on the regular workstation was much faster than manual processing, with less than 1 second. The performances of the proposed models and haematopathologists are summarized in Table 2. The diagnoses of each sample and the confusion matrices by haematopathologists and the proposed models are listed in Tables S13 and S14.
| Diagnostic subtype | Diagnostic method | AUC (95% CI) | Sensitivity (95% CI) | Specificity (95% CI) |
|---|---|---|---|---|
| PV | Senior | 0.908 (0.899, 0.917) | 0.867 (0.795, 0.938) | 0.950 (0.888, 1.000) |
| PV | Junior | 0.850 (0.809, 0.891) | 0.733 (0.590, 0.877) | 0.967 (0.918, 1.000) |
| PV | Clinical | 0.904 (0.859, 0.949) | 0.850 (0.850, 0.850) | 0.958 (0.891, 1.000) |
| PV | DL | 0.781 (0.754, 0.808) | 0.850 (0.850, 0.850) | 0.713 (0.612, 0.813) |
| PV | Fusion | 0.865 (0.748, 0.981) | 0.833 (0.690, 0.977) | 0.896 (0.819, 0.973) |
| ET | Senior | 0.860 (0.795, 0.926) | 0.746 (0.565, 0.927) | 0.975 (0.920, 1.000) |
| ET | Junior | 0.707 (0.503, 0.912) | 0.444 (0.000, 0.892) | 0.970 (0.933, 1.000) |
| ET | Clinical | 0.796 (0.787, 0.805) | 0.905 (0.905, 0.905) | 0.688 (0.590, 0.786) |
| ET | DL | 0.724 (0.712, 0.735) | 0.603 (0.535, 0.671) | 0.844 (0.756, 0.932) |
| ET | Fusion | 0.801 (0.790, 0.813) | 0.746 (0.678, 0.814) | 0.857 (0.771, 0.942) |
| PrePMF | Senior | 0.797 (0.593, 1.000) | 0.722 (0.291, 1.000) | 0.871 (0.732, 1.000) |
| PrePMF | Junior | 0.693 (0.544, 0.841) | 0.472 (0.041, 0.903) | 0.913 (0.798, 1.000) |
| PrePMF | Clinical | 0.715 (0.630, 0.799) | 0.861 (0.742, 0.981) | 0.568 (0.464, 0.672) |
| PrePMF | DL | 0.834 (0.766, 0.902) | 0.778 (0.658, 0.897) | 0.890 (0.831, 0.950) |
| PrePMF | Fusion | 0.828 (0.760, 0.896) | 0.778 (0.658, 0.897) | 0.879 (0.816, 0.941) |
| Overt PMF | Senior | 0.850 (0.683, 1.000) | 0.710 (0.360, 1.000) | 0.990 (0.949, 1.000) |
| Overt PMF | Junior | 0.834 (0.812, 0.857) | 0.731 (0.609, 0.854) | 0.930 (0.852, 1.000) |
| Overt PMF | Clinical | 0.739 (0.663, 0.814) | 0.656 (0.610, 0.702) | 0.821 (0.722, 0.921) |
| Overt PMF | DL | 0.907 (0.842, 0.972) | 0.882 (0.835, 0.928) | 0.932 (0.867, 0.998) |
| Overt PMF | Fusion | 0.912 (0.826, 0.997) | 0.882 (0.835, 0.928) | 0.942 (0.847, 1.000) |
- Abbreviations: AUC, area under curve; DL, deep learning; ET, essential thrombocytosis; prePMF, prefibrotic primary myelofibrosis; PV, polycythaemia vera.
Overall, the average performances of senior haematopathologists were better than those of junior haematopathologists, especially for PV, ET and prePMF. Namely, the AUCs of the seniors were 0.908 (95% CI: 0.899–0.917) for PV, 0.860 (95% CI: 0.795–0.926) for ET and 0.797 (95% CI: 0.593–1.000) for prePMF, while the AUCs of the juniors were 0.850 (95% CI: 0.809–0.891, p = 0.0145) for PV; 0.707 (95% CI: 0.503–0.912, p = 0.0007) for ET; and 0.693 (95% CI: 0.544–0.841, p = 0.0311) for prePMF (Table 2; Figure 5A–D).

We then compared the performances of the proposed models with those of the haematopathologists (Figure 5; Table S15). In MPN subtype differentiation, the clinical model achieved the highest AUC (0.904, 95% CI: 0.859–0.949) for PV, which was equivalent to the seniors (p = 0.8373) and higher than the juniors (p = 0.0208), and its performance tended to be better than that of the fusion model (p = 0.073) (Figure 5A). For ET identification, the fusion model achieved the best performance, with an AUC of 0.801 (95% CI: 0.790–0.813); it was considerably better than the juniors (p = 0.0141) and comparable to the seniors (p = 0.0914) (Figure 5B). Similarly, for prePMF identification, the AUC of the fusion model (0.828, 95% CI: 0.760–0.896) was comparable to the seniors (p = 0.4651) and higher than the juniors (p = 0.0085) (Figure 5C). In overt PMF diagnosis, the fusion model (0.912, 95% CI: 0.826–0.997) achieved better performance than the juniors (0.834, 95% CI: 0.812–0.857, p = 0.0330) and comparable to while tended to be better than the seniors (0.850, 95% CI: 0.683–1.000, p = 0.0773) (Figure 5D).
DISCUSSION
In this AI-assisted modelling study, we have successfully developed and validated the significant diagnostic value of machine learning in MPNs and subtype pathological identification. The proposed model has demonstrated its superior ability to distinguish MPNs from other haematological disorders and MPN subtypes. By examining the CAMs, we observed that our DL model successfully localized the disease-affected regions, even without explicit pixel-level annotations. This demonstrates that the model has learned to focus on the correct features related to the presence of pathology, thereby showcasing the impressive feature extraction capability of the WSI-level label DL algorithm. This finding establishes its comparability to the cell-level annotation supervised model.
The number of cohorts and the patient diversity from different hospitals might lead to a discrepancy between different validation cohorts. The diagnosis of multiple classifications is a trade-off between sensitivity and specificity and compromise among multiple classifications. The most common way to get multiple classifications in DL networks is taking the largest output probability as the prediction result based on the SoftMax layers, which benefits from the mutually exclusive and only one output. However, if there is a very minor difference between the probabilities,20 tiny relative differences would be magnified. This would lead to wrong prediction without significant differences from each other which also raises doubts as to whether it contradicts the reality of meeting clinical diagnostic criteria. Instead of taking the maximum probability, here, we combined DL predictions with clinical information into a statistical model for further subtype pathological diagnosis.
Abnormal blood routine is the common visit reason for suspected MPN patients. BM biopsy and genetic test are performed simultaneously for diagnosis. Notably, classification of MPNs is not biology driven. Pathophysiological mechanisms play a crucial role in MPN subtypes differentiation, and characteristic changes such as megakaryocyte morphology are the key point in diagnosis.21 However, the lack of reproducibility in morphological assessment especially HE staining leads to the discordance of MPN subtype identification between haematopathologists, making accurate pathological diagnosis challenging.5, 6 AI and machine learning algorithms provide an effective tool for automated feature extraction, and they have been applied in the diagnosis and prognosis of MPNs.8, 13, 14, 22 Recent studies have developed machine learning approaches to automatically describe megakaryocyte features and BM fibrosis for MPN diagnosis.13, 14 However, these models have relied on the evaluation of single cell type or fibrosis grades, which is time-consuming and needs expensive manual annotations. In our study, we developed a DL algorithm based on annotation-free HE-stained WSIs and combined clinical information to improve diagnostic accuracy. Our models appealed to the actual clinical MPN pathological diagnostic scenario by taking clinical characteristics into consideration. Meanwhile, multiple external validations made the model convincing.
Careful morphological assessment is particularly important for the identification of MPNs and reactive alterations or other haematological disorders. Our fusion model showed high accuracy in distinguishing MPNs from non-MPNs based on clinical parameters and morphological features. Notably, combining driver mutation profiles could further improve the identification accuracy, while for triple-negative MPNs, pathological evaluation may be more helpful.
Erythrocytosis is the hallmark of PV and patients who meet the Hb or HCT threshold, especially Hb >185 g/L (male) and 165 g/L (female) or HCT >52% (male) and >48% (female), accompanied by the presence of JAK2V617F mutation are likely diagnosed as PV in the absence of morphological assessment.23 Although the AUC of the fusion model was not further improved compared with the clinical model by combining morphological features, it still provided an effective tool for PV identification. Importantly, JAK2V617F mutation should be confirmed before making a final diagnosis.
PrePMF with thrombocytosis shares similar clinical manifestations with ET and they always initially mimic with each other, making it difficult for haematopathologists and haematologists to differentiate. Nearly 10%–20% of previously diagnosed ET cases were reclassified as prePMF by re-evaluating the BM specimens.24 The frequencies of driver mutations and MF grades are similar in ET and prePMF, and the differentiation mainly relies on HE staining assessment.25 In our study, the average performances of senior haematopathologists on ET and prePMF identification were better than those of the juniors, indicating that differences in experience may influence the identification of pathological abnormalities. Here, our fusion model achieved AUCs of more than 0.850 in ET and prePMF identification, and it performed better than junior haematopathologists and was comparable to the seniors, which is useful when access to haematopathology expertise is restricted, especially in low-resource healthcare systems.
Overt PMF is characterized by the megakaryocyte alterations and BM fibrosis, and it represents the continuous stage of prePMF.4 Our fusion model did not include reticulin staining, which was a limitation. Nevertheless, the AUC of the fusion model in overt PMF identification was more than 0.900, and this model was able to effectively distinguish between prePMF and overt PMF based on HE-stained WSIs, indicating that our machine learning model has high sensitivity in feature identification and extraction. It provides a tool for the preliminary diagnosis of overt PMF in conditions when reticulin staining is not accessible or has not been done at the first visit.
There are some limitations to our study. First, our model provided an effective tool for HE-stained BM specimen assessment, while additional important pathological features like reticulin staining were not included. Nevertheless, future models would benefit from incorporating more information to improve the predictive accuracy. Second, samples with diseases such as myelodysplastic neoplasms (MDS) with fibrosis and MDS/MPN were not included in the non-MPN cohort. The differentiation between MPNs and these diseases is more complicated, and specific training is needed for the identification of these diseases. Third, despite the favourable performance of the fusion model on MPN differentiation, further validation in prospective and real-world cohort including patients from different regions and levels of medical institutions should be conducted. Fourth, the subtype identification model may overlook the uncertainty in MPN diagnosis. In our future research, we will further optimize the subtype identification model using Bayesian method to consider uncertainty of overall MPN diagnosis. Fifth, for the proposed models, the predicted diagnosis maybe more than one for some cases and the output was judged to be accurate if the true label of diagnosis was included. Despite this, we believed that narrowing down the range of subtypes is still clinically meaningful. We will improve our models by optimizing the algorithm, expanding the sample size and enrolling more information like MF grades in the ongoing prospective study.
In conclusion, by using the largest sample size in the field and combining both morphological features and clinical characteristics, the proposed AI models exhibited satisfactory performances in pathological diagnosis and subtype differentiation of MPNs. The models outperformed junior haematopathologists and achieved comparable performance to senior haematopathologists. To enhance the integration of DL in clinical diagnosis, prospective validation and tool development are crucial in future work to enhance the integration of DL in clinical practice.
AUTHOR CONTRIBUTIONS
Y.W., R.W., W.S. and J.L. conceived and designed the study. Y.Z. and G.Y. developed and validated the deep learning algorithm. R.W., Z.S., L.W., J.H., M.D., M.X., J.W., S.C., Q.W., J.H., X.H., L.F. and J.M. collected clinical data and WSIs. Y.Z. and J.H. performed WSI preprocessing. Z.S., Y.Z., W.S., R.W., J.L. and Y.W. did statistical analysis and clinical interpretation. F.C. and G.Y. reviewed statistical analysis and deep learning procedures. Z.S. and Y.Z. prepared initial draft. All the authors critically reviewed the manuscript. All the authors read and approved the final report. The corresponding authors had full access to the data and had final responsibility for the decision to submit for publication.
ACKNOWLEDGEMENTS
This study was supported by the National Natural Science Foundation of China (82200151 to Z.S. and 82473728 to Y.W.) and Jiangsu Province Capability Improvement Project through Science, Technology and Education (ZDXK202209 to J.L.). We thank LetPub (www.letpub.com) for its linguistic assistance during the preparation of this manuscript.
FUNDING INFORMATION
This study was supported by the National Natural Science Foundation of China (82200151 to Z.S. and 82473728 to Y.W.) and Jiangsu Province Capability Improvement Project through Science, Technology and Education (ZDXK202209 to J.L.).
CONFLICT OF INTEREST STATEMENT
The authors declare no conflicts of interest.
ETHICS STATEMENT
This study was approved by the ethic committee of Jiangsu Province Hospital (2021-SR-019).
PATIENT CONSENT STATEMENT
The informed consent was waived considering the retrospective nature of the study.
Open Research
DATA AVAILABILITY STATEMENT
The algorithm of the models is available in ‘https://github.com/WeiLab4Research/INDEED’. The clinical data can be obtained upon reasonable request by emailing to the corresponding author according to the ethical requirement of the institutions.


