A functional assessment of the impact of changing grazing management of upland grassland mosaics
Abstract
Questions
How do changes in grazing impact functional traits in habitat mosaics? Which habitats are sensitive to management changes?
Location
Mosaic of open upland habitats, including Agrostis–Festucaand Nardus grasslands, Carex and Molinia mires, bracken and wet heath, southern Highlands of Scotland, UK.
Methods
Four grazing treatments were started in 2002: (a) Continued grazing at 0.9 ewe/ha (control); (2) High — 2.7 ewe/ha; (c) Mixed — partial substitution of sheep by cattle; and (d) None. Vegetation was sampled at 25 permanently marked locations per plot every three years. Analysis assessed how grazing affected community-weighted means of selected traits at the whole plot level and community level.
Results
Whole plot level changes in trait means were negligible apart from a small reduction in height in the High and Mixed treatments and a shift to earlier flowering in the High treatment. At the community level, increased grazing generally led to a reduction in canopy height and earlier flowering. Both increased and reduced grazing reduced leaf dry matter content (LDMC) in the most preferred community, Agrostis–Festucagrassland, but reduced grazing increased LDMC in the least preferred community, wet heath. Cattle grazing reduced LDMC in both Agrostis–Festucagrassland and wet heath and reduced height in bracken.
Conclusions
Despite significant changes in grazing there were only small changes in trait means over 15 years. The most preferred communities were less sensitive to grazing removal than expected; few species present can take advantage of reduced grazing. The least preferred communities were more sensitive to grazing removal than expected; they still contain species capable of exploiting this. The presence of more preferred communities in each plot meant increased grazing has less impact on communities of moderate and low preference. Cattle impacts were highest in the communities most sensitive to trampling, bracken and wet heath.
1 INTRODUCTION
Many areas of the world have low intrinsic productivity and so support extensively managed agriculture. Much of this marginal agricultural land is managed through extensive grazing. However, this management of marginal agricultural land is sensitive to changes in the market, and within the area of the European Union (EU), to changes in agricultural support payments (e.g. Renwick et al., 2013). Within the framework of the EU’s Common Agricultural and Rural Development policies, support is provided to farmers within areas where biophysical constraints limit productivity in order to maintain farming in marginal areas (The European Parliament & the Council of the European Union, 2013). If profitability changes the land manager's response could be to extensify where profitability would be increased by reducing overheads (Strijker, 2005), but conditions are attached to agricultural support payments relating to maximum stocking levels to prevent habitat degradation which could limit any intensification where extra profit justifies increased stocking levels, resources or labour (e.g. Scottish Government, 2019).
Hence changes to agricultural support payments are one of the main drivers of levels of agricultural activity in marginal areas (Morgan-Davies et al., 2017). The impact of changes in support on agricultural activity has been seen before. Across Europe in 2003 payments switched from support provided per grazing animal to payments by area (Tranter et al., 2007). In consequence, many parts of Scotland saw large-scale reductions in grazing animals as a result of this conversion, particularly in the southwest and the Highlands, areas dominated by extensive livestock grazing (Gelan & Schwarz, 2008; Renwick et al., 2008).
These areas of marginal agricultural land have an associated suite of species characteristic of nutrient-poor and unproductive land (Bignal & McCracken, 1996). Given these species’ dependence on extensive grazing many studies have investigated the likely biodiversity implications of changing management intensity of marginal lands. For instance, studies have shown that bird community composition is linked to management intensity (Woodhouse et al., 2005), as are invertebrate (Dennis, 2003) and plant communities (García et al., 2013).
However, as species and functional turnover can be uncorrelated (Pakeman & Lewis, 2018), there is also a need to examine how changing management impacts on the ecosystem. This can be done through direct measurement but also by making predictions based on a response and effects trait framework (Lavorel et al., 2013). A number of plant functional traits have been shown to be good predictors of the response of vegetation to various drivers including changing levels of grazing. For instance, plant height decreases, and the proportion of prostrate and stoloniferous plants increases as grazing intensity increases (e.g. Díaz et al., 2007). Similarly, leaf dry matter content (LDMC) decreases and specific leaf area (SLA) increases as grazing intensity increases (Laliberté et al., 2012). However, as response and effect traits can be the same trait or correlated (Pakeman, 2011), then it is possible to assess how changing management can impact on ecosystem processes as effect traits, by definition, have been demonstrated to be correlated to ecosystem processes/function (Suding & Goldstein, 2008). These include leaf dry matter negatively correlated to litter decomposition rates (Kazakou et al., 2006; Quested et al., 2007) and SLA positively correlated to net primary productivity (Poorter & De Jong, 1999).
The potential impact of changing levels of grazing on ecosystem function was assessed using a long-term, large-scale grazing experiment set up on an area of upland, marginal grazing in the southern Highlands of Scotland consisting of a mosaic of plant communities differing in the preference that livestock show in grazing them (Pakeman et al., 2019). The study focussed on the following questions: how do changes in grazing impact functional traits in a mosaic of habitats, and which habitats are more sensitive to management changes? The experimental design included increased sheep numbers, their complete removal and their partial replacement by cattle. The latter was included as cattle have a higher trampling impact than sheep, are less selective in their grazing and it was perceived that this would bring biodiversity benefits (Rook et al., 2004; Tóth et al., 2018). Three hypotheses were assessed. (a) Increased grazing should shift plant functional traits towards shorter, faster-growing, stoloniferous, small-seeded species (Pakeman, 2004; Díaz et al., 2007; Pakeman & Marriott, 2010). In contrast reduced grazing should promote taller, higher LDMC, higher seed mass, rhizomatous species. However, patterns may not be as simple as this as some traits show curvilinear responses to grazing intensity, such as LDMC peaking at intermediate stocking rates (Pakeman & Marriott, 2010). (b) The shifts in trait means in the preferred communities should be higher in response to the removal of grazing as it contains species well adapted to grazing that might be replaced through competition from less grazing-tolerant species, whilst in the unpreferred communities, trait shifts should be higher in response to increased grazing as grazing-tolerant species may expand by being more competitive than grazing-intolerant species. However, shifts in trait values may be highest in moderately preferred communities as they will be exploited more by grazers at high densities (Pianka, 1988; Augustine & McNaughton, 1998). (c) Cattle trampling and their lower selectivity will mimic the impact of higher sheep-grazing density.
2 MATERIALS AND METHODS
2.1 Study site and experimental design
The research was carried out on the Glen Finglas estate (56°16’ N, 4°24’ W), southern Highlands of Scotland, UK. The upper parts of the estate are dominated by a mosaic of upland (generally taken to be above 250–300 m; Ratcliffe & Thompson, 1988), unimproved plant communities including upland wet heathland (according to the UK National Vegetation Classification; Rodwell, 1991, 1992) mainly M15 Scirpus cespitosus (now Trichophorum cespitosum)–Erica tetralix wet heath, the mire communities M6 Carex echinata–Sphagnum recurvum/auriculatum (henceforth Carex mire), M23 Juncus effusus/acutiflorus–Galium palustre and M25 Molinia caerulea–Potentilla erecta (merged as there was little M23 and together called Molinia mire), and the acid grassland communities U4 Festuca ovina–Agrostis capillaris–Galium saxatile (Agrostis–Festucagrassland), U5 Nardus stricta–Galium saxatile (Nardus grassland) and U20 Pteridium aquilinum–Galium saxatile(bracken). Classification of the habitats according to EUNIS (the European Nature Information System) are given in Appendix S1. This area has a cool and moist climate; interpolated mean temperatures for January and July were 3.04°C and 14.12°C, respectively, and the mean annual rainfall was 2,230 mm for 1981–2010 (Perry & Hollis, 2005). Communities were assessed as: preferred, Agrostis–Festucagrassland; moderately preferred, Molinia mire, bracken, Carex mire; and unpreferred, Nardus grassland and wet heath based on observational studies (Hunter, 1962) and stocking rates in experimental studies from the same region (Pakeman, 2004, 2014).
The experiment was made up of six blocks in three groups of two. Each block contained four plots of 3.3 ha. Plots were fenced in the winter of 2002–03 and the four grazing treatments allocated randomly to the plots in each block in spring 2003. The treatments were: (a) Continued, grazing at the same low intensity to previous management at three ewes per plot (0.9 ewe/ha = 0.135 Livestock Units [LU]/ha [European Commission, 2013], all ewes were without lambs) to act as the control for the experiment; (b) High, a tripling of sheep numbers to 2.7 ewe/ha (0.405 LU/ha), similar to levels seen on farms focussing on profitability; (c) Mixed, a partial substitution of sheep by cattle (0.6 ewe/ha and two cows per plot each with a single, suckling calf grazed for four weeks in autumn) keeping the overall offtake the same as in the Continued treatment to assess the effectiveness of cattle at increasing heterogeneity and diversity; and (d) None, no livestock present to represent agricultural abandonment. In all treatments, sheep were removed during the winter (December–April) and for short periods for routine farming operations.
2.2 Vegetation sampling
Twenty-five fixed points were marked per plot on the intersections of a square grid at 40-m intervals. At each fixed point, a vertical pin-frame of five pins, orientated consistently one metre east from the fixed point, was used to measure the cover of individual plant species and litter and the height of the uppermost contact (total 125 pins per plot). Sampling was carried out every three years from 2002 (before the fences were erected) to 2017 in late July/early August, prior to cattle being introduced to the plots. Species taxonomy follows Stace (2010).
2.3 Trait information
Functional trait data of all vascular plants were assembled from two sources (Table 1): BiolFlor (Klotz et al., 2002) and LEDA (Kleyer et al., 2008). Data from databases do not allow for intraspecific variation to be included but was the only practical approach for this size of study. Traits were selected because they were known to be key response traits that link performance to the environment (Lavorel & Garnier, 2002; Garnier et al., 2007; Pakeman, 2011) and effect traits that impact on ecosystem function (Lavorel et al., 2013). Canopy structure was coded to reduce it into one trait rather than three attributes (Pakeman, 2011).
| Traits | Abbreviation | Coding |
|---|---|---|
| Vegetative | ||
| log Canopy height (m)b | CanHt | Continuous |
| Canopy Structurea | CanStr | Erosulate (0), hemirosette (0.5), rosette (1) |
| Leaf Dry Matter Content (mg/g)b | LDMC | Continuous |
| log Leaf Size (mm2)b | LfSz | Continuous |
| Specific Leaf Area (mm2/mg)b | SLA | Continuous |
| Vegetative Spreada | Rhizome, stolon, no vegetative spread (0/1)c | |
| Reproductive | ||
| Flowering Start (month)a | StrtFlw | 1–12, treated as continuous |
| log Seed Mass (mg)a | SdMs | Continuous |
2.4 Data analysis
Data on the cover values of each vascular plant species, i.e. the total hits per needle across 125 needles per plot, were first converted to proportions and then into community-weighted mean (CWM) trait values (mean values for 2002 given in Table 2), which were analysed in two ways. Individual CWM trait changes were analysed with linear mixed models with a fixed model of Year × Treatment, and a random model of Plot nested within Block. Models were fitted with Residual Maximum Likelihood using lmer in lme4 (Bates et al., 2015) in R version 3.4.0 (R Core Team, 2017). Year was treated as a factor as some species were affected by the weather in various years. Proportion data (canopy structure, rhizome, stolon) were transformed to their log ratio prior to analysis (Aitchison, 1986). To assess the relative effects of the treatments, the mixed models were also run with Year as a linear variable.
| M15 | M25 | M6 | U20 | U4 | U5 | ||
|---|---|---|---|---|---|---|---|
| CanHt | Mean | 1.555 | 1.675 | 1.556 | 1.499 | 1.361 | 1.296 |
| CV | 0.013 | 0.009 | 0.014 | 0.014 | 0.008 | 0.007 | |
| Mean range | 0.805 | 0.749 | 0.764 | 0.887 | 0.646 | 0.613 | |
| LDMC | Mean | 342.5 | 323.0 | 308.1 | 305.1 | 290.2 | 324.1 |
| CV | 3.302 | 7.230 | 4.246 | 2.472 | 2.954 | 2.998 | |
| Mean range | 191.8 | 186.1 | 211.0 | 169.7 | 177.9 | 226.4 | |
| LfSz | Mean | 2.383 | 2.727 | 2.631 | 2.718 | 2.208 | 2.088 |
| CV | 0.051 | 0.033 | 0.021 | 0.118 | 0.052 | 0.035 | |
| Mean range | 1.560 | 1.726 | 1.513 | 3.370 | 1.955 | 1.815 | |
| SdMs | Mean | 2.695 | 2.349 | 2.368 | 1.863 | 2.266 | 2.512 |
| CV | 0.030 | 0.062 | 0.051 | 0.112 | 0.025 | 0.023 | |
| Mean range | 1.610 | 1.562 | 1.597 | 1.444 | 1.418 | 1.586 | |
| CanStr | Mean | 0.412 | 0.386 | 0.468 | 0.642 | 0.557 | 0.492 |
| CV | 0.081 | 0.151 | 0.076 | 0.034 | 0.032 | 0.036 | |
| Mean range | 0.429 | 0.403 | 0.428 | 0.500 | 0.443 | 0.443 | |
| SLA | Mean | 18.40 | 19.59 | 18.47 | 21.47 | 22.30 | 18.74 |
| CV | 0.262 | 0.346 | 0.313 | 0.709 | 0.581 | 0.640 | |
| Mean range | 14.63 | 17.07 | 16.59 | 19.77 | 20.44 | 20.75 | |
| StrtFlw | Mean | 6.050 | 6.474 | 6.148 | 5.971 | 5.710 | 5.499 |
| CV | 0.033 | 0.012 | 0.027 | 0.018 | 0.013 | 0.013 | |
| Mean range | 2.506 | 1.956 | 1.938 | 2.252 | 1.792 | 1.935 | |
| Stolon | Mean | 0.112 | 0.370 | 0.359 | 0.400 | 0.553 | 0.284 |
| CV | 0.136 | 0.167 | 0.135 | 0.149 | 0.068 | 0.115 | |
| Mean range | 0.140 | 0.239 | 0.470 | 0.297 | 0.312 | 0.459 | |
| Rhizome | Mean | 0.667 | 0.572 | 0.557 | 0.462 | 0.295 | 0.511 |
| CV | 0.059 | 0.109 | 0.080 | 0.113 | 0.122 | 0.077 | |
| Mean range | 0.148 | 0.114 | 0.252 | 0.144 | 0.115 | 0.253 |
A matrix of all the traits was analysed as the plant community response using principal response curves (PRC, van den Brink & ter Braak, 1999) in CANOCO 5 (ter Braak & Šmilauer, 2012). PRC plots the first principal component of treatment effects against time as deviations from the control treatment (Continued). Significance was tested using 999 Monte Carlo randomisations with Plots randomised within Blocks but with Years not permuted. The significance of treatment effects at intermediate time points was tested by successively removing later time points.
These analyses were carried out for the whole plot and for each community (listed in section 2.1 Study site and experimental design) with the same fixed and random models. Points were allocated to plant communities using their 2002 data with TABLEFIT (Hill, 1996). As communities varied in abundance and were not evenly distributed between plots and blocks, plots were weighted by the number of points of that community in the plot (Carex mire 144 points in 24 plots, wet heath 154/23, Molinia mire 62/17, Agrostis–Festucagrassland 44/17, Nardus grassland 159/21, bracken 37/17). The uneven distribution of communities between plots meant that models including habitat as a fixed factor failed to converge unless communities were merged even further.
3 RESULTS
3.1 Overall trajectories in traits after management change
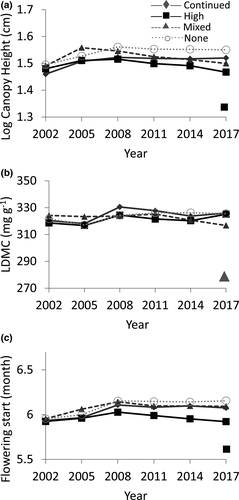
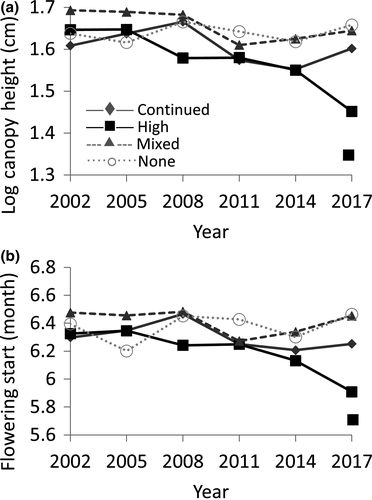
Across the experiment there was no impact of changing management intensity on the CWM traits of the vegetation; the first axis in the PRC explained only a small proportion of the variation (9.85%, p = 0.23; Table 3). Similarly, almost all CWM traits including canopy structure, LDMC, leaf size, SLA, vegetative spread by rhizome or stolon and seed mass showed no response (data not shown). By 2017 there was a small reduction in canopy height in the High treatment (Figure 1a, p = 0.015) and a reduction (becoming earlier) in the start of flowering (Figure 1c, p = 0.038).
| Explained variation (%) | Pseudo-F | p | |
|---|---|---|---|
| Whole plot | 9.85 | 12.6 | 0.230 |
| Carex mire (M6) | 9.19 | 11.6 | 0.184 |
| Wet heath (M15) | 15.85 | 20.5 | 0.035 |
| Molinia mire (M25) | 11.38 | 9.50 | 0.498 |
| Agrostis–Festuca grassland (U4) | 12.29 | 10.2 | 0.330 |
| Nardus grassland (U5) | 8.17 | 8.60 | 0.674 |
| Bracken (U20) | 21.89 | 20.5 | 0.006 |
3.2 Community-specific responses to grazing change
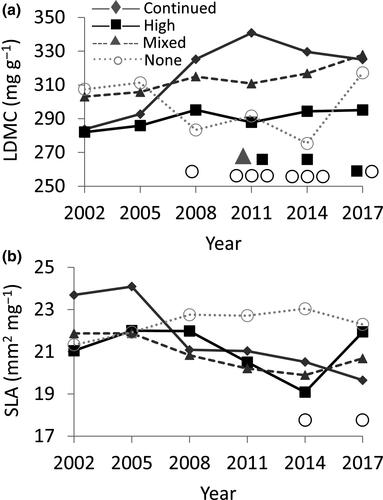
Similarly, in the most preferred vegetation type, Agrostis–Festucagrassland (U4), the proportion of variation explained by the first axis of the PRC was relatively small (12.3%; Table 3). However, by 2011 both increased grazing (High, p = 0.038) and removal of grazing (None, p = 0.034) reduced LDMC (Figure 2a). The removal of grazing also increased SLA by 2014 (p = 0.011; Figure 2b).
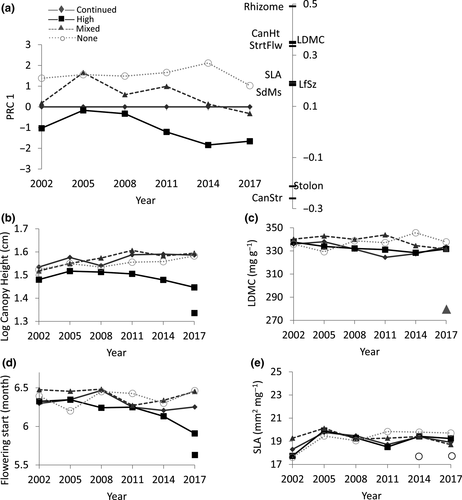
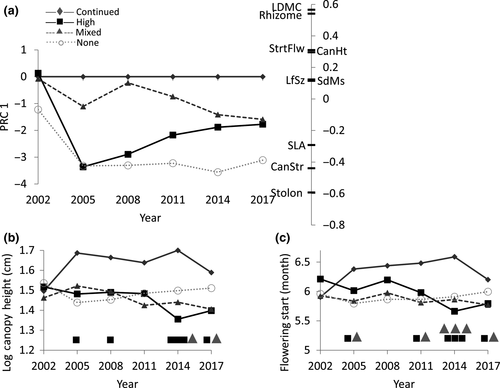
For the least preferred vegetation type, wet heath (M15), a larger proportion of the variation (15.85%, p = 0.035; Table 3) was explained by the first axis of the PRC. Traits associated with increased grazing were a stoloniferous growth form and a rosette growth form (high canopy structure score; Figure 3a), whilst reduced grazing was particularly associated with a rhizomatous growth form, later flowering and higher LDMC. Individual testing of traits revealed that increased grazing reduced weighted mean canopy height by 2017 (p = 0.036; Figure 3b), as well as bringing forward the start of flowering (p = 0.024; Figure 3d). Removal of grazing increased SLA by 2011 (p = 0.049; Figure 3e). In the other less preferred vegetation type, Nardus grassland (U5), there were no changes in community mean traits with time (not shown).
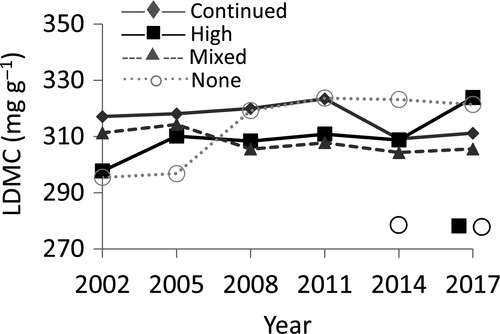
For the vegetation types of intermediate preference, increased grazing reduced canopy height by 2017 (p = 0.18; Figure 4a) and the start of flowering was brought forward (p = 0.028; Figure 4b) for Molinia mire (M25). Axis one of the PRC for bracken (U20) explained a high degree of variation (21.9%, p = 0.006; Table 3); however, all imposed treatments moved in the same direction (reduction of axis one score). A reduction in axis one score was associated with a rosette (high canopy structure score) and stoloniferous growth form, whilst an increase was associated with a rhizomatous growth form and increased LDMC (Figure 5a). However, only canopy height, a reduction in the High treatment by 2014 (p = 0.008; Figure 5b), and the start of flowering, brought forward in the High treatment by 2011 (p = 0.015; Figure 5c), had strong patterns as individual traits. For Carex mire (M6), both increased grazing by 2017 (p = 0.026) and removal by 2014 (p = 0.021) increased LDMC (Figure 6).
There were no consistent patterns for canopy structure, leaf size, vegetative spread mechanism or seed mass for any of the individual vegetation types (data not shown).
3.3 Cattle impacts
Across the whole plot mixed cattle and sheep grazing (Mixed) reduced LDMC compared to the same grazing offtake by sheep in the Continued treatment by 2017 (p = 0.025; Figure 1b),
In the preferred Agrostis–Festucagrassland, LDMC declined in the Mixed treatment by 2011 (p = 0.019; Figure 2a), as it did in the unpreferred wet heath (p = 0.030; Figure 3c). In the intermediately preferred bracken vegetation, the introduction of cattle contributed to a reduction in canopy height by 2014 (p = 0.049; Figure 5b) and an earlier start to flowering by 2011 (p = 0.016; Figure 5c).
4 DISCUSSION
4.1 Overall trajectories in traits after management change
Despite the significant changes in grazing management (tripling, removal) and the length of time the experiment has been running (15 years) there has been very little change in CWM traits when assessed at the plot scale. The exceptions were canopy height and start of flowering which declined and shifted earlier, respectively, under heavier grazing. The direction of these responses followed that seen in other studies (e.g. Díaz et al., 2007).
The small changes seen suggest that complex mosaics of habitats might be relatively resilient to changing management as the effects of the changed stocking densities are distributed across multiple vegetation types with different forage quality and diverse responses to different grazing intensities (Török et al., 2016).
The analysis of the response of LDMC to grazing across the whole plot did not back up previous evidence that the response of some traits to changing management intensity is not linear (Pakeman & Marriott, 2010). However, within Agrostis–Festucagrassland, the most similar type of grassland in the study to the Lolium perenne–Trifolium repens swards studied by Pakeman and Marriott (2010), LDMC did decline in both the High and None treatments. Strategies of plants to cope with frequent defoliation such as low investment per unit leaf area (high SLA, Cingolani et al., 2005; low LDMC, Cruz et al., 2010) are similar to those required for fast vertical growth where lower leaves are quickly shaded out (Grime, 1994).
4.2 Community-specific responses to grazing change
There were a number of expectations under hypothesis 2. Firstly, preferred communities would be more sensitive to the removal of grazing than an increase. Two traits showed a significant response for the preferred Agrostis–Festucagrassland, LDMC and SLA. For both the difference between the slopes (the interaction term fixed-effect estimate; Table 4) of the treatments compared to the Continued treatment was higher for the removal of grazing than for its increase; LDMC −2.34 for High vs. −3.43 for None, and SLA 0.18 for High vs. 0.33 for None (data from the mixed model with Year as a linear predictor). The lack of a response for canopy height might be because there was a limited trait range in this community (Table 2), suggesting species capable of responding were at low frequency. These data backed up this part of the hypothesis.
| Habitat | Treatment | CanHt | LDMC | SLA | StrtFlw |
|---|---|---|---|---|---|
| Whole plot | High | −0.004 ± 0.002 | −0.021 ± 0.328 | 0.005 ± 0.035 | −0.011 ± 0.004 |
| Mixed | −0.004 ± 0.002 | −0.817 ± 0.328 | 0.031 ± 0.035 | −0.003 ± 0.004 | |
| None | 0.000 ± 0.002 | 0.060 ± 0.328 | 0.072 ± 0.035 | 0.003 ± 0.004 | |
| Agrostis–Festuca grassland | High | −0.007 ± 0.004 | −2.344 ± 0.908 | 0.180 ± 0.095 | −0.013 ± 0.011 |
| Mixed | −0.009 ± 0.005 | −2.255 ± 1.008 | 0.149 ± 0.105 | −0.004 ± 0.012 | |
| None | −0.006 ± 0.004 | −3.429 ± 0.958 | 0.329 ± 0.100 | −0.008 ± 0.011 | |
| Molinia mire | High | −0.005 ± 0.004 | −0.520 ± 0.956 | −0.009 ± 0.072 | −0.013 ± 0.009 |
| Mixed | 0.001 ± 0.004 | −0.870 ± 1.004 | −0.108 ± 0.076 | 0.001 ± 0.009 | |
| None | 0.004 ± 0.004 | 0.841 ± 0.990 | −0.079 ± 0.075 | 0.001 ± 0.009 | |
| Bracken | High | −0.015 ± 0.007 | 0.004 ± 1.305 | 0.147 ± 0.156 | −0.051 ± 0.018 |
| Mixed | −0.014 ± 0.006 | −1.108 ± 1.032 | 0.117 ± 0.123 | −0.031 ± 0.015 | |
| None | −0.007 ± 0.006 | −0.433 ± 1.113 | 0.096 ± 0.133 | −0.013 ± 0.016 | |
| Carex mire | High | 0.001 ± 0.003 | 1.494 ± 0.570 | −0.024 ± 0.051 | −0.007 ± 0.007 |
| Mixed | −0.003 ± 0.002 | 0.169 ± 0.561 | −0.001 ± 0.050 | −0.011 ± 0.007 | |
| None | 0.002 ± 0.003 | 1.876 ± 0.616 | 0.047 ± 0.055 | 0.007 ± 0.008 | |
| Nardus grassland | High | −0.003 ± 0.003 | −0.115 ± 0.651 | −0.076 ± 0.058 | −0.002 ± 0.007 |
| Mixed | −0.002 ± 0.003 | −1.140 ± 0.639 | 0.079 ± 0.057 | 0.006 ± 0.007 | |
| None | 0.003 ± 0.002 | −0.152 ± 0.601 | 0.084 ± 0.054 | 0.010 ± 0.006 | |
| Wet heath | High | −0.007 ± 0.003 | −0.480 ± 0.441 | 0.032 ± 0.042 | −0.013 ± 0.008 |
| Mixed | −0.002 ± 0.003 | −0.912 ± 0.463 | 0.023 ± 0.044 | 0.009 ± 0.009 | |
| None | −0.002 ± 0.003 | −0.391 ± 0.436 | 0.089 ± 0.042 | 0.002 ± 0.008 |
For the least preferred community, wet heath, the expectation was reversed:, it was expected to have been more sensitive to increased grazing than to removal. Three traits showed a significant response, but only canopy height and start of flowering showed the expected direction of response: canopy height −0.007 for High vs. −0.002 for None and start of flowering −0.013 for High vs. 0.002 for None. The response of both canopy height and start of flowering to grazing could have been aided by the relatively high degree of variation in this community for these traits (Table 2) suggesting species capable of responding to changed conditions. For SLA it appeared that the response was contrary to expectations, with this trait being more responsive to grazing removal: 0.032 for High vs. 0.089 for None. This offers partial support for the hypothesis, two out of the three traits showing a significant change shifted in the expected direction. For the other unpreferred community, Nardus grassland, there was no effect of grazing change on the CWM traits tested. This was the commonest community, so the lack of responses is not due to a lack of power but potentially to a lack of species with traits to respond to reduced grazing as it had low variation in canopy height (Table 2).
Finally, it was expected that as grazing increased this increase would be most pronounced in moderately preferred communities and hence trait shifts would be higher (slopes steeper) than for the most and least preferred communities as these would already be exploited or continued to be ignored, respectively. Where trait shifts were significant, shifts in the Molinia mire community in the High treatment were of a similar order to those in the Agrostis–Festucagrassland and wet heath communities for canopy height (Molinia mire −0.005, Agrostis–Festucagrassland −0.007, wet heath −0.007) and for start of flowering (Molinia mire −0.013, Agrostis–Festucagrassland −0.013, wet heath −0.013). However, for the same two traits, slopes for the bracken community were considerably steeper (canopy height −0.015, start of flowering −0.051). For LDMC in the Carex mire community (1.49) the response was intermediate between that in the Agrostis–Festucagrassland community (2.34) and the small response in wet heath (−0.48). This suggests that of the intermediately preferred communities only bracken is seeing the high impacts of increased stocking levels (trampling impacts rather than grazing) that was predicted (Pianka, 1988; Augustine & McNaughton, 1998). Given that there is a response of some of the traits to increased grazing, and responses by individual species (Pakeman et al., 2019), it is possible that the Agrostis–Festucagrassland community is absorbing much of the grazing of the increased sheep numbers and that there is, in consequence, little spill-over to other communities apart from the bracken community which often has a similar understorey to Agrostis–Festucagrassland.
4.3 Cattle impacts
At the whole plot scale Mixed grazing was as effective as High sheep in reducing canopy height (High −0.004 vs. Mixed −0.004; Table 4) and more effective than the High treatment in reducing LDMC (High −0.02 vs. Mixed −0.82). Within the preferred Agrostis–Festuca grassland the rate of decline in LDMC was similar to that in the High treatment (High −2.34 vs. Mixed −2.26), whilst in the least preferred wet heath the decline in LDMC exceeded that of the High treatment (High −0.48 vs. −0.92) and in the moderately preferred Carex mire community there was no increase in LDMC as observed in the High treatment (High 1.49 vs. Mixed 0.17). In the bracken community, responses of canopy height (High −0.015 vs. Mixed −0.014) and start of flowering (High −0.051 vs. Mixed −0.031) were similar between the two treatments, but in the Molinia mire community responses of the same trait to cattle grazing were considerably smaller than under the High treatment (log canopy height High −0.005 vs. Mixed 0.001, start of flowering High −0.013 vs. Mixed 0.001).
These responses provide a mixed picture for the impact of cattle grazing suggesting that it is habitat-specific. Trampling impacts were substantial in the bracken community reflecting the sensitivity of bracken to cattle trampling (Williams, 1980) as well as the woody dwarf shrubs in the wet heath communities (Critchley et al., 2008); the whole plot responses are at least partly driven by these changes. The inconsistency between communities may reflect the different preferences of cattle and sheep for different species or the sensitivity of different species within those communities to trampling. Compared to sheep, it appears that cattle show less preference/impact on the Molinia mire community.
4.4 Ecosystem impacts
Given the small amounts of change in trait means detected over the 15 years of the experiment, the ecosystem level impacts are also likely to be small. Using the same experiment Smith et al.(2014a) showed that the main initial impact of removing or increasing grazing was to increase and decrease, respectively, the amount of carbon stored above-ground in tussocks. LDMC is correlated to leaf decomposition rates (Cortez et al., 2007; Quested et al., 2007), but given the small changes in LDMC over time, there is no evidence that litter is becoming more recalcitrant in the ungrazed plots to increase the amount of above-ground carbon. The exception to this is in the Carex mire community, where grazing removal did result in an increase in LDMC and likely slower decomposing litter.
The predominant carbon inputs into soils are, however, from root decomposition (Gill & Jackson, 2000). These are driven by the root traits of the species present in the experiment (Smith et al., 2014b), but as species change (Pakeman et al., 2019) and above-ground trait changes have been slow then this route of carbon input into soils is unlikely to have any significant impact on soil carbon storage under the different treatments. This information backs up modelled ecosystem carbon changes in the experiment which indicate very slow increases in the None treatment and slow declines in the High treatment (Smith et al., 2014a). Unless tree invasion takes place, abandonment/rewilding impacts on soil carbon in these upland grasslands will be slow.
Whilst trait and plant species changes appear slow, there have been demonstrable impacts on other biota in the experiment. Changes in vegetation structure have impacted on the breeding densities of meadow pipits (Anthus pratensis, Evans et al., 2015), higher under greater disturbance as a result of increased foraging access to invertebrate prey, and the densities of field voles (Microtus agrestis, Villar et al., 2014) and moths (Littlewood, 2008), higher where vegetation has been allowed to build up. It appears that whilst biodiversity responses to changed structure are rapid in upland grassland mosaics, the responses driven by trophic cascades (de Bello et al., 2010; Lavorel et al., 2013) may take many years to become apparent. However, there may be some faster changes to unmeasured responses such as increased flowering or increased individual leaf longevity in the ungrazed plots that may influence other trophic levels.
4.5 Implications for environmental policy
It is clearly evident from the responses outlined above that the mosaic of vegetation typical of large parts of the Scottish uplands is resistant to change. Tripling stocking density or removing livestock altogether had limited effects on species composition (Pakeman et al., 2019) and limited impact on the functional traits of that vegetation. This suggests policy changes or economic drivers will have limited short- to medium-term impacts on this vegetation. It also suggests that active restoration rather than rewilding may have to be followed to achieve increases in woodland cover (Deary & Warren, 2019). However, the impacts of management change will be more extensive on the animals present, so the slow changes evident in the vegetation may mask more rapid changes for other groups of species.
ACKNOWLEDGEMENTS
We thank the Woodland Trust and their Glen Finglas staff for hosting the experiment. We thank Anja Kunaver, Antonia Eastwood, Clare Trinder, Diana Gilbert, Eleanor Fitos, Eleanor Shield, Sally Westaway and the many students who assisted with collecting data, as well as Pete Dennis, Nick Littlewood and Darren Evans.
AUTHOR CONTRIBUTIONS
RJP conceived this research idea; DF led the team collecting the data; RJP performed statistical analyses; RJP with contributions from DF, wrote the paper; both authors discussed the results and commented on the manuscript.
Open Research
DATA AVAILABILITY STATEMENT
The vegetation data are available from the Dryad Digital Repository: https://doi.org/10.5061/dryad.dr554m2. Trait data were assembled from published sources.


