Genetic relationship of energy balance predicted from milk traits with fertility in Japanese Holsteins
Abstract
We predicted the energy balance of cows from milk traits and estimated the genetic correlations of predicted energy balance (PEB) with fertility traits for the first three lactations. Data included 9,646,606 test-day records of 576,555 Holstein cows in Japan from 2015 to 2019. Genetic parameters were estimated with a multiple-trait model in which the records among lactation stages and parities were treated as separate traits. Fertility traits were conception rate at first insemination (CR), number of inseminations (NI), and days open (DO). Heritability estimates of PEB were 0.28–0.35 (first lactation), 0.15–0.29 (second), and 0.09–0.23 (third). Estimated genetic correlations among lactation stages were 0.85–1.00 (first lactation), 0.73–1.00 (second), and 0.64–1.00 (third). Estimated genetic correlations among parities were 0.82–0.96 (between first and second), 0.97–0.99 (second and third), and 0.69–0.92 (first and third). Estimated genetic correlations of PEB in early lactation with fertility were 0.04 to 0.19 for CR, −0.03 to −0.19 for NI, and −0.01 to −0.24 for DO. Genetic improvement of PEB is possible. Lower PEB in early lactation was associated with worse fertility, suggesting that improving PEB in early lactation may improve reproductive performance.
1 INTRODUCTION
In recent years, increasing milk production in dairy cows has resulted in postpartum energy deficits (Hüttmann et al., 2009). Especially in early lactation, energy intake from feed cannot compensate for the energy requirement for milk production, and the energy balance (EB) tends to be negative (de Vries et al., 1999). Negative EB causes poor reproductive performance, metabolic disorders such as ketosis, and mastitis (Collard et al., 2000; Goff & Horst, 1997; Ingvartsen et al., 2003). Negative EB in early lactation is highly correlated with the interval to first ovulation and is known to affect conception rate (Butler, 2003; Butler & Smith, 1989). Cows with a smaller decline to negative EB and a faster recovery to positive EB also have fewer days open (DO) and shorter calving intervals (Carvalho et al., 2014; Patton et al., 2007).
There are several methods of calculating EB, including methods that measure all energy inputs (feed intake) and outputs (milk production, fetus, and growth) and methods that estimate EB from changes in body weight and body condition score (Friggens et al., 2007). However, these methods of calculating EB require detailed measurement items other than those easily obtained by herd tests, making it difficult to apply them to many cows and to obtain sufficient data for genetic evaluation (Coffey et al., 2001). There have been several reports on the heritability of EB (Becker et al., 2021, 2022; Berry et al., 2007; Buttchereit et al., 2011; Coffey et al., 2002, 2004; Hüttman et al., 2009; Spurlock et al., 2012), but owing to the difficulty of obtaining sufficient data, there have been very few reports of the genetic correlations of EB with fertility or disease traits (McParland et al., 2012). Becker et al. (2021) attempted to estimate the genetic correlations between EB and disease traits, but because of a limited number of data, the two-trait model did not converge. It is also difficult to perform genetic analyses by using multiple lactation data because of the limited number of such data (Spurlock et al., 2012). Nevertheless, multiple lactation analysis is important because the response to negative EB is expected to vary by parity (Wathes et al., 2007). In other words, for the genetic improvement of EB, it is necessary to predict EB and investigate its genetic characteristics by using large-scale data (McParland et al., 2012).
Milk composition traits such as fat and protein are known to reflect the energy status of cows. Energy deficit increases lipolysis, and the uptake of fatty acids mobilized from body fat increases, resulting in increased fat synthesis in the udder. Simultaneously, inadequate intake of carbohydrates causes insufficient protein synthesis by ruminal bacteria, and the flow of amino acids to the udder is compromised (Buttchereit et al., 2010). By using these physiological properties, reports have predicted EB (PEB) from milk composition traits (Friggens et al., 2007; Heuer et al., 2000; Løvendahl et al., 2010). Recently, EB was predicted by using information from mid-infrared spectrometry performed during routine milk analysis (McParland et al., 2012). The heritability of EB predicted by using this information was 0.10—not so different from the heritability of EB calculated as the difference between energy intake and energy expended of 0.16 (McParland et al., 2014). We developed an equation to predict EB from milk traits obtained in the Dairy Herd Improvement program (Nishiura et al., 2022). This equation consists of days in milk, milk yield, and milk composition. The prediction accuracy was improved by considering higher order terms and daily change for the explanatory variables, and the adjusted contribution ratio of the equation was 0.60. By applying this equation to test-day records of Holsteins in Japan, it is possible to elucidate the genetic characteristics of PEB and its genetic correlations with reproductive performance.
Here, we PEB during lactation by using test-day records and estimated the genetic parameters of PEB. We also estimated the genetic correlation of PEB with fertility traits in multiple lactations to examine the possibility of genetic improvement of EB in Holsteins in Japan.
2 MATERIALS AND METHODS
Animal Care and Use Committee approval was not required for this study, because the data used in the analysis were obtained from an existing database.
2.1 Data
The data used for the analysis came from test-day Holstein cow milk records collected by the Livestock Improvement Association of Japan. The records consisted of cows that calved from 2015 to 2019, with identified parents. All the cows were aged 18–45 months at the time of calving for their first lactation, 30–63 months for their second, and 42–79 months for their third. To predict EB, all lactation records used from the first three lactations covered days in milk (DIM) 6 to 305, and there needed to be a minimum of eight records per lactation. There were at least two cows for each herd test day. We excluded records greater than ±6σ from the mean for milk yield and milk composition (fat, protein, lactose, and solids not fat [SNF] %). For fertility, all the cows were aged 20–49 months at the time of first insemination for their first lactation, 32–67 months for their second, and 44–84 months for their third. There were at least two cows for each first-insemination herd test year, and all the first inseminations occurred in less than 365 days after parturition. There were 9,646,606 records from 576,555 cows: 4,266,239 records from 446,284 first-lactation cows; 3,238,894 records from 339,323 second-lactation cows; and 2,141,473 records from 224,642 third-lactation cows. The pedigree data used for the analysis were traceable back through three generations of cows with records. Traits for analysis were PEB from milk traits and fertility traits (conception rate at first insemination [CR], number of inseminations [NI], and DO). Data descriptions are given in Table 1.
| Trait | All lactations | 1st lactation | 2nd lactation | 3rd lactation | ||||
|---|---|---|---|---|---|---|---|---|
| Mean | SD | Mean | SD | Mean | SD | Mean | SD | |
| Milk yield (kg) | 31.26 | 8.20 | 28.54 | 6.28 | 32.87 | 8.58 | 34.25 | 9.24 |
| Fat (%) | 3.92 | 0.66 | 3.92 | 0.64 | 3.93 | 0.67 | 3.93 | 0.67 |
| Protein (%) | 3.32 | 0.34 | 3.32 | 0.32 | 3.34 | 0.36 | 3.31 | 0.36 |
| Lactose (%) | 4.50 | 0.20 | 4.56 | 0.18 | 4.46 | 0.19 | 4.43 | 0.20 |
| SNF (%) | 8.82 | 0.38 | 8.88 | 0.37 | 8.80 | 0.39 | 8.73 | 0.39 |
| CR | 0.35 | 0.48 | 0.37 | 0.48 | 0.33 | 0.47 | 0.33 | 0.47 |
| NI | 2.49 | 1.79 | 2.43 | 1.79 | 2.54 | 1.79 | 2.53 | 1.77 |
| DO | 156.95 | 95.72 | 152.55 | 97.08 | 159.33 | 94.45 | 162.10 | 94.51 |
- Abbreviations: CR, conception rate at first insemination; DO, days open; NI, number of inseminations; SNF, solids not fat.
2.2 Genetic analysis of PEB
The data used in the analysis were test-day records, so they were not recorded daily but once a month. dMY in this analysis means the difference between the present and last test-day MY divided by the number of days between the present and last test dates; we therefore did not have a record of PEB for the first test day after parturition.
The physiological background of EB can change by lactation stage, so we divided the lactation period into 10 stages of 30 days and treated the PEB in each lactation stage as a different trait. As we did not have the PEB for the first test day after parturition, and there were very few records in the first month after parturition, we deleted the records for the first lactation stage (6–35 DIM). If there were two or more records of PEB in one lactation stage, the first record in the stage was left in and the others were deleted, leaving one record per lactation stage.
: PEB in the sth lactation stage,
: the fixed effect of the hth herd test year of the sth lactation stage,
: the fixed effect of the ith region calving month of the sth lactation stage,
: the fixed effect of the jth calving age of the sth lactation stage,
: the partial regression coefficient of the sth lactation stage,
: the average days in milk of the sth lactation stage,
: the days in milk of the kth animal of the sth lactation stage,
: the additive genetic effect of the kth animal of the sth lactation stage,
: the random residual effect.
means the effect of days in milk within the lactation stage.
2.3 Relationships of PEB with fertility
We divided CR into two classes of conception or non-conception. We divided NI into eight classes of 1 to 8, and we deleted records that numbered 9 or more. We divided DO into 16 classes: the first class was up to 42 DIM, followed by classes of 21 days up to 357 DIM. We deleted records of more than 357 DIM. As the success or failure of the first insemination affected NI and DO, we considered that EB in early lactation was related to reproductive performance. Therefore, the average PEB up to 105 DIM (PEB105) was calculated for each fertility-trait class by each lactation, and PEB105 values among classes were compared by using Tukey's HSD (honestly significant difference) test.
: PEB105,
: the fixed effect of the hth herd test year,
: the fixed effect of the ith region calving month,
: the fixed effect of the jth calving age,
: the additive genetic effect of the kth animal,
: the random residual effect.
: observations of fertility traits (CR, NI, DO),
: the fixed effect of the pth herd insemination year at the first insemination,
: the fixed effect of the qth month at the first insemination,
: the fixed effect of the rth age at the first insemination,
: the random effect of the sth sire at the first insemination,
: the additive genetic effect of the kth animal,
: the random residual effect.
The variance–covariance components were estimated by Gibbs sampling, and the gibbsf90+ program (http://nce.ads.uga.edu/wiki/doku.php?id=readme.gibbsf90plus) was used. A single chain of 100,000 samples was generated, and the first 50,000 samples were discarded as burn-in. Posterior means and standard deviations for the model parameters were estimated based on the subsequent 50,000 samples. No systematic changes were found in the posterior means when 50,000 samples were plotted after the burn-in period.
3 RESULTS
3.1 Genetic analysis of PEB
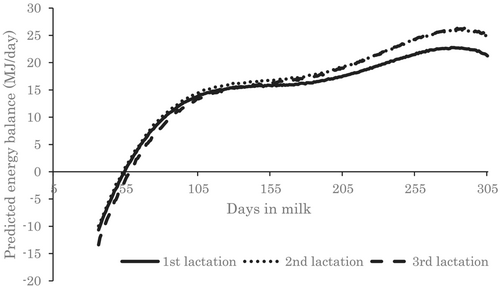
Daily average values of PEB were negative in early lactation and became positive at about 55 DIM (Figure 1). The degree of increase slowed down at about 100 DIM, increased further at about 200 DIM, and decreased slightly before 300 DIM. PEB was lower in the third lactation than in the first and second lactations in early lactation, and lower in the first lactation than in the second and third lactation in mid- to late lactation.
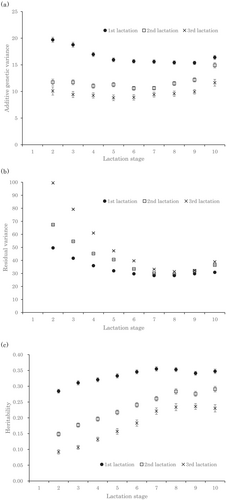
The estimated additive genetic variance was largest in the first lactation and became smaller as parity progressed (Figure 2a). Additive genetic variance did not vary markedly throughout the lactation period. The estimated residual variance was largest in the third lactation and became larger as parity progressed in early lactation, whereas there was little difference among parities in mid- to late lactation (Figure 2b). The estimated residual variance was large in early lactation and small in mid- to late lactation in all parities. The estimated heritabilities calculated from these variance components were highest in the first lactation (0.28–0.35), lower than the first lactation in the second lactation (0.15–0.29), and lowest in the third lactation (0.09–0.23) (Figure 2c). Estimated heritabilities were low in early lactation and high in mid- to late lactation.
The estimated genetic correlations among lactation stages were 0.85–1.00 in the first lactation, 0.73–1.00 in the second, and 0.64–1.00 in the third, and they became lower as parity progressed (Table 2). The estimated genetic correlations were high among neighboring lactation stages and became lower as the lactation stages became distantly separated.
| LS2 | LS3 | LS4 | LS5 | LS6 | LS7 | LS8 | LS9 | |
|---|---|---|---|---|---|---|---|---|
| 1st lactation | ||||||||
| LS3 | 0.98 | |||||||
| LS4 | 0.96 | 0.99 | ||||||
| LS5 | 0.94 | 0.98 | 1.00 | |||||
| LS6 | 0.92 | 0.97 | 0.99 | 1.00 | ||||
| LS7 | 0.90 | 0.95 | 0.98 | 0.99 | 1.00 | |||
| LS8 | 0.89 | 0.95 | 0.97 | 0.99 | 0.99 | 1.00 | ||
| LS9 | 0.86 | 0.92 | 0.95 | 0.97 | 0.98 | 0.99 | 1.00 | |
| LS10 | 0.85 | 0.90 | 0.93 | 0.95 | 0.97 | 0.98 | 0.99 | 1.00 |
| 2nd lactation | ||||||||
| LS3 | 0.99 | |||||||
| LS4 | 0.95 | 0.99 | ||||||
| LS5 | 0.94 | 0.98 | 0.99 | |||||
| LS6 | 0.89 | 0.95 | 0.98 | 0.99 | ||||
| LS7 | 0.86 | 0.93 | 0.97 | 0.98 | 1.00 | |||
| LS8 | 0.82 | 0.90 | 0.94 | 0.97 | 0.98 | 1.00 | ||
| LS9 | 0.79 | 0.86 | 0.92 | 0.95 | 0.97 | 0.98 | 1.00 | |
| LS10 | 0.73 | 0.80 | 0.87 | 0.90 | 0.93 | 0.95 | 0.97 | 0.99 |
| 3rd lactation | ||||||||
| LS3 | 0.96 | |||||||
| LS4 | 0.90 | 0.98 | ||||||
| LS5 | 0.86 | 0.96 | 0.99 | |||||
| LS6 | 0.82 | 0.93 | 0.97 | 0.99 | ||||
| LS7 | 0.78 | 0.89 | 0.94 | 0.99 | 1.00 | |||
| LS8 | 0.72 | 0.85 | 0.91 | 0.96 | 0.99 | 1.00 | ||
| LS9 | 0.70 | 0.82 | 0.86 | 0.93 | 0.96 | 0.98 | 0.99 | |
| LS10 | 0.64 | 0.77 | 0.82 | 0.90 | 0.93 | 0.95 | 0.97 | 0.99 |
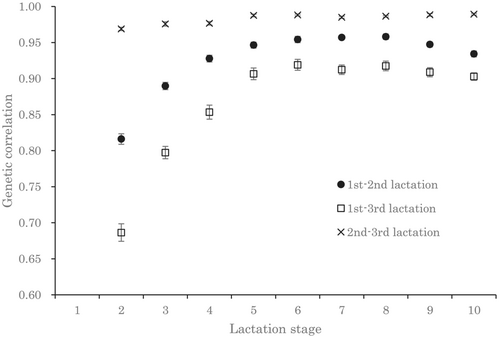
The estimated genetic correlations among parities were highest between the second and third lactations (0.97–0.99), lower between the first and second lactations (0.82–0.96), and lowest between the first and third lactations (0.69–0.92) (Figure 3). The estimated genetic correlations between primiparous and multiparous cows were low in early lactation and high in mid- to late lactation (Figure 3). The estimated genetic correlations among multiparous cows were stable throughout the lactation period.
3.2 Relationships of PEB with fertility
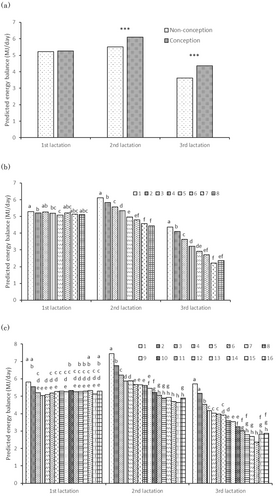
The mean number of days to first insemination was 87.5 (mode, 69) in the first lactation, 88.7 (mode, 74) in the second, and 90.5 (mode, 73) in the third. By 105 DIM, 78% of cows in their first lactation, 77% in their second, and 76% in their third had been inseminated at least once (data not shown). The mean PEB105 for each CR class did not differ significantly among classes in the first lactation, whereas in the second and third lactations, the PEB105 was significantly higher in the conception class than in the non-conception class (Figure 4a; P < 0.001). The mean PEB105 for each NI class mostly did not differ significantly among classes in the first lactation, but it was significantly higher in the classes with smaller NI values than in those with larger values in the second and third lactations (Figure 4b). The mean PEB105 for each DO class showed a trend toward higher in DO classes 1 and 2 (63 or fewer DO) in the first lactation. It then decreased in DO classes 1 to 10 (231 or fewer DO), as the DO became longer, in the second and third lactations (Figure 4c). There was little difference among DO classes 11 to 16 (more than 231 DO).
The estimated heritabilities of PEB105 were 0.38 for the first lactation, 0.22 for the second, and 0.13 for the third—slightly higher than the heritabilities of PEB estimated for each lactation stage, with similar trends by parity (Table 3). The estimated heritability of CR was 0.02; of NI, 0.03–0.04; and of DO, 0.04–0.06. The estimated genetic correlations between PEB105 and CR were 0.04 in the first lactation, 0.17 in the second, and 0.19 in the third. The estimated genetic correlations between PEB105 and NI were −0.03 in the first lactation, −0.19 in the second, and −0.19 in the third. The estimated genetic correlations between PEB105 and DO were −0.01 in the first lactation, −0.24 in the second, and −0.24 in the third (Table 3).
| Heritability | Genetic correlation | ||||||
|---|---|---|---|---|---|---|---|
| PEB105a | CR | NI | DO | PEB105-CR | PEB105-NI | PEB105-DO | |
| 1st lactation | 0.38 | 0.02 | 0.04 | 0.06 | 0.04 | −0.03 | −0.01 |
| 2nd lactation | 0.22 | 0.02 | 0.04 | 0.06 | 0.17 | −0.19 | −0.24 |
| 3rd lactation | 0.13 | 0.02 | 0.03 | 0.04 | 0.19 | −0.19 | −0.24 |
- a Heritabilities of PEB105 were the average of three multi-trait models; the SDs were <0.00.
4 DISCUSSION
4.1 Changes in PEB in lactation period and heritability of PEB
The lowest PEB values estimated in this study were −10.7 MJ/day in the first lactation, −9.9 MJ/day in the second lactation, and −13.4 MJ/day in the third lactation, all of which were at 36 DIM, not soon after parturition. The time when EB turned from negative to positive was 54 DIM in the first lactation, 53 DIM in the second lactation, and 58 DIM in the third lactation. Nishiura et al. (2022) reported that the mean EB was −15.56 MJ/day from 26 to 35 DIM and −8.13 MJ/day from 36 to 45 DIM, and that the EB turned from negative to positive at about 60 DIM. This result was in good agreement with our results. In other reports, the lowest EB was about −90 to −30 MJ/day, and the EB turned from negative to positive at about 40–100 DIM (e.g., Friggens et al., 2007; Gaillard et al., 2016; Hüttmann et al., 2009). Although PEB was not estimated for the first month after parturition owing to a lack of data, extrapolation would have resulted in a range soon after parturition similar to that of the values in the literature. In previous reports, the greater the parity, the more negative the lowest value of EB was, and the later the time when EB turned from negative to positive (de Vries et al., 1999; Friggens et al., 2007; Gaillard et al., 2016). In contrast, our estimated PEB values differed little between the first and second lactations, although a trend similar to that in the literature was observed for the third lactation. Therefore, our estimated PEB values were consistent with the trend of EB in these previous reports.
Our heritability estimates of PEB were similar to those in recent reports (0.03–0.34) of the heritability of EB as determined by energy input and output (e.g., Buttchereit et al., 2011; McParland et al., 2014; Spurlock et al., 2012). There have been very few multi-parity analyses of the heritability of EB; Spurlock et al. (2012) estimated heritabilities in the first and second lactations and reported that, in some cases, the heritability estimate was 1 in some lactation stages because of bias from the small number of data. We found here that heritability was higher in the first lactation and lower in the second and third lactations; this was attributable to both additive genetic variance and residual variance. The additive genetic variance was higher in the first lactation, and the estimated residual variance was higher in the second and third lactations in early lactation. The large residual variance estimated in early lactation was consistent with previous reports of milk traits and should also be true for EB predicted by using milk traits. This may be due to the fact that uncontrollable environmental factors are likely to occur in early lactation (Rekaya et al., 1999; Masuda & Suzuki, 2008); especially in multiparous cows, the dry period influences early lactation (Tong et al., 1979). Such environmental factors were not considered in our model. In terms of additive genetic variance, the changes in milk traits with parity vary among reports (Hagiya, 2010). Negative EB causes metabolic disorders such as ketosis (LeBlanc, 2010; McArt et al., 2013), and metabolic disorders such as ketosis occur more frequently in multiparous cows, increasing the risk of selection (Lean et al., 2023). Here, we found no difference in PEB means between cows with records in all lactations and those with records in only the first lactation, suggesting that selection has little effect on the decrease in additive genetic variance.
4.2 Genetic correlations of PEB among lactation stages or parities
The estimated genetic correlations of PEB were very high among neighboring lactation stages in all lactations and were still as high as 0.96–1.00 in the third lactation, which had the lowest values. Hüttmann et al. (2009) estimated the genetic correlations of EB as −0.24 to 0.99 between 11 and 30 DIM and 31–180 DIM at 30-day intervals. The correlations were high among neighboring lactation stages in early lactation, but they were low between the early and mid-lactation stages and negative between 11–60 DIM and 121–150 DIM and between 61–120 DIM and 151–180 DIM. Buttchereit et al. (2011) estimated a non-significant negative genetic correlation of EB between 15 and 120 DIM and between 15 and 180 DIM; they concluded that EB soon after calving was a genetically different trait from EB in mid-lactation. On the other hand, Buttchereit et al. (2011) also estimated the genetic correlations of EB as 0.82 between 60 and 120 DIM and 0.67 between 120 and 180 DIM. Among DIM classes divided at 50-day intervals after parturition up to 305 DIM, Berry et al. (2007) estimated the genetic correlations of EB to be 0.72–1.00 up to 250 DIM. However, the genetic correlations between 251–305 DIM and 51–100 DIM and between 251–305 DIM and 101–150 DIM were very low (0.03 and 0.04). Therefore, they said that if the goal was to improve EB in early lactation, then EB in mid- to late lactation had low predictive ability. Here, we were unable to obtain PEB values for soon after parturition, so we could not estimate the genetic correlations of PEB for that time. However, negative, or extremely low, genetic correlations were not estimated among lactation stages, so it was difficult to say that PEB differed genetically among the different lactation stages. Buttchereit et al. (2011) estimated significant genetic correlations of FPR (0.55–0.93) among 15, 60, 120, and 180 DIM; these values were very similar to the genetic correlations of PEB among lactation stages in our study. FPR is an indicator trait of EB and was included as an explanatory variable in our PEB estimation equation, which had the largest contribution (partial R2 = 0.11) among milk traits (Nishiura et al., 2022).
The estimated genetic correlations of PEB were greater than 0.9 among all parities from lactation stage 5 (126–155 DIM) onward. The genetic correlations of PEB between the second and third lactations were as high as 0.97–0.99 for all lactation stages. On the other hand, the genetic correlations of PEB between the first and second lactations were 0.69–0.93 in early lactation up to lactation stage 4. These values were similar to the genetic correlations of FPR among parities, which are particularly low in early lactation (Nishiura et al., 2015). Coffey et al. (2002) reported that the changes of EB in the lactation period differed genetically by parity. The genetic correlation of EB between primiparous and multiparous cows up to 120 DIM, as estimated by Coffey et al. (2002), was not very high, similar to our results. In other words, PEB in early lactation should be treated as genetically different between primiparous and multiparous cows.
4.3 Relationships of PEB with fertility
Because primiparous cows and multiparous cows have different feed intakes and milk production, as well as different metabolic and endocrine profiles, their responses to negative EB may also differ (Macmillan et al., 2018; Wathes et al., 2007). Wathes et al. (2007) reported that body condition score and blood urea level explained delayed conception in primiparous cows, whereas blood leptin level, serum non-esterified fatty acid content, blood urea level, serum insulin-like growth factor I, and peak milk yield explained delayed conception in multiparous cows. Macmillan et al. (2018) reported that some EB indices varied significantly, but only in third or more parity, among classes of days to first ovulation. Nishiura et al. (2022) reported that there were no significant differences in days to first insemination, days to conception, NI, and CR between high and low EB classes in primiparous cows. However, these fertility traits were significantly worse in the low EB class in multiparous cows, a finding that was consistent with our results.
Our heritability estimates of CR and DO were similar to those in a Japanese dairy cattle population, as published by the National Livestock Breeding Center (https://www.nlbc.go.jp/english/the-development-and-implementation-of-animal-evaluation-system/detailed-dairy-cattle-evaluation-information/genetic-evaluation-for-female-fertility-traits.html). Our genetic correlations of PEB105 were positive with CR and negative with NI and DO in all lactations, suggesting that a lower PEB in early lactation was associated with a lower CR, higher NI, and longer DO—that is, poorer reproductive performance. The genetic correlations of PEB105 with all fertility traits were close to zero in the first lactation, whereas those in the second and third lactations were estimated at about ±0.2—greater value than those in the first lactation. The genetic correlations of PEB with fertility traits were consistent with the phenotypic relationship shown in Figure 4. There was a reasonable relationship between PEB and fertility, but this relationship was stronger in multiparous cows than in primiparous cows. This may be due to the relationship between FPR—one of the explanatory variables of PEB—and fertility in multiparous cows. Puangdee et al. (2017) estimated higher genetic correlations between FPR and DO in the second lactation (0.24–0.37) than in the first (−0.04 to 0.18). Dechow et al. (2001) estimated the genetic correlations of body condition score, as an EB indicator, with fertility traits in the first and second lactations. They found higher values in the second lactation than in the first, suggesting that cows genetically prone to negative EB tend to have more days before first insemination; this trend was particularly pronounced in the second lactation.
Our results showed that genetic improvement was possible, with PEB heritabilities of 0.09–0.35. Also, we estimated a desirable genetic correlation between PEB and fertility traits in early lactation in multiparous cows, indicating that genetic improvement of PEB may improve reproductive performance in multiparous cows. Recently, in Japan, it has become possible to obtain new metabolic indices, such as information on milk fatty acid, in dairy herd tests. As these new metabolic indices are thought to reflect EB during lactation, it is possible that the estimation equation can be improved by using new traits such as milk fatty acids in the future.
In conclusion, PEB estimated from milk-production traits in the first three lactations showed the same patterns of change in the lactation period as the measured EB, and genetic improvement is possible. The genetic correlations of PEB among lactation stages were high and considered to be genetically identical, but genetic correlations among parities were not as high in early lactation between primiparous and multiparous cows, indicating that there is a possibility of genetic differences. Lower PEB in early lactation was associated with worse reproductive performance, and this trend was stronger in multiparous cows than in primiparous cows. These results suggest that improving PEB in early lactation may improve reproductive performance.
ACKNOWLEDGMENTS
This work was supported by a grant from the Japan Racing and Livestock Promotion Foundation (Minato, Tokyo, Japan).
CONFLICT OF INTEREST STATEMENT
The authors declare no conflict of interest.


