Physiological changes during feeding and rumination in cows
Abstract
In this study, we investigated the physiological changes in cattle during feeding and rumination. We collected blood samples every 5 min by using an automated blood sampling system and simultaneously recorded feeding, ruminating, and other behaviors using a video camera. Plasma non-esterified fatty acid (NEFA) concentrations continuously decreased during feeding and decreased temporarily during rumination. Plasma glucose concentration continuously decreased during feeding and remained stable during rumination. During feeding and rumination, there were no characteristic increases and subsequent decreases in plasma insulin and growth hormone (GH) concentrations, although insulin concentrations were positively correlated with glucose concentration. NEFA concentrations were not correlated with GH and insulin concentrations. In terms of chewing behavior, feeding and rumination are similar; therefore, the changes in metabolites such as NEFA might have been the same. Combination of behavioral observations and application of an automated blood sampling system could contribute to new findings on behavioral and physiological changes regarding the temporary decrease in plasma NEFA concentration during rumination in ruminants.
Introduction
The behavior of animals can be a clear indicator of their physiological and physical states. Feeding commonly reduces plasma growth hormone (GH) levels, as has been shown in sheep (Trenkle 1989), calves and humans (Tannenbaum et al. 1975), although its levels are known to increase with feeding in lambs (Francis et al. 2000), steers (Etherton & Bauman 1998) and rats (Tolle et al. 2002). Feeding-induced reduction in plasma GH levels becomes more apparent in adult animals under restricted feeding or at a low feeding frequency during the day, because these conditions are known to increase basal GH levels and pulse amplitude (Etherton & Bauman 1998). Numerous studies have shown that GH effectively alters nutrient use in growing animals such that there is marked reduction in the amount of carcass fat. Chronic elevation of GH levels is associated with increased plasma non-esterified fatty acid (NEFA) levels (Sherwin et al. 1983; Davidson 1987; Hettiarachchi et al. 1996). Insulin level increases within minutes after ingestion of food (Allen et al. 2005), with cephalic-phase pancreatic B-cell secretion of insulin in ruminant animals stimulated by projections from the abomasum, pyloric, and duodenal branches of the vagus nerves (Herath et al. 1999).
As described above, numerous studies have investigated the physiological changes during feeding; however, changes during rumination in ruminant animals have been poorly studied for several reasons. Direct observation of animal behavior requires extensive labor and time. Although feeding behavior can be controlled by scheduled feeding, ruminating behavior is beyond experimental control because it occurs sporadically for 10–30 min (Gordon & McAllister 1970). Further, there is a concern about the negative impact on the behavior of cows when experimenters stand beside them. Therefore, blood sampling may not always correspond with every period of ruminating behavior. However, this behavior is essential for the maintenance of homeostasis in ruminants; hence, clarifying the physiological changes associated with ruminating behavior is essential.
This study aimed to determine the changes in hormones such as insulin and GH and metabolites such as glucose and NEFA that occur in cattle during feeding and rumination.
Materials and Methods
Animals
We studied four non-lactating, farrow Holstein cows (mean body weight, 721.5 ± 37.2 kg; mean age, 9 ± 4 years) housed individually and chained loosely in stalls. The feeding conditions were designed in accordance with the Japanese feeding standards for dairy cattle (Japan Livestock Industry Association). Timothy haylage (crude ash, 10.6%; crude protein, 9.8%; crude fat, 1.1%; crude fiber, 32.5%; neutral detergent fiber, 62.7%; and nitrogen free extract, 42.6%), and concentrate meals (crude ash, 8.0%; crude protein, 13.0%; crude fat, 2.0%; and crude fiber, 8.0%) were provided twice daily at 09.30 and 16.30 hours to meet 110% of a cow's daily metabolizable energy requirement. Mineral blocks and water were provided ad libitum. The animals were acclimated to these experimental conditions for 2 weeks. All animals received humane care, as outlined in the Guide for the Care and Use of Experimental Animals (National Agricultural Research Center for the Tohoku Region 2011).
Video observation of feeding and ruminating behaviors
The behavior of the cows was recorded using a video camera. A single camera recorded an entire row of stalls. The cameras were placed 1.5 m from the nearest stall. The behaviors of the cows were analyzed using video observation. Chewing activity was estimated concurrently through visual observation of digital videos at 30-s intervals.
Blood sampling
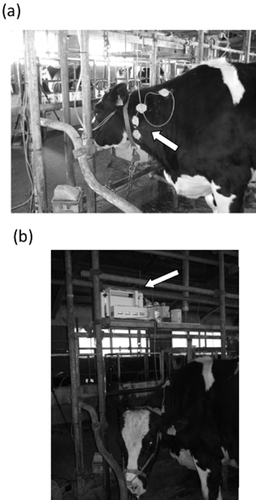
Blood samples were automatically collected using the computer-aided automated blood sampling system (DR-II; Eicom, Kyoto, Japan) via a catheter implanted in the jugular vein of each cow (Fig. 1). The placement of the catheter allowed blood collection irrespective of whether the cows were standing or lying down. Whole blood samples (1500 μL) were collected every 5 min between 08.00 and 16.00 hours in heparin-rinsed vials by using a fraction collector. The time required for each blood collection, tube washing and heparin administration to the catheter was less than 5 min; hence, the next blood sampling was not affected. Samples were refrigerated by the cooling function of the equipment, collected every 2 h, and centrifuged at 1000 × g for 10 min at 4°C. Plasma was aspirated and stored at −20°C until further analysis.

Pictures showing a cow fitted with an automated blood sampling device. A catheter is implanted in the jugular vein of the cow (indicated by an arrow) and is connected to a tube (a). The tube is connected to the device (indicated by an arrow) that is placed above the cow (b).
Insulin and GH assay
Plasma insulin concentration was measured using a commercially available ELISA kit (Shibayagi Co., Ltd, Nagano, Japan) and bovine insulin as the standard, following the instructions provided by the manufacturer. The intra- and inter-assay coefficients of variation were 4.9% and 6.2%, respectively. The double-antibody radioimmunoassay method was used to measure GH concentration, as previously described (Kuhara et al. 1991) with slight modifications. The intra- and inter-assay coefficients of variation were 5.6% and 7.9%, respectively.
Metabolite determination
The concentrations of plasma NEFA, glucose, and urea nitrogen (BUN) were determined using a commercial kit (Wako Pure Chemical Industries, Osaka, Japan) and a Hitachi 7070 autoanalyzer (Hitachi, Tokyo, Japan).
Statistical analysis
All descriptive statistical analyses were performed using the SAS statistical software package (SAS Institute Inc., Cary, NC, USA). The data were expressed as mean ± SEM. Total areas under the curve (AUC) were estimated as before and after feeding summary variables and calculated using the trapezoidal rule as units of concentration × 10 min. The significance of the difference between each before and after feeding values was determined by paired t-test. AUC values were estimated as before, at the start of, and after rumination summary variables and calculated as units of concentration × 15 min. Significance was determined using two-way repeated measures analysis of variance (ANOVA) and Bonferroni's multiple comparison tests for analysis of AUC. The significance level was set at P < 0.05.
Results
In this experiment, each cow maintained feeding behavior for 49 ± 5.0 min until the entire feed was consumed and repeated ruminating behavior 3–5 times for periods of 16 ± 4.4 min. The use of an automated blood sampling system allowed the measurement of the changes in plasma metabolites and hormones during feeding and ruminating behaviors.
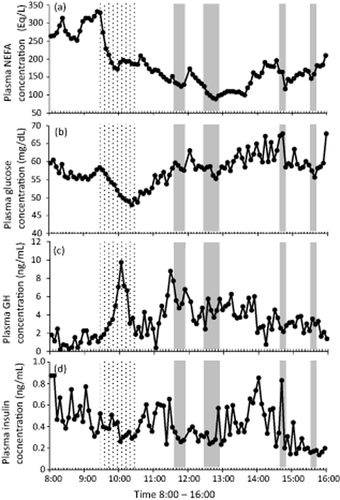
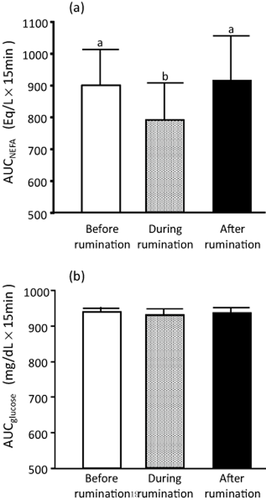
Figure 2a shows plasma NEFA concentrations of a typical cow. In all the cows showing feeding behavior, the plasma NEFA concentration continuously decreased during feeding. The AUC values for NEFA concentration were lower during the first 10–30 min after feeding than those before feeding (Table 1). Plasma NEFA concentrations also decreased during ruminating behavior. The AUC values for NEFA during ruminating were significantly lower than those before and after ruminating (Fig. 3a). There was no significant difference in AUC before and after ruminating.

Representative changes over time in plasma non-esterified fatty acid (NEFA) (a), glucose (b), growth hormone (GH) (c), and insulin (d) concentrations, during feeding and rumination. The shaded regions indicate feeding behavior and the gray regions indicate ruminating behavior.

The area under the curve (AUC) of non-esterified fatty acid (NEFA) (a) and glucose (b) before, from the start of, and after rumination summary variable; the rule is calculated in units of concentration × 15 min. The values are means ± SEM. Values with different letters are significantly different (P < 0.05).
| −10–10 min | 0–10 min | 10–20 min | 20–30 min | 30–40 min | 40–50 min | 50–60 min | 60–70 min | 70–80 min | |
|---|---|---|---|---|---|---|---|---|---|
|
AUCNEFA (Eq/L × 10 min) |
709.9 ± 71.8 | 646.8 ± 61.3* | 636.1 ± 46.1* | 611.5 ± 53.8* | 602.5 ± 41.1 | 609.6 ± 35.1 | 612.1 ± 20.7 | 593.3 ± 35.6 | 578.3 ± 53.5 |
|
AUCglucose (mg/dL × 10 min) |
621.7 ± 17.7 | 600.6 ± 29.7 | 572.0 ± 33.0 | 547.2 ± 41.7 | 541.0 ± 38.0* | 543.8 ± 39.6* | 557.5 ± 38.6* | 570.5 ± 34.9 | 586.3 ± 28.1 |
- Summary variable calculated as units of concentration × 10 min. The values are means ± SEM. Asterisks indicate probability level of P < 0.05 assessed by paired t-test.
Figure 2b shows plasma glucose concentrations of a typical cow. In all the cows showing feeding behavior, plasma glucose concentrations continuously decreased until feeding behavior ended. After 30–60 min from the start of feeding, the AUC values for glucose concentration were lower those before feeding (Table 1). However, there were no characteristic changes in plasma glucose concentration during rumination. Further, there were no characteristic changes in BUN concentrations during feeding or rumination.
Figure 2c shows plasma GH concentrations of a typical cow. There were no characteristic changes in plasma GH concentrations during feeding or rumination. GH concentrations were not correlated with NEFA concentrations (data not shown).
Figure 2d shows plasma insulin concentrations of a typical cow. There were no characteristic increases or subsequent decreases in plasma insulin concentration during feeding or rumination. Although during feeding and rumination, insulin concentration was positively correlated with glucose concentration, there was no significant difference in the AUC for insulin (data not shown).
Discussion
Manually collecting blood samples continuously at short intervals is very difficult because it is a cumbersome task and, in the case of mice and rats, there is insufficient blood for large samples. In this study, we used the automated blood sampling system to collect blood samples every 5 min without diluting the blood with saline containing heparin sodium. In addition, the blood sampling system eliminated concerns regarding how cow behavior would be affected by the presence of an experimenter. To our knowledge, this is the first report on physiological changes during rumination. Each cow maintained feeding behavior for 49 ± 5.0 min and repeated ruminating behavior 3–6 times for periods of 16 ± 4.4 min. In some situations, the duration of individual periods of rumination behavior in this study were short. Previous investigators recognized the importance of rumination in maintaining normal rumen function. Balch (1971) associated chewing time with hay quality, recognizing the importance of particle-size reduction and the rate of passage in cattle; similar findings were reported by Pearce and Moir (Pearce & Moir 1964) in sheep. Therefore, determining endocrine levels during ruminant feeding and ruminating necessitates the analysis of feeding management and diet composition.
In non-ruminants, feeding behavior increases plasma glucose levels, which can change the plasma insulin concentration. However, in this study, the plasma glucose levels in cows decreased during feeding behavior. In non-ruminants, chewing behavior is used as a synonym for feeding behavior, because feeding behavior is thought to increase plasma glucose concentrations due to the digestion and absorption of carbohydrates. However, in ruminants glucose concentration decreases after consumption of meals, as previously reported in steers (Veira et al. 1994), sheep (Bassett 1971) and lactating ewes (Thye et al. 1970). In ruminants, such a decrease most probably results from an increased tissue uptake of glucose stimulated by the postprandial increase in insulin secretion coupled with a low portal absorption of glucose. In this study, glucose decreased gradually during feeding behavior, but there was no significant decrease in plasma insulin levels. However, insulin concentration positively correlated with glucose concentration during feeding behavior. Plasma insulin was likely affected by the decrease in glucose caused by feeding behavior.
Although there was no significant decrease in glucose levels during rumination, glucose concentration positively correlated with insulin concentration, and in some cases, glucose levels decreased slightly during rumination. This suggests that chewing behavior itself induces diminished blood glucose levels.
The observed decrease in NEFA concentration during feeding is similar to the pattern previously reported in ruminants (Bassett 1971; Brockman & Laarveld 1986). Decreased NEFA concentrations are suggested to be due to meal ingestion causing reduced GH secretion, which may impair GH-releasing factor activity. However, in the present study there was no decrease in GH during feeding behavior. A noteworthy fact was that plasma NEFA decreased during feeding behavior without causing a change in plasma GH concentration. In fact, there was no correlation between GH and NEFA during feeding behavior. Insulin has been thought to not only stimulate glucose uptake by cells but also inhibit the release of fatty acids from adipose tissue by decreasing the activity of lipase. However, in this study there was no characteristic change in plasma insulin concentration corresponding with the time of feeding. Therefore, the decrease in NEFA concentration was probably not because of a change in GH and insulin. Changes in GH were probably related to the nutritive composition of food, while those in NEFA were caused by the chewing action while feeding.
Plasma NEFA concentration also decreased during ruminating behavior. To our knowledge, this is the first report on the investigation of plasma metabolite concentrations during rumination. Although feeding behavior can experimentally be controlled by providing food, rumination behavior occurs sporadically and irregularly, and hence cannot be controlled. Therefore, measuring the changes in metabolites during rumination has been difficult. In this study, we used the automated blood sampling system to measure changes in plasma NEFA concentration. Although plasma GH and insulin levels have been suggested to be able to change plasma NEFA concentration, there was no change in plasma NEFA concentration during rumination. This result is similar to the trend noted during feeding behavior. Although feeding behavior is induced by appetite, chewing and swallowing are common behaviors to both feeding and rumination. Unlike in non-ruminants, ruminant absorption of carbohydrates is prevented by rumen fermentation that produces and absorbs volatile fatty acids. Therefore, the changes were probably similar in feeding and rumination behaviors. Otherwise, in general, like GH, epinephrine can also change plasma NEFA (McCutcheon & Bauman 1986) and glucose (Erickson et al. 1990) levels. Epinephrine release is a crucial component of the fight-or-flight response of the sympathetic nervous system. Additionally, dopamine has been reported to provoke rumination in sheep when injected as a bolus into the celiac artery or the left gastric artery (Bueno et al. 1983; Stafford & Leek 1988). Further, chewing gum has been suggested to reduce stress in humans (Smith 2010; Smith et al. 2012). Therefore, rumination induced by dopamine may cause relief from stress and may reduce plasma NEFA concentrations by decreasing epinephrine.
In conclusion, we showed for the first time that plasma NEFA concentration changes during ruminating behavior in cows. Our findings suggest that further studies are required to determine the mechanisms underlying physiological changes during rumination.
Acknowledgments
The authors thank the staff of the Ruminants and Field Management Section, NARO Tohoku Agricultural Research Center, for their technical assistance and animal management.


