Isolation and characterization of Toll-like receptor 21 and 22 genes from Nile tilapia, Oreochromis niloticus (Linnaeus)
Abstract
In the present study, we obtained the full-length cDNA sequences of TLR21 and TLR22 from Nile tilapia (Oreochromis niloticus) (OnTLR21 and OnTLR22, respectively). The gene structure and expression patterns of OnTLR21 and OnTLR22 were also studied in order to understand the function of these genes in tilapia immunity. The OnTLR21 gene was 3196 bp in length, with an open reading frame (ORF) of 2940 bp encoding 979 amino acid residues and with no introns. The OnTLR22 gene contained three exons and two introns, with an ORF of 2886 bp, encoding 961 amino acid residues. The TLR family motifs, that is leucine-rich repeat (LRR) domains and Toll/interleukin (IL)-1 receptor (TIR) domains, are conserved in the putative OnTLR21 and OnTLR22 proteins. Quantitative real-time PCR (qRT-PCR) analysis revealed the presence of the OnTLR21 transcript in 10 tissues of healthy fish, with the highest expression level in the gill and the lowest expression level in the liver. In contrast, the highest expression level of OnTLR22 was detected in the spleen, while the lowest expression level was in the liver. The expression pattern of TLR during embryonic development showed that the expression levels of OnTLR21 significantly increased from 2.5 to 6.5 days post fertilization (dpf), decreased at 7.5 dpf and increased at 8.5 dpf. While the expression levels of OnTLR22 significantly decreased from 3.5 dpf, and there were no significant differences from 3.5 to 8.5 dpf. Upon stimulation with an intraperitoneal injection of Streptococcus agalactiae, the expression levels of OnTLR21 and OnTLR22 were downregulated in the spleen, kidney and gill. These results may indicate that OnTLR21 and OnTLR22 play important roles in mediating the response protection against S. agalactiae in Nile tilapia.
Introduction
Toll-like receptors (TLRs), type I transmembrane proteins, are a large group of receptors that are essential components of the innate immune system of invertebrates and vertebrates. TLRs play a pivotal role in binding with their respective ligands, such as flagellin, lipoprotein, nucleic acid, lipopolysaccharide (LPS) and lipoteichoic acid (Akira, Uematsu & Takeuchi 2006; Kawai & Akira 2010). These are essential to the potentially pathogenic microbes. TLR families are evolutionarily conserved and consist of an extracellular leucine-rich repeat (LRR) domain and a Toll/interleukin-1 receptor (TIR) domain.
Twenty TLR members have been identified in fish species (Zhang, Liu, Rajendran, Sun, Zhang, Sun, Kucuktas, Liu & Liu 2013), and six fish-specific TLRs have been identified, including TLR21 and TLR22. TLR21 and TLR22 genes have been isolated and characterized in various fish species, including zebrafish (Danio rerio) (Jault, Pichon & Chluba 2004), grass carp (Ctenopharyngodon idella) (Lv, Huang, Li, Luo, Liao, Zhu & Wang 2012; Wang, Shen, Pandit & Li 2013), Antarctic bullhead (Notothenia coriiceps) (Ahn, Shin & Park 2014), Atlantic cod (Gadus morhua) (Sundaram, Kiron, Dopazo & Fernandes 2012), pufferfish (Takifugu rubripes) (Oshiumi, Tsujita, Shida, Matsumoto, Ikeo & Seya 2003), orange-spotted grouper (Epinephelus coioides) (Ding, Lu, Hou, Li, Liu, Zhang & Lin 2012; Li, Luo, Dan, Qiao, Huang & Li 2012) and yellowtail (Seriola lalandi) (Reyes-Becerril, Ascencio-Valle, Alamillo, Hirono, Kondo, Jirapongpairoj & Angulo 2015; Reyes-Becerril, Ascencio-Valle, Hirono, Kondo, Jirapongpairoj, Esteban, Alamillo & Angulo 2016). TLR21 and TLR22 in the same bony fish are differentially expressed in all of the tissues. For example, TLR21 is highly expressed in the skin of grass carp (Wang et al. 2013), while the highest mRNA levels of TLR22 are detected in the gill of grass carp (Su, Heng, Huang, Peng, Yang & Li 2012). The injection of grass carp with Aquareovirus resulted in the downregulation of TLR21 expression in the liver and spleen but its significant upregulation in the liver and spleen after Aeromonas hydrophila infection (Wang et al. 2013). Similarly, TLR22 transcripts were inhibited during the early stage post infection, upregulated and then peaked at 24 h post infection and then downregulated in the grass carp kidney cell line (Su et al. 2012). These results indicate that these two receptors may play a role in host anti-pathogenic immune responses (Panda, Chakrapani, Patra, Saha, Jayasankar, Kar, Sahoo & Barman 2014; Samanta, Swain, Basu, Mahapatra, Sahoo, Paichha, Lenka & Jayasankar 2014; Zhang, Kong, Zhou, Li, Nie & Li 2014; Sahoo, Dikhit, Bhoi, Maharana, Lenka, Dubey & Tiwari 2015).
Tilapia is one of the most important freshwater aquaculture species in the world. However, tilapia cultivation has been severely threatened since 2009 due to Streptococcus agalactiae infection (Lu, Li, Ye, Deng, Jiang, Tian & Lai 2010). No efficient way has been found to prevent this disease. Understanding the innate immune mechanism will potentially help to develop effective measures to control Streptococcus infection. In this study, we identified the full-length cDNA of TLR21 and TLR22 from Nile tilapia, determined the genomic structure of these proteins and analysed their mRNA expression during bacterial infection using quantitative real-time PCR. This study will provide useful information for understanding the innate immune mechanism in tilapia and will provide a basis for the selection of disease resistance-related markers for breeding Nile tilapia.
Materials and methods
Fish, bacterial challenge and sample collection
Nile tilapia individuals weighing approximately 60 g were collected from Gaoyao Fish Farm of Pearl River Fisheries Research Institute (Guangzhou, China). Healthy fish were kept in 500-L tanks at 30–31°C for 2 weeks. Fish were fed twice daily with a commercial diet (Feed Mill of Pearl River Fisheries Research Institute, Guangzhou, China) at a rate of 3% of the body weight. Water quality parameters, for example dissolved oxygen, pH, ammonia, were monitored during the experiment.
In the tissue expression experiment, six healthy individuals were anesthetized by MS222 (Sigma, St.Louis, MO, USA) and dissected, and 10 types of tissues, including kidney, liver, gill, brain, intestine, muscle, heart, stomach, skin and spleen, were collected for RNA extraction for expression profiling. Tilapia fin samples were collected for genomic DNA extraction.
For a gene expression analysis during embryonic development, approximately 80 tilapia embryos were randomly sampled at 2.5, 3.5, 4.5, 5, 5.5, 6, 6.5, 7.5 and 8.5 days post fertilization (dpf). Three RNA samples were extracted at each time point for RNA extraction.
To determine the challenge concentrations, different concentrations of S. agalactiae were tested in a pre-challenge experiment. Fifteen fish were used in each group (one control group and three challenge groups). S. agalactiae were cultured at 37°C for 15 h until the density reached approximately 3 × 10⁸ CFU mL−1. The bacterial suspension was then diluted to 104, 105 or 106 CFU mL−1 in phosphate-buffered saline (PBS, pH 7.2). Then, 200 μL of bacterial suspension was injected into each individual. Eight and three individuals died in the 106 group and 105 CFU mL−1 groups respectively. All of the fish in the 104 CFU mL−1 group survived. Therefore, we used 105 CFU mL−1 as the challenge concentration in the challenge experiment. In the challenge experiment, 80 individuals in the treatment groups were intraperitoneally injected with 200 μL (105 CFU mL−1) of bacterial suspension per individual, while 40 individuals in the control group were intraperitoneally injected with the same volume of PBS. Four individuals were randomly sampled at 8 h and 1, 2, 3, 6 and 9 days post infection (dpi). Four tissues (intestine, gill, spleen and kidney) were collected for RNA extraction to analyse the temporal expression profile after bacterial challenge.
DNA extraction and cDNA synthesis
Genomic DNA was extracted from tilapia caudal fin samples using the TIANamp Genomic DNA Kit (TIANGEN, Beijing, China)
Total RNA was isolated from 30 mg of tilapia tissues or 25 embryos using TRIzol Reagent (Invitrogen, Carlsbad, CA, USA). Reverse transcription of the total RNA was performed using a PCR Kit (AMV) Ver. 2.1 (TaKaRa, Dalian, China) to create RACE-ready first-strand cDNA. The reaction system contained 2.75 μL of H2O, 2 μL of MgCl2, 1 μL of 10× RT Buffer, 1 μL of dNTP, 0.5 μL of oligo-dT adaptor primer, 0.25 μL of RNase inhibitor, 0.5 μL of AMV reverse transcriptase and 2 μL of total RNA (1 μg) in a final volume of 10 μL. The reaction conditions were 42°C for 30 min, 99°C for 5 min and 4°C for 5 min. 5′RACE was performed using the Smart™ RACE cDNA Synthesis Kit (BD, Biosciences Clontech, Palo Alto, CA, USA). First-strand cDNA of OnTLR21 and OnTLR22 was synthesized from the total RNA of the kidney. The reaction system contained 2 μL of 5× first-strand buffer, 1 μL of DTT (20 mM), 1 μL of dNTP (10 mM), 1 μL of 5′-CDS Primer A and 2.75 μL of RNA (1 μg). The reaction conditions were 72°C for 3 min and 42°C for 2 min, after which 1 μL of SMARTer IIA oligo, 0.25 μL of RNase inhibitor and 1 μL of SMARTScribe reverse transcriptase (100 U) were added. The reaction conditions were 42°C for 90 min and 70°C for 10 min. Then, the first-strand reaction product was diluted to 100 μL with Tricine–EDTA buffer. For gene expression analysis, the total RNA from each sample was reverse-transcribed using the PrimeScript II First-strand cDNA Synthesis Kit (TaKaRa). Before reverse transcription, the total RNA was digested with DNaseI (Promega, Madison, WI, USA) to eliminate genomic DNA contamination. The reaction system contained 8 μL of total RNA (approximately 1 μg of RNA mixed with ddH2O), 1 μL of RNase-free DNase and 1 μL of 10× reaction buffer, which were incubated at 37°C for 30 min, after which 1 μL of DNase Stop Solution (Promega) was added and incubated at 65°C for 10 min to stop the reaction. The reverse-transcribed system contained 11 μL of the total RNA above (digested with DNase), 1 μL of oligo-dT primer (50 μM), 1 μL of dNTP mixture (10 μM each), 4 μL of 5× PrimeScript II Buffer, 0.5 μL of RNase inhibitor (40 U μL−1), 1 μL of PrimeScript II RNase (200 U μL−1) and 1.5 μL of RNase-free H2O in a final volume of 20 μL. The reaction conditions were 42°C for 60 min and 95°C for 5 min.
Primer design and PCR amplification
To clone a partial cDNA fragment of OnTLR21, the degenerate primers TLR21-sf and TLR21-sr (Table 1) were designed based on the TLR21 cDNA sequences of orange-spotted grouper (Epinephelus coioides) (GU198366), Fugu rubripes (Takifugu rubripes) (NM_001032579) and channel catfish (Ictalurus punctatus) (NM_001200065). According to the TLR22 cDNA sequences of large yellow croaker (Larimichthys crocea) (GU324977), mandarin fish (Siniperca chuatsi) (JN969981) and rainbow trout (Oncorhynchus mykiss) (NM_001124412), the degenerate primers TLR22-sf and TLR22-sr (Table 1) were designed to obtain the partial cDNA fragment of OnTLR22. The partial cDNA fragments of OnTLR21 and OnTLR22 were amplified from first-strand cDNA from the kidney. Amplification was performed with an initial denaturation at 94°C for 3 min, followed by 30 cycles of denaturation for 30 s at 94°C, annealing for 30 s at 55°C, extension for 2 min at 72°C and a final extension for 7 min at 72°C. The desired PCR products were purified and subcloned into the pMD19-T vector (TaKaRa) for sequencing.
| Primer name | Sequence (5′-3′) | Amplicon length (bp) and application |
|---|---|---|
| TLR 21-sf | CTTAACCTAC GCAACAATCG C | 1518 |
| TLR 21-sr | AGCAAGTTCCTGCTCACCACA | Amplification of TLR 21 partial sequence |
| TLR 22-sf | TTCACTTGTG ACTGTGATAA C | 678 |
| TLR 22-sr | TTGCGGCCAGCTCAGGTAGGT | Amplification of TLR 22 partial sequence |
| TLR 21-3-1 | TATGTGTTTCGGGCCTGGTT | 643, TLR 21 3′RACE |
| TLR 21-3-2 | TGATGAACAATGGGTCATGG | 547, TLR 21 3′RACE |
| TLR 21-5-1 | TCCATCAAGACCCGATTGCT | 1734, TLR 21 5′RACE |
| TLR 21-5-2 | AGCACAGTGAGGGTGTCTTG | 1829, TLR 21 5′RACE |
| TLR 22-3-1 | CCGTCTGTTTGATGAGCAGA | 1650, TLR 22 3′RACE |
| TLR 22-3-2 | CCATTTGTGTGATCAGTCGC | 1720, TLR 22 3′RACE |
| TLR 22-5-1 | TGTCCAAGTCCAACAGCTTC | 2478, TLR 22 5′RACE |
| TLR 22-5-2 | AGCTGCAACCCCATGAAATG | 2586, TLR 22 5′RACE |
| TLR21-orf1 | ATCACAGGGGCTTTGGATCTAT | 1789 |
| TLR21-orf2 | TTGGGTTAGTGCAGTCTGAACC | Complete ORF of TLR 21 |
| TLR21-p1 | ATGGGAAACCTAACTCATCAGC | 2939 |
| TLR21-p2 | CAAGGTTGCAAGTAAAAGTTT | Genome amplification of TLR 21 |
| TLR 22-orf1 | ATGTTGCAAATCATGCATTATT | Complete ORF and genome amplification of TLR 22 |
| TLR 22-orf2 | TCATGGCATAGTTGGCACAGTG | 2839, Complete ORF of TLR 22 |
| TLR 22-orf3 | CTGCGTAAAATGCTGACTCTGT | 4930, Genome amplification of TLR 22 |
| TLR21-sense | AACGGACTCACCGTTTTACCA | 242 |
| TLR21-antise | GGAGAAGTTCTGAATGCCCAT | Real-time PCR |
| TLR22-sense | GATCCAGGCAGCCAGTTTCCGT | 199 |
| TLR22-antise | CTCGCGGCCAGCTCAGGTAGGT | Real-time PCR |
| EF-sense | GGAAATCCGTCGTGGATACG | 226 |
| EF-antise | AAACTTGGGGCTGTCCTCAA | Real-time PCR |
The 3′ regions of OnTLR21 and OnTLR22 were amplified with the TLR21-3-1, M13 reverse primer and TLR22-3-1, M13 reverse primer that were provided in the RNA PCR Kit (AMV) Ver. 2.1 respectively. Nested PCR was performed with TLR21-3-2, M13 reverse primer and TLR22-3-2, M13 reverse primer. The desired fragment was purified, cloned and sequenced as described above.
5′RACE was performed using the Smart™ RACE cDNA Synthesis Kit (BD, Biosciences Clontech). The first-strand cDNA of OnTLR21 and OnTLR22 was synthesized from total RNA from the kidney. Primary PCR was performed with TLR21-5-1, UMP primer (provided in the kit) and TLR21-5-1, followed using nested PCR with TLR21-5-2, NUP primer and TLR22-5-2. The products of nested PCR were cloned and sequenced using the same method as described above.
To clone the OnTLR21 and OnTLR22 genes, forward primers TLR21-p1 and TLR22-orf1 and reverse primers TLR21-p2 and TLR22-orf3 were designed. The primers TLR21-p1 and TLR21-p2 were used to amplify the OnTLR21 gene. The primers TLR22-orf1 and TLR22-orf3 were used to amplify the OnTLR22 gene. Fifty nanograms of caudal fin genomic DNA was used as a template for PCR with denaturation at 94°C for 3 min, followed by 30 cycles of denaturation for 30 s at 94°C, annealing for 30 s at 56°C, extension for 3 min 30 s at 72°C and a final extension for 7 min at 72°C. The desired fragment was purified, cloned and sequenced as described above.
Sequence alignment and phylogenetic tree construction
The intron/exon structures of the identified genomic sequences and the deduced amino acid sequences were determined by an alignment of the full-length cDNA to the genomic sequence using Vector NTI 8.0 and BLAST2. The deduced protein structures of OnTLR21 and OnTLR22 were predicted using the Simple Modular Architecture Research Tool (SMART) (http://smart.embl-heidelberg.de/) (Schultz, Milpetz, Bork & Ponting 1998; Letunic, Doerks & Bork 2009). The ClustalW multiple alignment programme (http://www.ebi.ac.uk/clustalw/) was used for multiple alignments of TLR21 and TLR22. A phylogenetic tree was constructed according to deduced amino acid sequences of the selected TLR21 and TLR22 genes using the Jones–Taylor–Thornton (JTT) model of maximum-likelihood method in mega 5.0 (Tamura, Peterson, Peterson, Stecher, Nei & Kumar 2011). The interior branch trials were replicated 1000 times to derive the confidence value for the phylogeny analysis.
Quantitative real-time reverse transcriptase (RT)-PCR
Plasmids were constructed and used as templates for the internal standard curves of the target gene and the reference gene. Primers (Table 1) were designed to amplify the specific fragments of the OnTLR21 and OnTLR22 genes. The EF1α gene was used as the reference gene in the experiment of tissue expression and temporal expression profiling after bacterial challenge (Pang, Gao, Lu, Ye, Zhu & Ke 2013; Li, Gao, Lu, Cao, Zhu, Ke & Liu 2014). In the experiment of gene expression during embryonic development after fertilization, 27 cDNA samples (from embryos of 2.5, 3.5, 4.5, 5, 5.5, 6, 6.5, 7.5 and 8.5 dpf) were used to select optimal reference genes from EF1α (elongation factor-1 alpha), β-actin (ATCB) and 18s. ACTB and not EF1α was the gene with the most stable expression (data not shown). Thus, we selected the ACTB gene as the reference gene. The details of the selection of optimal reference genes were as described by Pang (Pang et al. 2013). Plasmid construction was performed as described by Pang (Pang et al. 2013). The purified plasmids were quantified using a Biophotometer, and standard samples were constructed by a tenfold (10−1–10−8 pmol L−1) serial dilution. All of the standard curves exhibited correlation coefficients greater than 0.99.
Real-time PCR analysis was performed with a StepOnePlus™ Real-Time PCR System (Life Technologies, New York, USA) using Power SYBR Green Master Mix (Applied Biosystems, New York, USA). Reactions were performed in a 20 μL volume containing 1 μL of cDNA template, 10 μL of Power SYBR Green Master Mix, 0.2 μL of forward and reverse primers (10 pmol L−1) and 8.6 μL of ddH2O. The reaction conditions were 50°C for 2 min, 95°C for 2 min and 40 cycles of 95°C for 15 s, 58°C for 30 s and 72°C for 30 s. A denaturing step of 15 s at 95°C was added after the amplification, and a melting curve analysis was performed over a range of 60–95°C in order to verify that a single PCR product was generated at the end of the assay. Each assay was performed in triplicate. The negative controls in the real-time PCR analysis included a no-cDNA control and a DNase-treated, non-reverse-transcribed tissue RNA sample to ensure that only the cDNA was quantified in each sample. The concentration of the target gene was based on the threshold cycle number (CT), and the CT for each sample was determined using the StepOnePlus™ Real-Time PCR System. The cDNA concentration in each sample was determined according to the gene-specific standard curve. To normalize cDNA loading, all of the samples were run in parallel with the reference gene, EF1α, in the same plate. The relative gene expression of OnTLR21 and OnTLR22 was calculated using the formula F =  (a is the concentration of the target gene from the treatment group, b is the concentration of the internal gene from the treatment group, c is the concentration of the target gene from the control group, and d is the concentration of the internal gene from the control group). The data are displayed as the means ± SE (n = 3, 4/6).
Significant differences were determined using one-way anova followed using Duncan's multiple range test. The statistical analyses were performed using the software SPSS 15.0 (APSS, Chicago, IL, USA).
Results
cDNA and genomic sequences of the OnTLR21 and OnTLR22 genes
The OnTLR21 cDNA (GenBank accession no. KJ010824) consisted of a 5′-UTR of 228 bp, a 3′-UTR of 28 bp and an ORF of 2940 bp encoding a polypeptide of 979 amino acids, with a predicted molecular weight of 112.59 kDa and a theoretical isoelectric point of 8.18. The polyadenylation signal (AATAAA) was located 115 bp upstream of the polyA tail. There was no intron in the OnTLR21 gene. A diagrammatic drawing of OnTLR21 permitted a comparison of TLR21′s genomic structure and deduced protein of Nile tilapia with those of grouper (Epinephelus coioides), halibut (Paralichthys olivaceus), fugu rubripes (Takifugu rubripes), Atlantic cod (Gadus morhua), zebrafish (Danio rerio), grass carp (Ctenopharyngodon idella), channel catfish (Ictalurus punctatus) and jungle fowl (Gallus gallus) (Fig. 1a and b). The deduced amino acids of OnTLR21 included a signal peptide (residues 1–23), 16 LRR domains (residues 82–679), a transmembrane region (residues 743–765) and a TIR typical domain architecture (residues 797–946) (Fig. 1b).
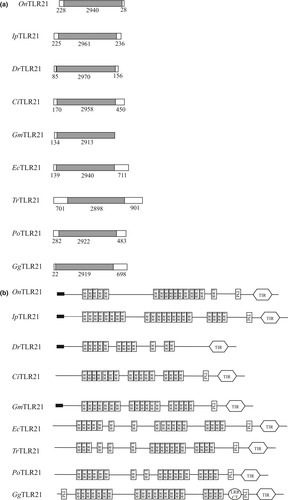
 , signal peptide.
The complete sequence of the OnTLR22 gene (GenBank accession no. KJ010825) was 3440 bp in length, including a 5-UTR of 252 bp, a 3-UTR of 302 bp and an ORF of 2886 bp encoding a polypeptide of 961 amino acids. The deduced amino acids had a predicted molecular weight of 110.34 kDa and a theoretical isoelectric point of 8.56. The motif ATTA mediating mRNA degradation was found in the 3′-UTR. Other sites (including AATAAA, which is the polyadenylation signal) were found in the 5′-UTR. Three exons and two introns were identified in the Nile tilapia TLR22 gene. A diagrammatic drawing of OnTLR22 permitted a comparison of TLR22′s genomic structure and deduced protein of Nile tilapia with those of large yellow croaker (Larimichthys crocea), Mandarin fish (Siniperca chuatsi), halibut, fugu rubripes, rainbow trout (Oncorhynchus mykiss), common carp (Cyprinus carpio), crucian (Carassius auratus), grass carp and zebrafish (Fig. 2a and b). The deduced amino acid residues of Nile tilapia TLR22 consisted of a signal peptide (residues 1–39), 16 LRR domains (residues 91–707) and a C-terminal LRR domain (LRR-CT, residues 695–746) in the extracellular region and a transmembrane region (residues 768–790) and a TIR domain (residues 902–945) in the cytoplasmic region (Fig. 2b).
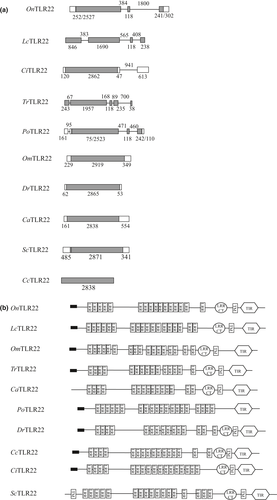
 , signal peptide.
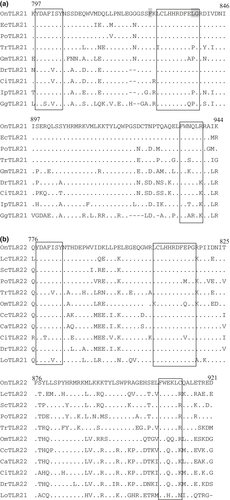
The TIR domain of OnTLR21 and OnTLR22 contains three significant motifs: box 1 (FDAFISY), box 2 (LC-RD-PG) and box 3 (a conserved W surrounded by basic residues). The significant motifs were essentially conserved in OnTLR21 (box 1, Y798DAFISY804; box 2, L829C-RD-LG839; and box 3, W936 surrounded by basic residues) and in OnTLR22 (box 1, Y803DAFISY809; box 2, L833C-RD-PG843; and box 3, W935 surrounded by basic residues) (Fig. 3a and b).
Homologous and phylogenetic analysis of the TLR21 and TLR22 genes
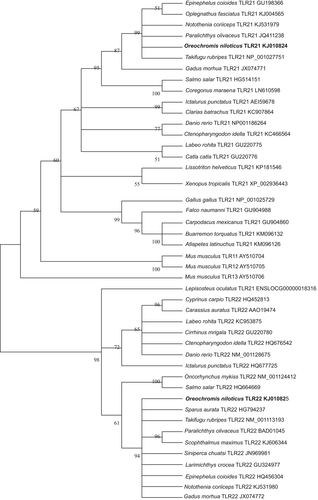
The regions of highest amino acid identity of the different TLR21 and TLR22 genes were within the TIR domain (Table 2 and Fig. 3). Alignments of the deduced amino acid sequence of the LRRs, TIR and LRR&TIR in OnTLR21 with those of other vertebrates demonstrated that these regions shared 40.4–66.2%, 57.9–95.3% and 40.7–68% similarity, respectively, with those other fish TLR21 proteins (Table 2). Similar results were obtained from the alignment of the deduced amino acid sequence of OnTLR22 (Table 2). To evaluate the molecular evolutionary relationships of OnTLR21 and OnTLR22 with other Toll-like receptors, a phylogenetic tree was constructed using the maximum-likelihood method based on the protein sequences of Toll-like receptors (Fig. 4). This phylogenetic tree can be divided into two main clusters. The first cluster is composed of TLR21 and the second cluster of TLR22. Xenopus and chicken TLR21 form a small branch in the TLR21 cluster. The TLR21 and TLR22 of teleosts are closely related in the phylogenetic tree. OnTLR21 and OnTLR22 clustered with sequences of TLR21 and TLR22 from P. olivaceus and S. chuatsi respectively.
| OnTLR21 | DrTLR21 | CiTLR21 | PoTLR21 | EcTLR21 | TrTLR21 | IpTLR21 | GmTLR21 | GgTLR21 |
|---|---|---|---|---|---|---|---|---|
| LRR | 50.3 | 50.2 | 63.9 | 66.2 | 59.7 | 63.9 | 52.5 | 40.4 |
| TIR | 81.2 | 80.0 | 92.7 | 95.3 | 89.3 | 94.0 | 83.3 | 57.9 |
| LRR&TIR | 52.6 | 52.1 | 66.9 | 68.0 | 62.8 | 55.0 | 55.6 | 40.7 |
| OnTLR22 | DrTLR22 | CiTLR22 | PoTLR22 | ScTLR22 | LcTLR22 | OmTLR22 | TrTLR22 | CcTLR22 | CaTLR22 |
|---|---|---|---|---|---|---|---|---|---|
| LRR | 38.3 | 38.1 | 62.9 | 66.6 | 59.7 | 45.0 | 53.0 | 39.7 | 38.6 |
| TIR | 72.2 | 70.1 | 80.6 | 85.2 | 79.9 | 77.8 | 77.8 | 70.8 | 71.5 |
| LRR&TIR | 41.2 | 41.0 | 61.7 | 67.7 | 61.3 | 46.2 | 56.1 | 42.6 | 42.1 |
Expression profiles of OnTLR21 and OnTLR22 mRNA in different tissues and during embryonic development
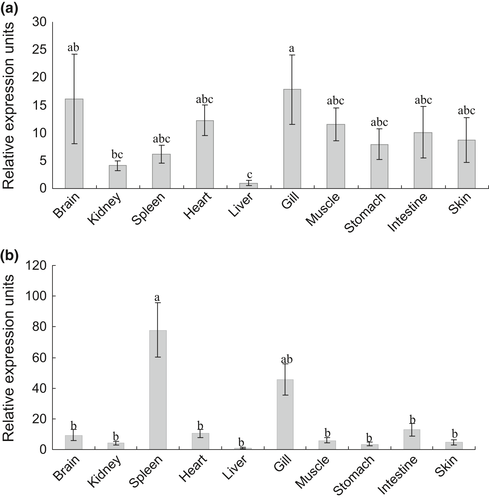
The expression levels of OnTLR21 and OnTLR22 were different among various tissues in healthy Nile tilapia (Fig. 5). The highest levels of the OnTLR21 transcript were detected in the gill and brain; moderate levels in the heart, muscle, intestine, skin, stomach, spleen and kidney; and the lowest levels in the liver. The OnTLR21 expression level in the gill and brain was 17.86- and 16.14-fold that in the liver. The highest levels of TLR22 mRNA were detected in the spleen and gill, and the lowest levels were detected in the liver. The expression level of TLR22 in the spleen and gill was significantly higher than that in the liver (P < 0.01) (77.92- and 45.68-fold that in the liver respectively).
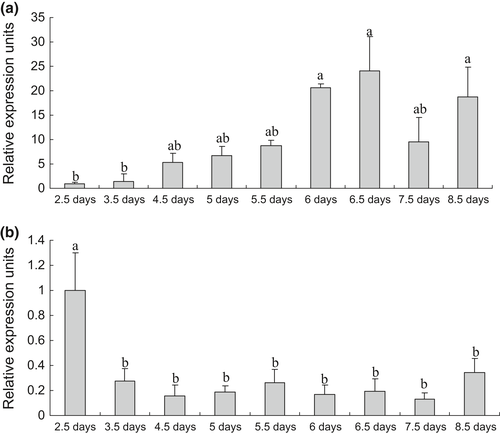
The expression levels of OnTLR21 and OnTLR22 during embryonic development post fertilization were observed. The expression level of OnTLR21 increased from 2.5 to 6.5 dpf and peaked at 6.5 dpf, which is 24.04-fold that at 2.5 dpf (Fig. 5). Then, the expression level decreased at 7.5 dpf and increased at 8.5 dpf. The OnTLR22 mRNA level was highest at 2.5 dpf and decreased from 3.5 dpf (Fig. 6). The OnTLR22 mRNA level showed no significant difference from 3.5 to 8.5 dpf (Fig. 6).
Temporal expression profile of the OnTLR21 and OnTLR22 transcripts after bacterial challenge
The OnTLR21 mRNA level was downregulated in the gill, kidney and spleen. The expression level of OnTLR21 decreased rapidly after infection in all test tissues and reached the lowest level in the gill and heart at 8 h post infection (hpi). The lowest expression level of OnTLR21 in the kidney and spleen occurred at 1 day post infection (dpi). Then, the expression level of OnTLR21 peaked in the heart, kidney and spleen at 6 dpi (Fig. 7a).

The OnTLR22 mRNA level was downregulated in all of the test tissues, decreasing significantly after infection. The OnTLR22 expression level decreased to the lowest level in the heart and spleen at 2 dpi, while the lowest level in the gill and kidney occurred at 1 dpi. Then, the OnTLR22 expression level in all of the test tissues increased slightly (Fig. 7b).
Discussion
Toll-like receptors are significant elements of innate immunity (Vogel 1998) and play increasingly important roles between innate immunity and adaptive immunity (Eisenbarth & Flavell 2009). TLRs of many teleosts have been identified (Jault et al. 2004; Yeh, Liu, Lo, Yuh, Yu, Lo, Luo, Xiang & Chuang 2013; Zhang et al. 2013). In this study, we obtained the full-length OnTLR21 and OnTLR22 cDNA and characterized their structure. The deduced protein structure of TLR21 varied, as some fish TLRs lacked either a signal peptide (Li et al. 2012; Gao, Wu, Sun, Geng & Pan 2013; Wang et al. 2013) or a transmembrane domain (Jault et al. 2004). In addition, the number of LRRs was very different. There are 21, 18, 12, 16, 17, 17, 18 and 20 LRR in IpTLR21 (Baoprasertkul, Xu, Peatman, Kucuktas & Liu 2007), GmTLR21 (Sundaram et al. 2012), DrTLR21 (Jault et al. 2004), CiTLR21 (Wang et al. 2013), EcTLR21 (Li et al. 2012), TrTLR21 (Oshiumi et al. 2003), PoTLR21 (Gao et al. 2013) and GgTLR21 (Caldwell, Kierzek, Arakawa, Bezzubov, Zaim, Fiedler, Kutter, Blagodatski, Kostovska, Koter, Plachy, Carninci, Hayashizaki & Buerstedde 2005) respectively. However, the deduced protein structures of TLR22 were similar among these species: they all had a signal peptide, transmembrane domain and LRR domain, and the number of LRRs varied only slightly (16–20). The LRR region is responsible for binding PAMPs and ligands to their respective TLRs; hence, variations in the LRR number would change the broad-range capacity for the recognition of different PAMPs and ligands (Matsushima, Tanaka, Enkhbayar, Mikami, Taga, Yamada & Kuroki 2007) of piscine TLR21 and TLR22.
The TIR domain of TLR21 and TLR22 had the highest identification level, possibly because the cytoplasmic TIR domain evolved more slowly than did the LRR domain-containing extracellular regions (Johnson, Brunn, Tang & Platt 2003). The TIR domain, which is very important for TLR signal transduction, contains three significant motifs: box 1 (FDAFISY), box 2 (LC-RD-PG) and box 3 (a conserved W surrounded by basic residues) (Slack, Schooley, Bonnert, Mitcham, Qwarnstrom, Sims & Dower 2000). Box 1 and box 2 are believed to bind downstream signalling proteins, whereas box 3 controls the localization of the receptor (Slack et al. 2000). Moreover, the three essential amino acid residues (F732, L835 and G836) in human TLR3 regulate ligand-induced NF-κB and IFN-β promoter activation (Funami, Matsumoto, Oshiumi, Akazawa, Yamamoto & Seya 2004). These three amino acid residues are also found in the deduced protein sequence of OnTLR21 (F827, L838 and G839) and other fish species, such as EcTLR21 (Li et al. 2012), PoTLR21 (Gao et al. 2013) and TrTLR21 (Oshiumi et al. 2003). The three essential amino acid residues are W831, P842 and G843 in OnTLR22 and other teleosts. However, the importance and function of these three amino acid residues in OnTLR21 and OnTLR22 need to be verified. In addition to these three boxes, several other positions of the TIR domain are also conserved, suggesting a key contribution to the function of the domain.
The genomic structure of TLR21 and TLR22 was also investigated. The results showed that the genomic structure of most of the TLR21 genes was similar: none of the genes had an intron (Fig. 1a). However, the genomic structure of TLR22 was different. Some of the genes had no introns, some had introns, and the number of introns was different (Fig. 2a). It seems that the genomic organization of OnTLR22 was similar to that of Larimichthys crocea (Xiao, Qin & Chen 2011), Takifugu rubripes (Oshiumi et al. 2003) and Paralichthys olivaceus (Hirono, Takami, Miyata, Miyazaki, Han, Takano, Endo & Aoki 2004) but different from that of Oncorhynchus mykiss (Rebl, Siegl, Köllner, Fischer & Seyfert 2007), Danio rerio (Jault et al. 2004), Carassius auratus (Stafford, Ellestad, Magor, Belosevic & Magor 2003) and Cyprinus carpio (Stafford et al. 2003), which have introns. These observations indicate that the genomic organization of TLR22 is not highly conserved among teleost fish in general but is highly conserved in freshwater species. It seems that there are more introns in seawater teleost species. However, it remains unclear whether this diversity causes functional differences.
A phylogenetic analysis revealed that TLR21 and TLR22 of Nile tilapia clustered with sequences of TLR21 and TLR22 in other fish species. The observed relationships within this cluster could reflect the relative taxonomic positions of the species. From the phylogenetic tree, we can see that TLR21 is not fish specific; TLR21 also exists in avians and amphibians. This result is not consistent with previous research in other fish (Zhang et al. 2013). Whether TLR22 is a fish-specific gene requires further investigation.
Our real-time PCR analysis demonstrated that OnTLR21 was expressed in all of the tested tissues from Nile tilapia. This result is not consistent with previous research in other fish, such as catfish (Baoprasertkul et al. 2007) and Takifugu (Oshiumi et al. 2003). While OnTLR21 presented low expression in the liver, IcTLR21 and TrTLR21 showed no expression or very low expression in muscle. Similarly, OnTLR22 was also detected in all of the tested tissues, but the expression level was significantly different among the different tissues, with the highest expression level in the gill and spleen and the lowest expression level in the liver. However, grass carp CiTLR22 is expressed highly in the gill but at low levels in the liver and spleen (Su et al. 2012). In Japanese flounder, TLR22 is expressed highly in peripheral blood leucocytes (PBLs) and head kidney and but at low levels expressed in the intestine, liver, brain and skin (Hirono et al. 2004). In rainbow trout (Rebl et al. 2007) and goldfish (Stafford et al. 2003), TLR22 is mainly expressed in the spleen and weakly expressed in the liver. In fugu (Oshiumi et al. 2003) and large yellow croaker (Xiao et al. 2011), TLR22 is predominantly detected in the kidney and only slightly detected in the gill. These studies indicate that tissue expression patterns are various among different fish species. The mechanisms behind tissue preference are unknown, but this preference could be related to the cell-type specificity of TLR gene expression, as specific cell types may be presented very differentially in different tissues (Zhang et al. 2013). It appears that several TLR21 and TLR22 genes are mainly expressed in the spleen, gill and kidney in different fish species and may be heavily involved in immune responses.
The relative expression of OnTLR21 increased significantly from 2.5 to 6.5 dpf. Then, this level decreased at 7.5 days and increased at 8.5 days. This result is different from the expression pattern of CiTLR22. CiTLR22 expression was not detected in embryonic development until 24 h post fertilization, and the expression level continuously increased until the end of the experiment (64 h) (Lv et al. 2012). In contrast, the expression level of OnTLR22 decreased from 3.5 dpf to a relatively stable level.
The OnTLR21 transcripts were upregulated in the heart and slightly downregulated in the spleen and gill after bacterial infection. However, in the kidney, the mRNA level sharply decreased, and the expression level had no obvious change at any time points. This result is consistent with previous reports in other fish. For example, in orange-spotted grouper, TLR21 is downregulated at most time points post Cryptocaryon irritans infection in the spleen and head kidney (Li et al. 2012). Upon induction by Aquareovirus, CiTLR21 expression is significantly downregulated in the liver and spleen but significantly upregulated in the liver and spleen after Aeromonas hydrophila infection (Wang et al. 2013), while OfTLR21 (Oplegnathus fasciatus TLR21) mRNA is significantly upregulated in spleen tissues after stimulation with Streptococcus iniae (rock bream iridovirus) and Edwardsiella tarda (Priyathilaka, Elvitigala, Whang, Lim, Jeong, Yeo, Choi & Lee 2014). PoTLR21 is upregulated by the immunostimulation of Vibrio anguillarum, CpG-ODN and poly I:C-treated head kidney cells in vitro (Gao et al. 2013). Defence protection mediating by TLR21-dependent signalling pathways has yet to be determined. Further studies should be performed to clarify whether the TLR21 can directly recognize S. agalactiae to activate the immune response. Nevertheless, TLR22 transcripts were significantly downregulated after infection in all of the tested tissues. In rohu (Labeo rohita), the mRNA expression of TLR22 was significantly downregulated in kidney (Saurabh, Mohanty & Sahoo 2011). In contrast, the TLR22 transcripts were upregulated in some fish after pathogen infection. For example, the expression profile of CiTLR22 in the spleen was rapidly and significantly upregulated at 6 h post injection of grass carp reovirus (GCRV) and then rapidly recovered to normal level at 12 h post injection of GCRV (Su et al. 2012). After Vibrio anguillarum infection, the mRNA levels of SaTLR22 (Sparus aurata TLR22) significantly increased in the head kidney, blood and peritoneal exudate but were only moderately induced in the spleen and liver (Muñoz, Sepulcre, Meseguer & Mulero 2014). TLR22 might sense pathogen PAMPs, including Gram-positive bacteria, parasites and viruses (Meijer, Gabby Krens, Medina Rodriguez, He, Bitter, Ewa Snaar-Jagalska & Spaink 2004; Saurabh et al. 2011; Su et al. 2012). In mammals, cells prominently expressing TLRs include antigen-presenting cells (APCs), such as dendritic cells (DCs) and macrophages, which ingest and degrade pathogens. APCs activate the adaptive immune response by migrating from the infection site to the regional lymph node, where they present microbe-derived antigens to naive CD4+ T cells and instruct the differentiation of native CD4+ T cells into T helper 1 (Th1) cells (Akira et al. 2006). In tilapia, upon infection, APCs might also migrate from the infection site to the lymphatic system, along with the TLRs. Thus, the expression levels of TLR21 and TLR22 were downregulated.
In conclusion, we cloned TLR21 and TLR22 genes from Nile tilapia and investigated their genomic structure and expression patterns. OnTLR21 and OnTLR22 share common features with other piscine TLRs. OnTLR21 and OnTLR22 transcripts were detected in ten normal tissues with the highest expression levels in the gill and spleen and the lowest expression level in the liver. The highest levels of OnTLR21 and OnTLR22 mRNA were detected 6.5 and 2.5 days post fertilization respectively. Upon stimulation with the intraperitoneal injection of S. agalactiae, the expression levels of both OnTLR21 and OnTLR22 were obviously downregulated in the spleen, kidney and gill. The specific roles of different TLRs in Nile tilapia require investigation. In conclusion, OnTLR21 and OnTLR22 may play important roles in the immune response. This study will help to understand the mechanism of the innate immune response, to identify SNPs related to resistance/susceptibility to bacterial infection in tilapia and to breed tilapia using marker-assisted selection.
Conflicts of interest
The authors declare no conflict of interests.
Acknowledgments
This work was supported by the China Agriculture Research System (No. CARS-49).


