Impaired renal HCO3− secretion in CFTR deficient mice causes metabolic alkalosis during chronic base-loading
Abstract
Aim
Cystic fibrosis patients have an increased risk of developing metabolic alkalosis presumably as a result of altered renal HCO3− handling. In this study, we directly assess the kidneys’ ability to compensate for a chronic base-load in the absence of functional CFTR.
Methods
Comprehensive urine and blood acid-base analyses were done in anaesthetized WT mice or mice lacking either CFTR or pendrin, with or without 7 days of oral NaHCO3 loading. The in vivo experiments were complemented by a combination of immunoblotting and experiments with perfused isolated mouse cortical collecting ducts (CCD).
Results
Base-loaded WT mice maintained acid-base homeostasis by elevating urinary pH and HCO3− excretion and decreasing urinary net acid excretion. In contrast, pendrin KO mice and CFTR KO mice were unable to increase urinary pH and HCO3− excretion and unable to decrease urinary net acid excretion sufficiently and thus developed metabolic alkalosis in response to the same base-load. The expression of pendrin was increased in response to the base-load in WT mice with a paralleled increased pendrin function in the perfused CCD. In CFTR KO mice, 7 days of base-loading did not upregulate pendrin expression and apical Cl−/HCO3− exchange function was strongly blunted in the CCD.
Conclusion
CFTR KO mice develop metabolic alkalosis during a chronic base-load because they are unable to sufficiently elevate renal HCO3− excretion. This can be explained by markedly reduced pendrin function in the absence of CFTR.
1 INTRODUCTION
Cystic fibrosis (CF) is one of the most common lethal genetic diseases in Caucasians and is caused by mutations in the gene encoding for the cystic fibrosis transmembrane conductance regulator (CFTR).1 CFTR is widely expressed in epithelial tissues and loss of CFTR results in impaired Cl− and HCO3− secretion, leading to pancreatic insufficiency, recurring lung infections, gradual decline of lung function, and eventually death.1 Moreover, CF patients are known to have a higher incidence of metabolic alkalosis2-4 that is likely caused by a decreased capacity to excrete base-equivalents secondary to an altered renal HCO3− handling.3, 5, 6
The filtered HCO3− is mainly reabsorbed in the proximal tubule.7 Fine adjustment of renal acid excretion occurs in the collecting duct by the α-intercalated cells (IC) that employ the vacuolar H+-ATPase and two isoforms of the H+/K+ ATPase for H+ movement into the tubular lumen. Base excretion is effected by β-ICs via the apical Cl−/HCO3−-exchanger pendrin, SLC26A4.8 Pendrin is expressed in various tissues including the kidney, the thyroid gland, and the inner ear, but expression has also been documented in the testis, airway epithelia, placenta, mammary gland, liver, and endometrium.8-11 In the kidney, pendrin localizes exclusively to the apical surface of β-ICs and non-A-non-B type ICs. In mice, pendrin is the primary HCO3−-secreting protein in the cortical collecting duct, where it is highly expressed.8, 12, 13 Remarkably, the absence of pendrin does not appear to affect systemic acid-base status under normal conditions. However, the absence of pendrin function becomes critical during chronic base-loading, which causes marked metabolic alkalosis in pendrin KO mice.8, 14 Also in humans, lack of pendrin has been linked to metabolic alkalosis,15, 16 but has so far only been documented in cases of vomiting/dehydration or thiazide treatment. In mice, the inability to secrete HCO3− when lacking pendrin results in a decreased urinary pH.13
It is well documented that CFTR works in concert with various Cl−/HCO3− exchangers of the SLC26 family to secrete bicarbonate in the duodenum, pancreatic duct, and airways.10, 17, 18 CFTR is expressed throughout the renal tubular system including the cortical collecting duct, with preferentially high expression in the β-ICs.19 Therefore, one could speculate that CFTR would regulate HCO3− secretion through a similar interaction with pendrin. We have recently uncovered the molecular mechanism of secretin-stimulated renal HCO3− excretion. In the collecting duct, the secretin receptor is expressed in the basolateral membrane of β-ICs. After a meal or in response to an alkaline challenge secretin plasma levels increase. In the kidney, secretin triggers a marked urinary HCO3− excretion that is seen as an acute increase in urine pH, an increase in urine [HCO3−], and an increase of urine HCO3− excretion rates.6 This effect requires functionally intact β-ICs as it is absent in pendrin and CFTR KO mice.6 One of the hallmark findings of that study was the critical dependence of CFTR in permitting acutely stimulated urine base excretion in mice and humans.6
Here, we studied why CFTR KO mice fail to cope with a chronic base-load. We hypothesized that during base-loading, CFTR KO mice develop metabolic alkalosis because of a compromised ability of the collecting duct to up-regulate base secretion. We tested this hypothesis by analysing systemic acid-base parameters, urine pH, and urinary excretion of HCO3−, NH4+, and titratable acids (TA) in anaesthetized mice that had received distilled water or NaHCO3-enriched drinking water for 7 days. These in vivo experiments were complemented by a combination of immunoblotting and functional experiments with perfused isolated cortical collecting ducts.
2 RESULTS
2.1 Wildtype mice compensate a chronic base-load by enhanced urinary HCO3− excretion
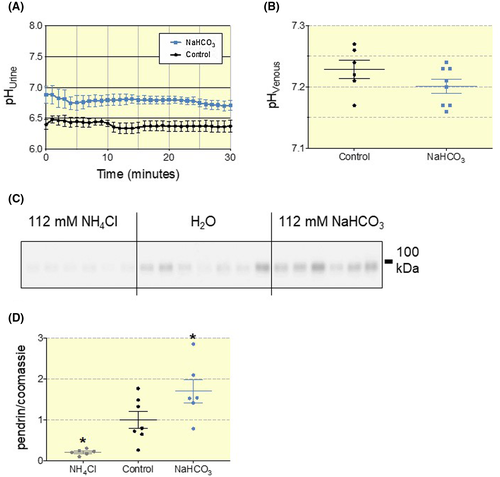
We hypothesized that WT mice fully compensate an inflicted base-load by increasing urinary HCO3− excretion and thereby avoid the development of metabolic alkalosis. To test this hypothesis, we established a NaHCO3-loading protocol in C57bl/6J mice by supplementing the drinking water with NaHCO3 (112 mmol/L) for 7 days. In base-loaded C57bl/6J mice, urinary pH was significantly elevated by 0.4 pH units compared to mice with access to distilled water (Figure 1A). pH and std. HCO3− of mixed venous blood was similar in the two groups (Figure 1B and Table S1), indicating full compensation of the imposed challenge by increased urinary excretion of HCO3−. Accordingly, we confirmed that chronic base-loading upregulated the expression of pendrin, whereas chronic acid-loading (mice fed 112 mmol/L NH4Cl drinking water for 7 days) downregulates pendrin expression (Figure 1C,D). We find an average of ~70% higher pendrin abundance in base-loaded animals and an ~80% reduction of pendrin abundance in acid-loaded versus control.
2.2 Pendrin is essential for the compensation of a chronic base-load
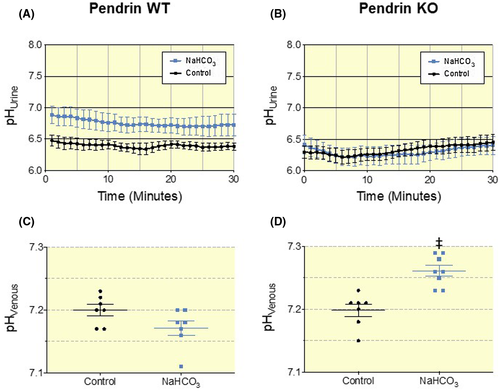
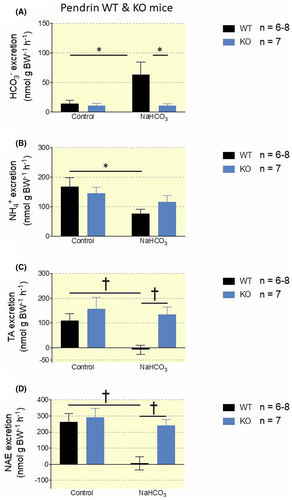
Next, we compared the response to the NaHCO3-loading protocol in pendrin WT and KO mice. Pendrin WT mice increased urinary pH in response to the base-load with a mean difference of 0.36 pH units and did not suffer any changes in systemic acid-base status (Figure 2A,C and Table S2). In contrast, blood pH and std. HCO3− was significantly elevated in pendrin KO mice receiving NaHCO3 enriched drinking water (Figure 2D and Table S2). Accordingly, Urine pH was not elevated in base-loaded pendrin KO mice compared to pendrin KO mice given distilled water (Figure 2B). Base-loaded pendrin WT mice had a 4.5-fold increased HCO3− excretion (P = .017, Figure 3A) and a near to absent net acid excretion (NAE) (P = .002, Figure 3A-D). In contrast, base-loaded Pendrin KO mice did not increase urinary HCO3− excretion (Figure 3A) and only slightly decreased NAE (P = .45, Figure 3A-D). This recapitulates pendrin as an essential transporter in regulating urinary pH, urinary base excretion, and maintaining systemic acid-base balance during a base-load. It also shows that pendrin KO mice are almost completely unable to regulate urinary pH, urine HCO3− excretion, and NAE when challenged with a moderate base-load.
2.3 Knock-out of CFTR abolishes the ability to compensate a chronic base-load
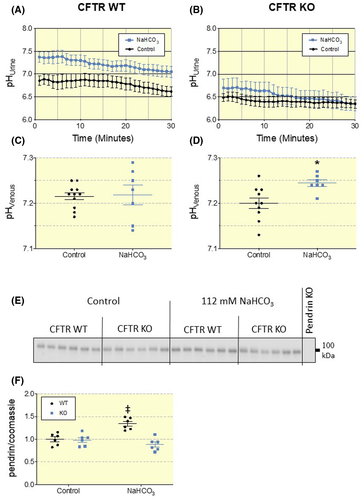
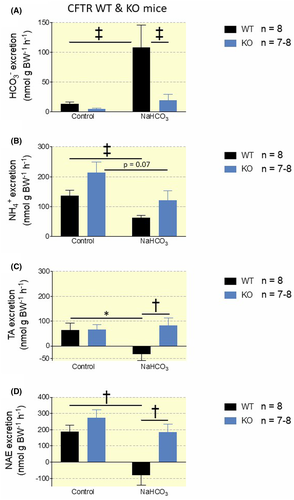
Subsequently, we compared the response of the NaHCO3-loading protocol in CFTR WT and KO mice. Again, WT mice suffered no disturbances in systemic acid-base parameters when challenged with alkaline drinking water (Figure 4C and Table S3). Base-loaded WT mice showed significantly increased urinary pH with a mean difference of 0.42 pH units versus controls (Figure 4A,C). In contrast, NaHCO3-loaded CFTR KO mice showed significantly increased blood pH and std. HCO3−, as also observed in the pendrin KO mice (Figure 3D and Table S3). Similar to the pendrin KO mice, CFTR KO mice were unable to increase urinary pH in response to a NaHCO3-load (Figure 4B). Base-loaded CFTR WT mice had an 8-fold increased urinary HCO3− excretion (P = .0002, Figure 5A) and decreased NAE to below 0 (P = .0017, Figure 5A-D). In contrast, base-loaded CFTR KO mice only had a small, non-significant increase in HCO3− excretion (P = .22, Figure 5A) and only a slightly decreased NAE (P = .22 Figure 5A-D). These findings underline that CFTR must play a key role in the regulation of urine HCO3− excretion and NAE.
2.4 CFTR-KO mice do not regulate pendrin expression in response to a 7-day base-load
It has previously been shown that after a 3-day base-load, CFTR KO mice exhibit lower pendrin expression compared to CFTR WT mice.5 However, the ability to alter pendrin expression to enable increased HCO3− excretion had not been investigated. Therefore, we assessed how lack of CFTR affects the regulation of pendrin expression in the kidney in response to a chronic base-load. Immunoblotting of pendrin in kidney lysates from CFTR WT mice showed a clear increase of pendrin protein after NaHCO3-loading as compared to mice receiving distilled water (Figure 4E,F).
Intriguingly, this difference in pendrin expression was not found in NaHCO3-loaded CFTR KO mice (Figure 4E,F). This indicates a pivotal role of CFTR in the regulation of pendrin and excretion of excess HCO3−. Interestingly, CFTR WT and KO mice receiving distilled drinking water presented with no difference in pendrin expression. Opposite, NaHCO3 treated CFTR WT mice had significantly higher pendrin expression than CFTR KO mice subjected to the same treatment (Figure 4E,F). From this, we conclude that loss of CFTR does not significantly affect the amount of pendrin in the kidney under resting conditions, but impairs the ability to increase pendrin expression in response to base-loading.
2.5 A reduced pendrin activity in the collecting duct of CFTR KO mice
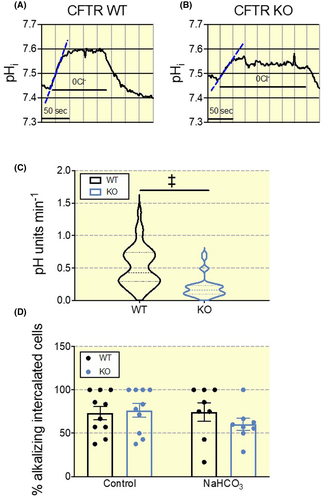
An increased protein expression does not necessarily translate into an increased function of a given protein. Thus, we investigated how base-loading alters pendrin function in CFTR KO and WT mice. To study this question directly, we used isolated perfused cortical collecting ducts to measure pendrin function in β-ICs. These cells were identified after luminal loading with BCECF-AM and rapidly removing luminal chloride in the presence of luminal HCO3− (see Figure 6 and “Methods” section for details). Fast removal of luminal Cl− causes an acute intracellular alkalization by inverting the function of the apical Cl−/HCO3− exchanger resulting in an influx of HCO3− (Figure 6A). The initial alkalization rate following luminal Cl− removal is taken to reflect the transport rate of pendrin.13 The results revealed that pendrin function was markedly higher in WT β-ICs as compared to CFTR KO mouse β-ICs after 7 days of base-loading (Figure 6C). The alkalization rates in WT β-ICs were also markedly higher as compared to our previously published data in the same mouse that had not received base loading, thus indicating marked activation of pendrin function (~0.2 pH units/min for un-loaded vs. ~0.5 pH units/min for base-loaded mice, P < .0001).6 The proportion of intercalated cells with apical Cl−/HCO3− exchange was not different between WT and KO CCDs during control conditions or after 7 days of base-loading (Figure 6D).
We also used an alternative protocol to measure pendrin function in base loaded CFTR WT and KO CD β-ICs. After 2 days of base-loading with either 100 mmol/L NaHCO3 or 200 mmol/L NaHCO3, we studied the effect of basolateral removal of Cl−. This manoeuvre should acutely reduce the intracellular Cl− concentration of the β-IC to cause an increased Cl− gradient over the apical membrane. In the case of functional pendrin, this increased Cl− gradient should cause an acute acidification of the cytosol. The results presented in Figure 7 clearly shows pendrin function in WT mice treated with 100mM NaHCO3 that is markedly upregulated in mice that have received 200mM NaHCO3 drinking water for two days. This contrasts sharply with the results obtained in CFTR KO tubules, where no upregulation of pendrin function could be detected. The proportion of intercalated cells that acidified because of the basolateral Cl− removal did not differ between genotypes during control conditions or after a two-day 100 mmol/L or 200 mmol/L NaHCO3 load (Figure S1A). However, the number of responding cells was significantly higher in CCDs of WT mice exposed to 200 mmol/L NaHCO3 as compared to controls reflecting the activation of pendrin. In contrast to the findings after a 7-day 112 mmol/L base-load, pendrin expression was not lower in CFTR KOs compared to WTs when subjected to 100 mmol/L or 200 mmol/L NaHCO3 drinking water for two days (Figure S1B,C).
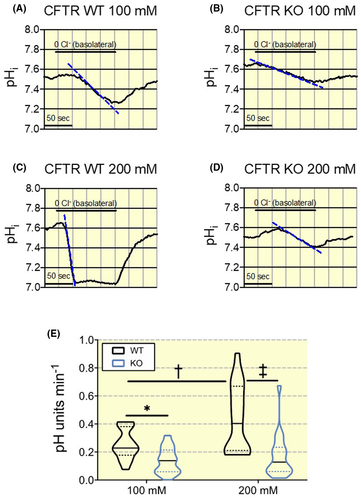
These results indicate that the absence of functional upregulation of pendrin is already visible after a two-day base challenge and that it is sustained for the entire period of 7 days base loading. Thus, these data provide further support that pendrin-dependent HCO3− secretion in β-ICs is markedly reduced in CFTR KO mice and cannot be functionally up-regulated after oral base loading.
3 DISCUSSION
It is well established that patients with cystic fibrosis have a higher incidence of metabolic alkalosis.3, 20, 21 Previous research points to a deficiency in the renal handling of HCO3−, but the exact mechanism behind this inability to excrete base-equivalents has yet to be elucidated. CFTR co-localizes with pendrin at the apical surface of cortical collecting duct cells.6 Additionally, we recently showed that CFTR is essential for the renal excretion of an acute oral HCO3− load and secretin-activated renal HCO3− excretion.6 In the current study, we sought to determine the role of CFTR in compensating a moderate, chronic base-load by exposure to 112 mmol/L NaHCO3-rich drinking water for 7 days.
Here, we confirm that NaHCO3-loading in WT mice increases urinary base-excretion and pendrin expression22 and significantly decreases NAE. Furthermore, we show that in WT mice a two-day NaHCO3-load leads to a dose-dependent functional upregulation of luminal Cl−/HCO3− exchange in the isolated CCD. Our data demonstrate that KO of pendrin or CFTR strongly impairs the ability of mice to maintain systemic acid-base balance in face of a moderate chronic base-load. Also, to the authors’ knowledge, this study is the first to provide a comprehensive urinary acid-base analysis of CFTR KO and pendrin KO mice subjected to base-loading. Our results show that loss of CFTR or pendrin almost completely abolished the ability to regulate urinary pH, urinary HCO3− excretion, and NAE in response to a moderate 7-day base-loading. In CFTR KO mice, this likely results from an inability to stimulate pendrin function and expression during base-loading. One could also speculate that proximal tubule (PT) or thick ascending limb mediated HCO3− absorption is downregulated during a base challenge and participate in an increased urine HCO3− excretion. It has been reported that a chronic NaHCO3 load downregulates PT NHE3 expression and function.23, 24 CFTR is expressed in the PT but has not been linked to HCO3− transport in this segment.25 Our study does not rule out the theoretical possibility of PT CFTR as a molecular player in downregulation of PT HCO3− absorption. In support of a key role of CFTR in the CCD, we found that luminal Cl−/HCO3− exchange activity is much lower in β-ICs from CFTR KO mice after 7 days of base-loading as compared to CFTR WT mice. Also, given either 100 mmol/L or 200 mmol/L NaHCO3 in the drinking water for 2 days, CFTR KO mice had markedly lower pendrin function compared to WT mice exposed to the same protocol. In the current study, we found that pendrin protein expression is only lower in CFTR KO mice as compared to WTs, after the mice have been challenged with an increased intake of NaHCO3 for 7 days. Noteworthy, we see a significantly lower pendrin function in CFTR KO β-ICs after a two-day 100 mmol/L or 200 mmol/L base-load, although pendrin expression was tentatively higher in CFTR KO mice at this time point. We have previously shown, that even during resting conditions, loss of CFTR blunts apical Cl−/HCO3− function in β-ICs of the CCD,6 which indicates that CFTR may regulate pendrin function. This discrepancy between expression and function could be attributed to a decreased trafficking of pendrin to the apical membrane in CFTR KO mice, as suggested by others during base-loading.5 Alternatively, it could be caused by reduced functionality of pendrin in β-ICs when CFTR is absent, as shown in cultured airway cells and parotid duct cells.10, 26 Indeed it has been suggested that pendrin needs CFTR for the recycling of Cl− to maintain a favourable gradient for Cl−/HCO3− exchange.5 Another possibility could be that CFTR is needed to anchor pendrin at the apical cell membrane. All listed scenarios are plausible. However, more research is needed to answer this question. Pendrin, like other SLC26 transporters, has a highly conserved cytoplasmic C-terminal Sulfate Transporter and Anti-Sigma factor antagonist (STAS) domain.27 CFTR has been shown to functionally interact with the SLC26A6 and SLC26A3 (DRA), through this STAS domain.17 The exact molecular interactions responsible for the CFTR-dependent pendrin induction remain to be elucidated. But in similarity with other SLC26 transporters, the STAS domain might also play a crucial role in the CFTR-dependent pendrin induction. Whether CFTR itself plays a central role in compensating a metabolic alkalosis or is solely a necessity for functional β-ICs and appropriate cellular responses in these cells is not known. In the pancreatic duct, CFTR exhibits considerable HCO3− permeablity when intracellular Cl− concentration decreases and this is pivotal for HCO3− secretion in this organ.28 It is possible that CFTR also in the kidney acts as a HCO3− channel under certain circumstances. As such, a possible regulation and activation of CFTR during base-loading warrants further investigation. Noteworthy, both CFTR and pendrin are activated by intracellular increases in cAMP, and loss of the cAMP producing molecule, adenylyl cyclase 6, also leads to a decreased ability to compensate a metabolic alkalosis.29
Other renal phenotypes have been reported in CF patients, including nephrolithiasis30 and a reported phenomenon of Pseudo-Barrter syndrome (hyponatremic, hypochloremic metabolic alkalosis).31 These phenotypes are not yet completely understood. Loss of CFTR leads to impaired intestinal oxalate secretion by SLC26A6 and hence hyperoxalemia and hyperoxaluria caused by increased net absorption.32 Because of exocrine pancreatic insufficiency in CF the associated lipid malabsorption links with enteric hyperoxaluria.33 Together, these entities provide a plausible explanation for why CF patients can develop oxalate kidney stones more commonly. The CF typical phenomenon of Pseudo-Barrter syndrome has traditionally been explained by an excessive loss of Na+ and Cl− with the sweat.31 This would result in volume contraction and hyperaldosteronism, which would propel the kidneys into unwarranted kaliuresis.31 Several SLC26 transporters, besides pendrin, are expressed in the kidney.34, 35 Numerous of these have been shown to interact functionally with CFTR and several others could be hypothesized to also do this.17, 36, 37 Whether loss of function of these transporters could reveal additional renal phenotypes or offer further explanation for disease phenotypes in CF is currently unknown. Nevertheless, our current and recent results, substantiate a distinct functional role for CFTR in the kidney. These findings emphasize the need for further inspection of renal electrolyte and acid-base handling in CF patients and animal models to outline possible underlying molecular mechanisms for how CF affects renal function.
In conclusion, we provide sound evidence that CFTR plays an essential role in the regulation of renal HCO3− excretion and NAE. We hereby confirm and significantly expand previous studies reporting impaired renal HCO3− excretion in CFTR KO mice.5, 6 Together these studies highlight a key role for CFTR in the kidneys which explains one of the many phenotypes observed in CF patients, namely metabolic alkalosis.
4 MATERIALS AND METHODS
4.1 All submitted material conforms with good publishing practice in physiology38
4.1.1 Animals
All experiments in genetically modified mice were performed in littermates from heterozygotes breeding in our animal facility. 10 week old male C57Bl/6J mice were purchased from Janvier, France and acclimatized for 7 days before use. All mice were kept in a room with a 12-hour light/dark cycle and had ad libitum access to chow (Maintenance diet, 1328, Altromin, Germany) and tap water. Handling and experiments were approved by Danish animal welfare regulations (Dyreforsøgstilsynet, 2016-15-0201-01129). For in vivo experiments with gene-modified mice, mice of both genders with an approximate age of 2-4 months were used. See Tables S1-S3 for age and gender distribution. For tubule perfusion experiments mice aged 4-6 weeks were used. An overview of the number of mice included in the study is shown in Figure S2.
Pendrin KO and WT mice: Produced by insertion of a neo-cassette replacing exon 8 in the Scl26a4 gene, leading to loss of pendrin expression.39 Purchased from The Jackson Laboratory, JAX stock #018424. Background: 129S1/SvImJ.
CFTR KO and WT mice: FABP-hCFTR-CFTR bitransgenic mice. Transgenic global CFTR KO mice with expression of human CFTR (hCFTR) under the promoter activity of rat fatty acid binding protein 2, intestinal (Fabp2) promoter, which corrects the otherwise lethal intestinal phenotype in CFTR KO mice.40 Purchased from The Jackson Laboratory, JAX stock #002364. Background: C57Bl/6 and 129P2/OlaHsd.
4.1.2 Bicarbonate and ammonium loading protocols
Mice were randomly assigned to either HCO3−-enriched drinking water or control water. HCO3−-loaded mice were given 112 mmol/L NaHCO3 in the drinking water for 7 days, whereas control mice had free access to distilled water. Acid-loaded mice were given 112 mmol/L NH4Cl in the drinking water for 7 days. Mice euthanized for tubule perfusion were fed either 100 or 200 mmol/L NaHCO3 drinking water for two days or 112 mmol/L for 7 days.
Electrolytes and hydration status (estimated by haematocrit levels and diuresis) are shown in Table S1. These data indicate a slight volume contraction in base-loaded C57Bl/6J mice, whereas this is not detected in the remaining mouse models.
4.1.3 In vivo continuous urinary pH measurements
The animals were anaesthetized by intraperitoneal (i.p.) injection of 0.1 mL/g body weight (BW) of a ketamine-xylazine mix (10 mg/mL and 1 mg/mL respectively). The anaesthesia was sustained by continuous intravenous (iv) infusion at a rate corresponding to half of the induction dose per hour. The urinary bladder was catheterized and urinary pH was measured continuously for 30 minutes by a micro pH electrode (pH-200, Unisense, Aarhus, DK) in the outflow of the catheter. The mean of every 60 seconds was calculated and used for statistical analysis and graphing. The urine outflow from the catheter was collected every 5 minutes. After the experiments, the animals were euthanized under the anaesthesia. Urine flow rates are shown in Tables S1-S3.
4.1.4 Measurement of urinary net acid excretion

4.1.5 Analysis of blood pH and electrolytes
Retro-orbital blood samples were collected from anaesthetized mice, with glass capillaries followed by immediate analysis with an arterial blood-gas analyser, ABL 80Flex, Radiometer, Denmark adjusted to mixed venous samples. The mice were euthanized under the anaesthesia immediately after blood sampling. All measured relevant electrolytes and acid-base parameters are shown in Tables S1-S3.
4.1.6 Tubule perfusion of the cortical collecting duct
Mice were euthanized by cervical dislocation. The kidneys were removed, placed, and sliced in ice-cold (4°C) control solution (see below). The cortical collecting ducts were isolated from the cortex with ultrafine forceps. The dissected cortical collecting ducts were transferred to a tissue chamber and perfused with a concentric pipette system as described previously,43 with Na+ free solution at 37°C. Cortical collecting ducts were mechanically stabilized near the bath bottom with an additional holding pipette. The perfusion chamber was mounted on an inverted fluorescence microscope (Axiovert 100 TV, Zeiss, Germany). The setup comprises an inverted microscope with a 63x C-Apochromat 1.2NA water objective.
4.1.7 Intracellular pH measurements
Intracellular pH (pHi) was measured with the ratiometric fluorescent dye 2′,7′-bis-(2-carboxyethyl)-5-(and-6)-carboxyfluorescein acetoxymethyl ester (BCECF-AM, Invitrogen ). CCDs were incubated with 10 µmol/L luminal BCECF-AM in control solution for 10 minutes at 37°C during continuous luminal and bath perfusion. The luminal BCECF loading in CCDs led to selective dye loading into the intercalated cells and was verified in each experiment.44 A monochromator (Polychrome IV, Till Photonics, Planegg, Germany) was used for excitation. The preparation was excited for 10 ms at 436 nm and 25 ms at 490 nm to achieve a baseline ratio near three. The pHi was measured every 2 seconds as the emission ratio at 490/436nm excitation. Emitted light was collected through a dichromatic mirror with a 500nm beam split followed by a 520-560nm bandpass filter and with preset camera binning of 4. A CCD camera (MicroMax, 5MHz, Princeton Instruments, NJ, USA) was used for image acquisition and data analysis were performed with Metamorph/Metafluor (Universal Imaging, West Chester, PA, USA).
The experiments were carried out after the fluorescence signal was stabilized and the fluorescence of the entire tubule was recorded and used for subsequent data analysis of single cells.
β-intercalated cells were identified by an intracellular alkalization (after fast luminal Cl− removal) or intracellular acidification (after fast basolateral Cl− removal) (shift from solution 1 to solution 2) (Figures 6 and 7).45 This response was distinct from the absent response (after fast luminal Cl− removal) and the intracellular alkalization (after fast basolateral Cl− removal) observed in α-cells.
Experimental solutions: (a) Control contained (in mM) 118 NaCl, 1 MgSO4, 1.3 Ca-gluconate, 5 D-glucose, 0.4 KH2PO4, 1.6 K2HPO4, 25 NaHCO3; 5 HEPES. (b) Cl− free contained (in mM) 120 Na-gluconate, 1 MgSO4, 4 Ca-gluconate, 5 D-glucose, 0.4 KH2PO4, 1.6 K2HPO4, 24 NaHCO3; 5 HEPES. (c) Na+ free contained (in mM) 125 NMDG, 105 HCl, 1 MgSO4, 1.3 Ca-gluconate, 5 D-glucose, 0.4 H2PO4, 1.6 K2HPO4, 24 Choline-HCO3, 5 HEPES. All solutions were titrated to pH 7.4 at 37°C before addition of NaHCO3 or Choline-HCO3 with either NaOH or HCl.
Calibration of the BCECF signal was performed using nigericin in the presence of high [K+].46 To avoid time-dependent shifts in the calibration curve, calibration was carried out in a separate calibration series time-matched with initiation of the Cl− removal manoeuvre. Calibration solution (in mM): 95 KCl, 15 NaCl, 0.4 NaH2PO4, 1.6 Na2HPO4, 5 glucose, 1 MgCl2, 1.3 Ca-gluconate, 25 HEPES, 20 NMDG, supplemented with 2µM nigericin. The calibration solutions were titrated to pH 6.5, 7.0 and 7.5 at 37°C.
4.1.8 Immunoblotting
Tissue was harvested for immunoblotting as described by Larsen et. al.47 Shortly; mice kidneys were cut in half and processed in lysis buffer in a tissuelyser in 30 seconds (Qiagen). The supernatant was collected and spun for 15 minutes at 1000 g. Protein concentrations were determined by PierceTM BCA Protein Assay Kit and loaded relative to a Coomassie-stained loading-control. All samples were run on criterion™ TGX™ Precast Gels (Bio-rad). Ten µg of total protein was loaded into each well which was validated to be within linear detection range for the used antibody (Figure S3). Membranes were developed using Clarity™ Western ECL substrate (bio-rad) in an ImageQuant LAS 4000 mini (GE Healthcare Life Science). The pendrin antibody, a kind gift from Dr Sebastian Frische,48 was diluted at 1:1000. To ensure that the amount of protein loaded was in the linear detection range for the antibody, western blots were blotted with a sample dilution series (Figure S3). We confirmed specificity by comparison to the signal obtained from the kidney tissue of pendrin KO mice (Figure S3). Density signals of pendrin were normalized to the signal of a Coomassie staining of the membranes post chemiluminescent detection of the protein of interest to enable correction for differences in protein loading.49 All images were analysed using Image StudioTM Lite (Li-Cor). Uncropped images of the immunoblots in Figure 1 and Figure 3, Figures S1 and S3 and their corresponding Coomassie-stained membranes are shown in Figure S4.
4.1.9 Statistics
All statistical analyses were performed in GraphPad Prism (GraphPad Software, USA). The distribution of data was evaluated by the generation of QQ-plots. A few data sets did not follow an approximation of the normal distribution. These were log-transformed before statistical analysis, which in all cases led to a good approximation of a normal distribution. These instances are mentioned in the figure legends. A comparison between two groups was performed by student's t test. A comparison between more than two groups was analysed by one-way ANOVA followed by correction for multiple comparisons. A comparison between two groups with more than one intervention was performed by two-way ANOVA followed by correction for multiple comparisons. A comparison of data collected time-dependently was performed by two-way ANOVA. The used statistical test is stated in each figure legend. Data are shown as mean ± SEM or violin plots. All statistical analyses were two-sided and performed at a significance level of 5%. *, † and ‡ indicate P-values of respectively <.05, ≤.01 and ≤.001.
ACKNOWLEDGEMENTS
We thank Sebastian Frische for providing the pendrin antibody and provision of the custom-build small volume HCO3− measuring device. We thank Jesper Frank Andersen for fruitful discussions and experimental assistance. Expert technical assistance from Karen Skjødt Sørensen is greatly appreciated.
CONFLICT OF INTEREST
The authors have no conflicts of interest to declare.
Funding information
This project was supported by the Independent Research Fund Denmark DFF 6110-00131, The AP Møller Fund, and Helga and Peter Kornings Fund.
AUTHOR CONTRIBUTIONS
JL, PB, and MVS developed the project idea. THLH, PB, SLS, MVS, HAP and JL performed and/or analysed the experiments. JL and PB drafted the manuscript. All authors critically revised the manuscript for important intellectual content and approved the final version.


