Secretory autophagy and epithelial-to-mesenchymal transition in cadaveric AMD samples: Novel pathways in disease progression
Abstract
Purpose
To examine the presence of secretory autophagy and epithelial–mesenchymal transition (EMT) in the macular retinal pigment epithelium (RPE) of human cadaver eyes with different forms of age-related macular degeneration (AMD).
Methods
Human cadaver macula samples representing dry and wet AMD, as well as age-matched controls, were analyzed using immunohistochemistry. Markers of secretory autophagy, EMT, and inflammation were evaluated in RPE cells.
Results
Increased expression of proteins associated with secretory autophagy and EMT was detected in the RPE of AMD samples compared to controls. These changes were observed in both dry and wet AMD forms.
Conclusion
Secretory autophagy and EMT are elevated in the macular RPE of AMD-affected eyes. These observations offer novel insight into AMD progression and potential therapeutic approaches.
To our knowledge, this is the first study to demonstrate that secretory autophagy and epithelial–mesenchymal transition (EMT) are simultaneously upregulated in different forms of age-related macular degeneration (AMD) in human cadaver macula samples. Increased oxidative stress, mitochondrial and lysosomal dysfunction, protein aggregation and complement activation and inflammation are well-established biomarkers of retinal pigment epithelial (RPE) cell degeneration (Kaarniranta et al., 2020). Phenotypic changes in the RPE cells and drusen accumulation are early clinical signs of AMD progression (Hyttinen et al., 2024; Kaarniranta et al., 2023).
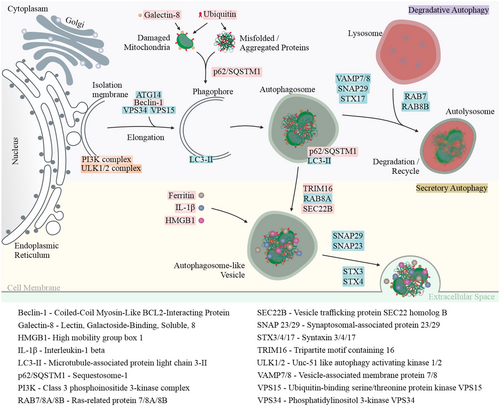
Quiescent RPE cells are essential for regulating the visual cycle, including the clearance of photoreceptor outer segments in lysosomes and the degradation of damaged proteins and organelles. Lysosomal autophagy functions as a key cellular quality control mechanism, breaking down and recycling non-functional proteins and damaged organelles (Kaarniranta et al., 2023). Autophagy-related proteins regulate both conventional degradative autophagy and an unconventional secretory pathway. While degradative autophagy facilitates the breakdown of cellular components, secretory autophagy enables the controlled release of specific proteins, lipids and immune mediators into the extracellular space (Figure 1).
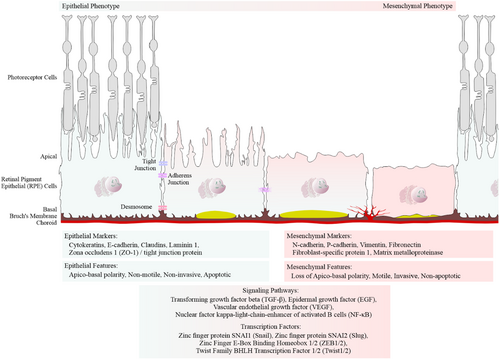
EMT is a biological process in which polarized epithelial cells, such as the RPE cells, undergo biochemical changes that acquire a mesenchymal phenotype. This transition is characterized by increased extracellular matrix production, enhanced migratory capacity, invasiveness and resistance to apoptosis (Figure 2; Liukkonen et al., 2022; Kaarniranta et al., 2023).
Cadaveric eye tissues, collected postmortem, were used in this study. After enucleation, the eyes were fixed for 3 days at room temperature (RT) using a 10% formalin fixative from Reagena Oy (Catalogue No. 112256). Following primary fixation, the globes were horizontally dissected into three parts, post-fixed in 10% formalin Avantor ScienceCentral™ (Catalogue No. VWRQ11699455) for 1.5 h at room temperature (RT) and then processed into paraffin. Parasagittal sections were cut from the central part of the globe, including the macular region. This included both the neurosensory retina and the underlying RPE. For immunohistochemical analysis, 5 μm parasagittal sections were used for staining. Detection of primary antibodies (Table 1) was performed using the Vector ImmPRESS® Polymer Kit, according to the manufacturer's protocol. Nuclei were counterstained with Haematoxylin QS (Catalogue No. H-3404-100-NB). Brightfield images were acquired using Zeiss Axio Imager.M2 (Zeiss, DE), focusing on the RPE and neurosensory retina at 20× and 5× magnification, respectively. Imaging was performed using EC Plan-Neofluar 20×/0.50 M27 and EC Plan-Neofluar 5×/0.15 M27 lenses under identical microscope settings. Colour intensity was quantified using ImageJ v1.54f with the colour deconvolution method. Data are presented as mean ± SEM. Statistical significance was assessed using the nonparametric Kruskal–Wallis test, followed by Dunn's multiple comparisons test. A p-value <0.05 was considered statistically significant; ‘ns’ denotes not significant.
| Primary antibodies against | Host | Working dilution | Supplier catalogue number |
|---|---|---|---|
| Amyloid-β | Mouse | 1:250 | MABN10 |
| Beclin-1 | Rabbit | 1:200 | NB500-249 |
| C3 | Rabbit | 1:50 | NBP2-66994 |
| C5 | Rabbit | 1:50 | ab217027 |
| Ferritin | Rabbit | 1:300 | MA5-32244 |
| Fibronectin | Mouse | 1:100 | sc-271 098 |
| Galectin-8 | Rabbit | 1:100 | PA5-50965 |
| HMGB1 | Mouse | 1:100 | ab11354 |
| Iba1 | Rabbit | 1:300 | 019-19741 |
| IL-1β | Goat | 1:100 | AF401 |
| N-cadherin | Mouse | 1:100 | sc-59987 |
| p62/SQSTM1 | Mouse | 1:250 | sc-28359 |
| SEC22B | Rabbit | 1:200 | ab181076 |
| SLUG | Mouse | 1:100 | sc-166476 |
| TGF-β2 | Mouse | 1:50 | MAB612 |
| TRIM16 | Rabbit | 1:100 | PA5-110515 |
| Ubiquitin | Rabbit | 1:100 | Z0458 |
| VEGF | Rabbit | 1:100 | RB-9031-P |
| Vitronectin | Mouse | 1:50 | sc-74484 |
| ZO-1 | Rat | 1:50 | sc-33725 |
The study was approved by the Ethics Committee of Kuopio University Hospital (approval numbers 06/2006 and 42/2014) in accordance with the principles of the Declaration of Helsinki. Patient data were collected and securely stored in compliance with the European Union Regulation 2016/679 on personal data protection.
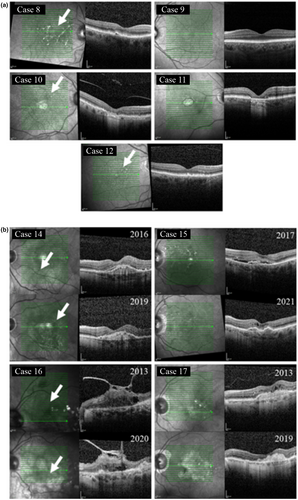
The sample groups were selected and characterized based on data from the Kuopio University Hospital Database, which provides a comprehensive record of individuals' lifetime medical history. For the control group, the selection of the left or right eye was based on the quality of tissue sections (Table 2). Control samples were obtained from cadaveric eyes that had no clinical or histological evidence of AMD. These samples were confirmed to lack AMD features, such as drusen, by examination of counterstained sections. In contrast, the dry AMD and wet (neovascular) AMD groups were defined based on documented clinical diagnoses. Further confirmation was provided by optical coherence tomography (OCT) images acquired during treatment (see Tables 3 and 4, Figure 3).
| Control | ||||
|---|---|---|---|---|
| Sample No | ID | Gender | Eye | Age (years) |
| 1 | Case 1 | Female | Left | 92 |
| 2 | Case 2 | Male | Left | 75 |
| 3 | Case 3 | Male | Left | 88 |
| 4 | Case 4 | Male | Left | 92 |
| 5 | Case 5 | Female | Right | 87 |
| 6 | Case 6 | Male | Left | 93 |
| 7 | Case 7 | Female | Right | 88 |
| Dry AMD | ||||
|---|---|---|---|---|
| Sample No | ID | Gender | Eye | Age (years) |
| 1 | Case 8 | Female | Right | 88 |
| 2 | Case 9 | Female | Left | 74 |
| 3 | Case 10 | Female | Right | 91 |
| 4 | Case 11 | Male | Right | 94 |
| 5 | Case 12 | Female | Right | 92 |
| 6 | Case 13 | Female | Right | 95 |
| Wet AMD | |||||||
|---|---|---|---|---|---|---|---|
| Sample No | ID | Gender | Eye | Age (years) | Age at first injection (years) | Injections per year (y^) | Total No of injections |
| 1 | Case 14 | Female | Left | 88 | 83 | y1 (B3); y2 (0); y3 (0); y4 (0); y5 (0); y6 (0); y7 (0); y8 (0); y9 (0); y10 (0); y11 (0); y12 (0) | Bevacizumab (3) |
| 2 | Case 15 | Female | Left | 74 | 84 | y1 (B9); y2 (B3, A3); y3 (B3, A1); y4 (B4); y5 (0); y6 (0); y7 (0); y8 (0); y9 (0); y10 (0); y11 (0); y12 (0) |
Bevacizumab (19) Aflibercept (4) |
| 3 | Case 16 | Female | Left | 91 | 85 | y1 (B2); Outside of Wet AMD treatment Criteria | Bevacizumab (2) |
| 4 | Case 17 | Female | Left | 94 | 72 | y1 (R9); y2 (B1, R5); y3 (B4); y4 (B5); y5 (B5); y6 (B5); y7 (B6); y8 (B6); y9 (B6); y10 (B6); y11 (B3, A2); y12 (A1); Outside of Wet AMD treatment Criteria |
Bevacizumab (56) Aflibercept (3) Ranibizumab (14) |
- Note: ^: Consecutive years, B*: Bevacizumab, A*: Aflibercept, R*: Ranibizumab, *: No of injections.
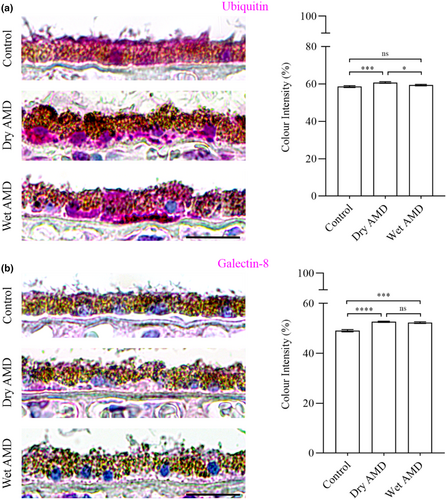
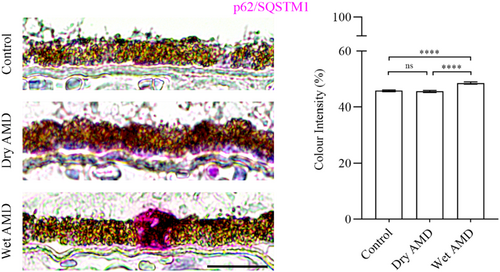
Our data revealed a significant increase in ubiquitin levels in the RPE cells from dry AMD, and an elevation in galectin-8 levels in the RPE cells from both dry and wet AMD (Figures 1 and 4a,b). Furthermore, the ubiquitin-binding protein p62/SQSTM1 was markedly upregulated in wet AMD compared to both the control group and dry AMD (Figure 5), while Beclin-1 levels were significantly higher in the RPE cells from both dry and wet AMD relative to controls (Figure 6). These findings indicate an accumulation of damaged or non-functional proteins and organelles that are targeted for degradation. The elevated expression of p62/SQSTM1 and Beclin-1 suggests an enhanced activation of the degradative autophagy pathway. However, the concurrent accumulation of these damaged components may also be indicative of an insufficient degradative autophagic flux.

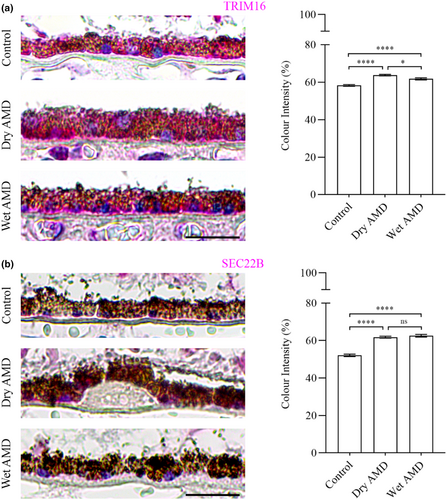
Next, we analysed TRIM16 and SEC22B, which are specifically involved in secretory autophagy, including cargo recognition and fusion with the plasma membrane. TRIM16 levels were significantly increased in both dry and wet AMD compared to the control group (Figure 7a). Similarly, SEC22B expression was markedly elevated in both dry and wet AMD relative to controls (Figure 7b), suggesting a strong upregulation of secretory autophagy in both dry and wet AMD.
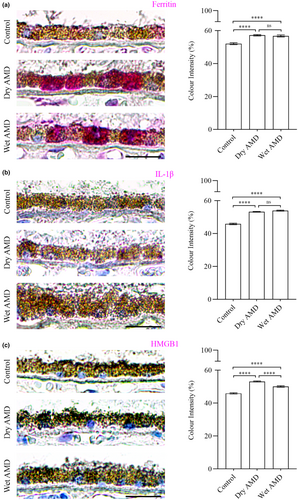
Secretory autophagy plays a role in the secretion of specific cargos, including Ferritin, which regulates iron homeostasis, the proinflammatory cytokine IL-1β and the nuclear protein HMGB1, which acts as a danger signal contributing to inflammation and cell migration. In our study, we observed a marked increase in Ferritin (Figure 8a), IL-1β and HMGB1 levels in both dry and wet AMD compared to controls (Figure 8b,c). These findings align with the elevated activity of secretory autophagy in AMD, further supporting its role in disease progression.
Additionally, we analysed the major drusen-associated aggregation protein, amyloid-β and the extracellular matrix component, Vitronectin, in dry and wet AMD compared to control groups (Figure 9a,b).

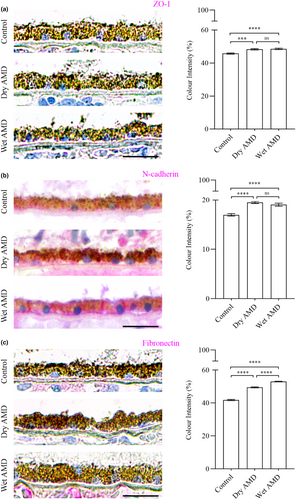
Furthermore, we performed immunostaining for the tight junction protein ZO-1 (Figure 10a) and the mesenchymal markers N-cadherin and fibronectin in control, dry AMD and wet AMD tissue samples (Figures 2 and 10b,c). Our analysis revealed a significant increase in ZO-1, N-cadherin and fibronectin levels in both dry and wet AMD compared to the control group (Figure 10).
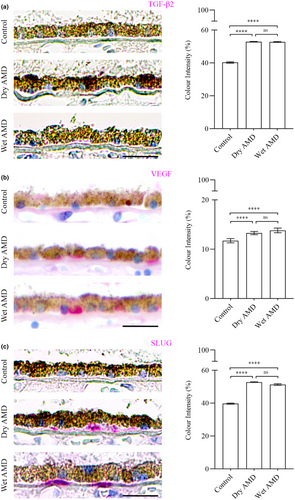
The analysis of EMT regulators, including TGFβ-2 (Figure 11a), VEGF (Figure 11b) and the transcription factor SLUG (Figure 11c), revealed a significant increase in both dry and wet AMD compared to the control group. These findings align with the upregulation of circulatory EMT markers, indicating a potential role of EMT in AMD pathophysiology (Liukkonen et al., 2022).
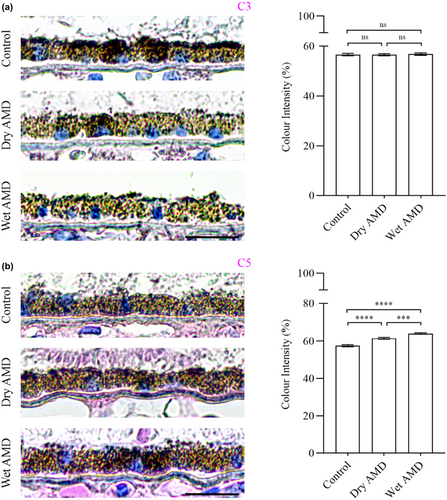
Lastly, we analysed inflammatory markers, including complement components C3, C5 (Figure 12) and the microglial marker Iba1 (Figure 13). We observed no differences in C3 levels between control, dry and wet AMD (Figure 12a). In contrast, C5 levels were significantly increased in both dry and wet AMD compared to the control group (Figure 12b). We observed sporadic Iba1 positivity in the control retina with consistent positivity in both dry and wet retinal tissues (Figure 13).

1 DISCUSSION
Overall, the observed increases in ubiquitin and galectin-8 indicate the accumulation of damaged or non-functional proteins and organelles. Elevated levels of autophagy-related proteins, such as p62/SQSTM1 and Beclin-1, suggest an upregulation of the degradative autophagy pathway. However, recent studies (Kaarniranta et al., 2023) show that increased oxidative stress can overwhelm and exhaust this pathway. Consistent with these findings, the build-up of damaged cellular components in both dry and wet AMD suggests that the degradative autophagy pathway lacks sufficient clearance capacity under stress in the RPE cells.
In response, the secretory autophagy pathway may become activated to alleviate cytoplasmic burden. This is supported by increased expression of TRIM16, SEC22B, ferritin, IL-1β, HMGB1, amyloid-β and vitronectin. Secretory autophagy enables the translocation of intracellular components, such as amyloid-β, to the extracellular space and their participation in the drusen biogenesis (Hyttinen et al., 2024).
Moreover, elevated levels of the tight junction protein ZO-1, along with mesenchymal markers N-cadherin and fibronectin, suggest that the RPE cells adopt a non-canonical or partial EMT phenotype. This is further supported by increased expression of EMT regulators such as TGF-β2, VEGF and SLUG. Although traditional EMT typically involves a reduction in epithelial proteins like ZO-1, its upregulation here may reflect a compensatory response or a unique, partial EMT state in AMD.
In the complement system, elevated C5 levels—despite unaltered C3—in the RPE cells from both dry and wet AMD may reflect rapid C5 turnover or activation at a later stage. Notably, C5 can be activated independently of C3, possibly via thrombin, as shown in an AMD-like animal model (Sridevi Gurubaran et al., 2021). Additionally, the increased number of Iba1-positive cells was mostly confined to the inner retina, with only a few cells observed in close proximity to the RPE cells, suggesting that immune cell infiltration near the RPE is limited in our samples. This may indicate a secondary inflammatory response.
Together, these findings suggest that secretory autophagy contributes to both drusen formation and EMT during AMD progression and may potentially open new avenues for therapeutic intervention.
ACKNOWLEDGEMENTS
We thank our colleague Anne Seppänen and study nurse Kati Mönttinen for their expertise in tissue preparation and their assistance with laboratory procedures. Open access publishing facilitated by Ita-Suomen yliopisto, as part of the Wiley - FinELib agreement.


