Retinal oedema in central retinal artery occlusion develops as a function of time
Abstract
Purpose
Time is the key criterion in the management of non-arteritic central retinal artery occlusion (NA-CRAO). However, the precise onset of vision loss is often difficult to determine. This study aimed to evaluate the temporal changes of retinal thickness in acute NA-CRAO and the potential of this parameter to be used as a surrogate marker to estimate the onset of retinal ischaemia.
Methods
Optical coherence tomography was used to continuously assess retinal thickness and oedema progression rate in six porcine eyes. Additionally, a retrospective analysis of 12 patients with acute NA-CRAO was performed to determine association strength and progression rate between retinal thickness and onset of ischaemia. All Optical coherence tomography (OCT) scans (pigs and NA-CRAO patients) were performed within an ischaemic time frame of up to 9 hr.
Results
Retinal oedema progression rate in pigs was 25.32 µm/hr [CI 95%: 24.24–26.40 µm/hr]. Retrospective analysis of the patients revealed a strong correlation between retinal oedema and duration of ischaemia (Spearman's rho = 0.77, p = 0.004) with an estimated progression rate of 10.02 µm/hr [CI 95%: 3.30–16.74 µm/hr].
Conclusion
Retinal thickness increases with oedema formation, and ischaemia onset is strongly correlated with this structural biomarker in both, pigs and NA-CRAO patients. Prospective clinical trials will have to determine the clinical feasibility of retinal thickness measurements as a biomarker to support clinical management of NA-CRAO.
Introduction
Acute non-arteritic central retinal artery occlusion (NA-CRAO) is an ophthalmologic emergency causing sudden, severe and permanent vision loss in more than 90% of the cases (Biousse et al. 2007). As the retinal equivalent to the cerebral ischaemic stroke, where the time to treatment (time between ischaemia onset and initiation of treatment) has been established as the fundamental criterion in the decision-making in terms of risks and benefits of a thrombolytic therapy, NA-CRAO deserves to be appraised similarly (Wardlaw et al. 2014). Studies on non-human primates suggest that the retina can tolerate up to 1.6 hr of ischaemia with virtually no damage, whereas retinal damage after 4 hr of ischaemia or longer seemed to be irreversible (Hayreh et al. 2004). Despite those findings, previous large scale randomized clinical trials, such as the study conducted by the European Assessment Group for Lysis in the Eye (EAGLE) group, demonstrated no clinically significant difference between thrombolysis and conservative treatment (Schumacher et al. 2010). However, patients in the EAGLE study received thrombolytic treatment after a mean of 12.78 ± 5.77 hr from visual symptoms onset. With respect to the limited retinal ischaemia tolerance, this seems to be by far too late. Several other studies have suggested treatment efficacy, yet mostly have lacked either control, randomization or scale (Hattenbach et al. 2008; Nedelmann et al. 2015; Schrag et al. 2015). A meta-analysis by Schrag et al. (2015) reports a favourable outcome if thrombolysis is administered within 4.5 hr after onset of ischaemia (Schrag et al. 2015). Despite a well-established efficacy of thrombolysis in ischaemic cerebral stroke, the efficacy assessment of thrombolytic treatment in acute NA-CRAO nonetheless remains inconclusive as a large, multicentric, randomized and well-designed trial of NA-CRAO management has yet to be initiated.
Employing time of onset as a possible estimator of ischaemic damage extent and visual recovery potential has several limitations. In the clinical setting, determining the precise time of onset is not always a trivial task, as it primarily relies on patient reports, which are often of limited reliability when patients are unsure, or confused. In other cases, patients develop NA-CRAO in their sleep and therefore cannot provide an estimate on the time of onset (Rudkin, Lee, & Chen 2009). Moreover, when time of onset can be determined precisely, it still cannot fully account for the variability of CRAO, as it is known that factors such as cilioretinal artery sparing, residual retinal circulation and CRAO type (arteritic versus non-arteritic) give rise to significant variability in terms of visual outcome (Hayreh & Zimmerman 2005). Therefore, an objective and reliable biomarker could provide additional value in assessing the risk to benefit ratio of thrombolytic therapy in acute CRAO.
Traditionally, fluorescein angiography (FA) has been used to evaluate retinal perfusion. In NA-CRAO, FA typically shows a delayed filling of retinal arteries and a prolonged arteriovenous transit time (Schmidt, Schulte-Mönting, & Schumacher 2002). Although FA is the gold standard to analyse retinal perfusion, this method is invasive and time-consuming, which especially in the context of an emergency such as acute CRAO is inappropriate, as prolonged ischaemia induces progressive retinal degeneration due to the extremely limited retinal ischaemia tolerance resulting in a worse initial situation for a possible treatment (time is retina) (Hayreh et al. 2004). Also, FA does not give information regarding ischaemia onset.
Optical coherence tomography (OCT) represents a non-invasive imaging method, which provides a virtually instantaneous reconstruction of the retinal microstructure. Moreover, typical signs of neuroretinal ischaemia, such as oedema and loss of ganglion layer transparency, can readily be seen on OCT (Ahn et al. 2015). Therefore, we believe that following new developments and improvements in OCT technology, such as OCT angiography (OCT-A) and adaptive optics OCT (AO-OCT), CRAO diagnosis and evaluation might shift from FA to predominantly OCT-based procedures.
For example, Chen et al. (2016) reported that the visual outcome following NA-CRAO highly correlated with biomarkers taken from OCT recordings. The optical intensity ratio of the inner retinal layers and photoreceptor/retinal pigment epithelium (PR/RPE) layers was utilized to suggest it to be used as a surrogate marker for retinal ischaemia with important implications for future reperfusion or retinoprotective therapies (Chen et al. 2016).
Previous studies, investigating retinal thickness in correlation with visual outcome in the acute phase of NA-CRAO, have reported seemingly mixed results. Four studies (Schmidt, Kube, & Feltgen 2006; Shinoda, Yamada, & Matsumoto 2008; Ikeda & Kishi 2010; S.-N. Chen, Hwang, & Chen 2011) were not able to demonstrate a significant correlation between those two parameters, whereas two other studies have found a significant correlation (Ahn et al. 2015; Chen et al. 2016). Importantly, these previous publications did not investigate the time between OCT imaging and NA-CRAO symptoms onset, possibly overlooking the time component of retinal thickness changes in this setting.
Therefore, we investigated the temporal dynamics of retinal thickness change in the porcine retina using OCT scans within an ischaemic time frame of up to 9 hr as a model of NA-CRAO. The oedema progression rates derived from these measurements were compared with retrospective clinical retinal thickness data from NA-CRAO patients with a known time of ischaemia onset.
Methods
Animal use
All pig eyes used in this study were kindly donated by the Institute for Experimental Surgery (University Hospital Tübingen, Tübingen, Germany).
Study design
Six porcine eyes German Landrace pigs (68.8–87.1 kg; age 2–4 months) were enucleated immediately after killing at the end of an unrelated general surgery, which did not have a measurable effect on the eye or ocular perfusion. Optical coherence tomography (OCT) measurements of whole eyes were performed within 1 hr after enucleation and repeatedly obtained at hourly intervals. Between the measurements, all eyes were stored at 37°C and 100% humidity to mimic retinal non-perfusion in vivo. Corneas were repeatedly treated with 2% hydroxypropyl methylcellulose eye drops (Methocel 2%, OmniVision GmbH, Germany) to maintain corneal transparency.
Optical coherence tomography measurement and evaluation
Optical coherence tomography (OCT) measurements of mounted whole pig eyes were performed using Spectralis HRA + OCT (Heidelberg Engineering, Germany). Measurements were repeated hourly as long as the transparency of the optical media allowed adequate scanning quality (typically for up to 9 hr after ischaemia onset). Total retinal thickness was measured in the cone rich retinal streak above the optic disc using the virtual ruler tool in the Heidelberg Eye Explorer Software (version 1.9.13.0, Heidelberg Engineering, Germany). The built-in follow-up function in Heidelberg Eye Explorer was used to relocate the exact position in subsequent acquisitions.
Retrospective patient selection
The study was conducted at the University Eye Hospital Tübingen, Germany. Retrospective data were collected from medical records of 12 patients (7 women, 5 men, age 61–85 years old) diagnosed with acute NA-CRAO between 2013 and 2016. The time between the onset of symptoms and OCT scan ranged from 1 to 9 hr. Standard OCT thickness measurements were performed using Spectralis HRA + OCT. Retinal thickness was measured on the horizontal scan through the fovea. The thickest retinal area between fovea and optic nerve head was measured and used for further evaluation, as previous studies suggest the highest overall thickness change in NA-CRAO from baseline occurs within the nasal perifoveal part of the retina (Ahn et al. 2015). Both the affected and non-affected eye of each patient were evaluated every hour. The maximal retinal thickness in the unaffected eye was used as baseline. Retinal thickness change in the affected eye was calculated as the difference from baseline. Patient-reported time of symptom onset was retrieved from the electronic medical records. All patients with previously known retinal diseases were excluded. Furthermore, only patients with NA-CRAO and complete occlusion of the retinal circulation (standing erythrocytes in the veins) and a visual acuity ≥ LogMAR 1.6 were included in this study.
Statistical analysis
Statistical analysis and graph plotting were performed in SPSS version 24 (IBM Corp., USA) and JMP 13.0.0 (SAS Institute Inc., Cary, NC, USA) statistical software.
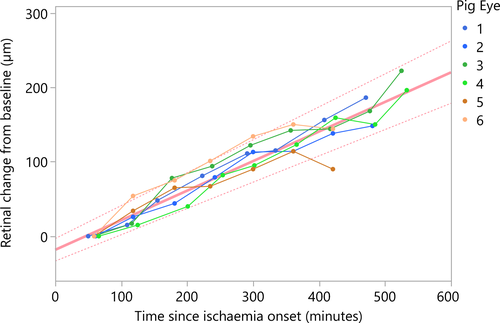
For the porcine eyes, the first thickness measurement (1 hr after ischaemia onset) was used as baseline and following values were calculated as the difference from baseline. In order to take account of possible correlations due to repeated measures, eye pairing and heterogeneous number of measure repeats (e.g. due to differences in onset of corneal oedema), a generalized linear mixed model (GzLMM) regression analysis was employed to estimate the rate of retinal thickness change in pig eyes. GzLMM was set-up with ‘eye id’ as the subject grouped by ‘pig id’. Fixed effect was set to ‘time since onset’ with intercept. Random effects included ‘eye id’ and the interaction between ‘eye id’ and ‘pig id’ with intercept. Both a log-linear and linear link functions were evaluated and empirically compared using ‘predicted by observed’ output graphs.
As patients' medical records included only a single measurement, regression analysis was performed using the linear regression function. For non-normally distributed retinal thickness data, Pearson's rho two-tailed correlation statistic was used to assess the strength of association between onset time and retinal thickness change.
Results
Porcine retinal oedema progression rate
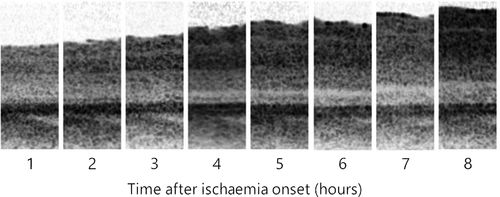
Retinal thickness change in six pig eyes was measured for 7–9 hr to obtain a total of 46 measurements. On average, the first OCT measurement was obtained 59 ± 5 min (average ± standard deviation) after onset of non-perfusion. The median retinal thickness in the first measurement was 313 ± 18 µm. Seven hours after ischaemia onset, the median retinal thickness was 444 ± 30 µm. A linear function was the most effective in describing the relationship between retinal thickness change and time from ischaemia onset within the measured time range (Fig. 1). Overall progression rate in terms of total retinal thickness change in ischaemic pig eyes was 25.32 µm/hr [24.24–26.40 µm/hr]. Due to decreasing clarity of the optical media and increasing optical intensity ratio of the inner and outer retinal layers, the signal intensity posterior to the ganglion cell layer was not sufficient for reliable differentiation of retinal sublayers.

Patient retinal oedema progression rate
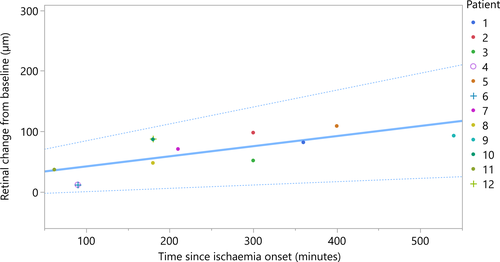
Optical coherence tomography (OCT) data from both eyes of 12 patients were obtained. The median patient-reported time since onset of ischaemia symptoms was 241 ± 143.2 min. The median retinal thickness of contralateral, unaffected eyes in OCT was 301.1 ± 11.9 µm. Affected eye median retinal thickness was 366.8 ± 35.6 µm. The correlation between retinal thickness change (healthy contralateral eye as baseline) and time from ischaemia onset was found to be strong, with a Spearman's rho correlation coefficient of 0.77 (p = 0.004). Linear regression analysis resulted in a retinal thickness change rate of 10.02 µm/hr [CI 95%: 3.30–16.74 µm/hr] (Fig. 2). The adjusted R2 value for the model is 0.477.

Discussion
Our results suggest that the duration of retinal ischaemia is highly correlated with an oedematous swelling of the retinal layers, as indicated by the linear retinal thickness increase in the controlled setting of the used porcine eye model. Similarly, the retinal thickness measurements from the clinical cases also revealed a clear retinal thickness increase in the affected compared with the contralateral unaffected eye. While such an intra-individual comparison builds on the assumption of symmetry prior to NA-CRAO, it sidesteps the problem of not having a baseline measurement before disease onset, as it would be the case in most NA-CRAO patients.
Both, the pig model and retrospective NA-CRAO patients' data show linear progression rates (Fig. 3), with NA-CRAO patients showing a lower rate of retinal oedema progression than pig eyes within the observed period of time. This could be explained by the fact that patients' retinas still have a potent choroidal circulation during NA-CRAO, which may partially mitigate the ischaemic effect (at least in the outer retina), whereas the perfusion of the enucleated pig eyes is completely disrupted. Moreover, enucleation not only causes complete retinal and choroidal ischaemia, it also includes complete axotomy of the optic nerve fibres, which interferes with axoplasmic flow and thus may contribute to retinal swelling. Additionally, inter-species differences could account for further discrepancies in the observed progression rates.

Retinal ischaemia results in swelling of the retina in the very acute phase of NA-CRAO, yet in some cases, the severity and duration of the occlusion can vary greatly. Thus, compared with the pig eye model, the wider confidence interval of oedema progression in NA-CRAO patients could be explained with possible partial occlusions or possible collateral circulation. All NA-CRAO patients showed a complete cessation of blood flow in fundoscopy at the time of OCT measurement with standing erythrocytes in the veins. On behalf of a rapid clinical management, no FA was performed in these retrospectively analysed cases. It should also be noted that our progression analysis on both, the porcine and the human retinas, was confined to a relatively narrow time frame in order to maintain the clinical relevance with respect to irreversible retinal damage (Hayreh et al. 2004). Although our progression analysis resulted in a linear function, we estimate that the progression curve beyond the measured time frame will eventually begin to flatten when the maximum of retinal oedema is reached before secondary atrophy results in retinal thinning. In our analysis of the first eight to 9 hr of total ischaemia, no signs suggesting a curve flattening were apparent.
The major limitation of our study is the relatively small sample size. However, it is an unfortunate fact that patients with acute NA-CRAO rarely present within the first hours after onset of symptoms because the awareness for the urgency of this condition remains low. This is also regrettable as acute retinal ischaemia is often accompanied by silent cerebral ischaemia, which may benefit from a comprehensive neurological workup (Golsari et al. 2017). Our recent study, so far the largest study specifically investigating intravenous thrombolysis within a 4.5 hr time frame, included 20 patients which were recruited within as much as 2.5 years (Schultheiss et al. 2018). Moreover, making recruiting more patients even more difficult is the fact that two thirds of these patients did not present within regular working hours, when OCT normally is not available (Schultheiss et al. 2018). Moreover, a weakness of this study is the fact that we could only include patients that are aware of the exact onset time of symptoms (vision loss was recognized with both eyes opened and not after covering one). Unfortunately, patient-reported symptom onset is a somewhat subjective parameter and, so far, is difficult to verify, by our very strict selection though the recorded time of symptom onset should be reliable. Many patients are not aware of the exact onset of symptoms which required the exclusion of these patients while at the same time this could have caused a potential selection bias (Rudkin et al. 2009). Consequently, this study only comprises a relatively low number of patients, though provides the first OCT study analysing patients with NA-CRAO within such a short period after ischaemia onset. Another limitation is the retrospective design of our study. To confirm our results, a larger patient cohort is needed, preferably in a prospective trial. Currently, we are in the midst of the arrangements of a large multicentric, double-blinded, randomized and placebo-controlled phase II proof-of-concept trial investigating intravenous thrombolysis within 4.5 hr, in which as well OCT is going to be used as a prognostic marker.
Correlation of OCT measurements and visual outcome
Overall, OCT studies dealing with retinal thickness and its correlation with visual outcome show inconsistent results – four studies do not see a correlation (Schmidt et al. 2006; Shinoda et al. 2008; Ikeda & Kishi 2010; Chen et al. 2011) but two do (Ahn et al. 2015; Chen et al. 2016). None of the studies included a temporal stratification to the NA-CRAO onset, meaning that the time-dependent dynamics in the acute phase progression of NA-CRAO could not be accounted for. Secondly, the changes in retinal thickness were not normalized to the unaffected eye although it has been shown that the retinal thickness in OCT differs by ±19.8% in healthy subjects (mean central retinal thickness: 237.9 ± 47 µm) (Howard et al. 2016).
Our results indicate time-dependent linear retinal thickness changes within the first 8–9 hr of NA-CRAO. Consequently, any OCT recordings in this very early phase would not show its maximum extent and therefore underestimate oedema formation. In turn, this may skew any visual outcome analysis based on sub-maximal retinal thickness measures. Therefore, the missing temporal stratification may be a reason for the inconsistency in so far published studies.
Interestingly Chen et al. (2016). could show that the optical intensity ratio of the inner retinal layers and the PR/RPE layers had a much stronger correlation with the final BCVA than retinal thickness. This study was performed within 7 days of decrease in visual acuity (Ahn et al. 2015; Chen et al. 2016). Unfortunately, also here, the OCT results are not related to NA-CRAO onset. We did not analyse the optical intensity ratio, because the retinal layers could not reliably be distinguished in the OCT images of the retrospective clinical analysis. We also decided to not perform such an analysis in the controlled pig model experiment, because the lack of choroidal circulation and the axotomy would have been a confounding factor of unknown proportion.
Clinical implications
Optical coherence tomography (OCT) has previously been shown to be very valuable in accurate documentation of the retinal ischaemic damage in NA-CRAO (Ahn et al. 2015). Our data suggest that measuring changes in the retinal oedema using OCT at the time of presentation may add a valuable hint leading to an approximate time of ischaemia onset, especially during the first few hours after symptoms appear. Therefore, misleading patient-based information claiming a very short period since symptom onset while presenting with massive retinal oedema resulting in a false fibrinolysis indication will be detected. Thus, the use of OCT in the acute phase of NA-CRAO would lead to critical re-evaluation. Knowledge of the exact time of onset may well prove critical for the immediate management including the assessment of the functional rescue potential of a reperfusion therapy.
In analogy to cerebral infarction with unknown time of onset, where MRI (mismatch between diffusion-weighted imaging and fluid-attenuated inversion recovery (DWI-FLAIR mismatch)) is used to predicate whether ischaemia onset was within 4.5 hr before preceding imaging, retinal thickening in OCT could gain a similar diagnostic value in NA-CRAO patients, especially when the onset of symptoms is unknown, that is during sleep (Thomalla et al. 2018).
Retinal thickness as well as optical intensity ratio of the inner retinal layers and the PR/RPE layers may be biomarkers for retinal ischaemia. In this study, for the first time, we showed the temporal dynamics of ischaemic retinal oedema formation in a porcine model. This observation is further supported by our retrospective analysis of acute NA-CRAO cases. A prospective trial is needed to confirm the utility of OCT-based biomarkers in the context of CRAO and potential shift of clinical management with reperfusion options.


