Angiographic biomarkers of filtering bleb function after XEN gel implantation for glaucoma: an optical coherence tomography-angiography study
RM and LB equally contributed to this work and share primary authorship.
Abstract
Purpose
To evaluate, using optical coherence tomography-angiography (OCT-A), the vascular features of good bleb function after XEN gel implantation (XGI) for uncontrolled glaucoma.
Methods
Forty-three patients (43 eyes), who underwent XGI, were enrolled. According to the intraocular pressure (IOP) reduction, patients were classified into Group 1 (21 eyes; success) and Group 2 (22 eyes; failure). Optical coherence tomography-angiography (OCT-A) was performed to image the vascularization of the conjunctival bleb-wall. The main outcomes were as follows: vessel displacement areas (VDAs), major vessel displacement area (MVDA; mm2), non-flow whole area (NFWA; mm2) and bleb-wall vessel density (BVD; %). Co-registered B-scans were also considered to evaluate the bleb-wall cyst-like structure density and area (BCSD, cysts/mm2; BCSA, mm2), and the bleb-wall thickness (BT, µm).
Results
Mean postoperative follow-up was 7.5 ± 0.14 months; Group 1 and 2 IOP were 14.0 ± 2.5 and 25.3 ± 2.1 mmHg, respectively (p < 0.001). Greater VDA (p < 0.001), MVDA (p = 0.046) and NFWA (p = 0.001) values, and lower BVD (p < 0.001) was found in Group 1 compared to Group 2. Group 1 showed higher BSCD, BSCA and BT values compared to Group 2 (p < 0.001). Postoperative IOP positively correlated with BVD (r = 0.567; p = 0.003), but negatively with VDAs, MVDA (r = −0.581, p = 0.002; r = −0.619, p = 0.001, respectively), BCSD, BCSA (r = −0.580; p = 0.002; r = −0.664; p < 0.001) and BT (r = −0.627, p = 0.001).
Conclusion
Successful filtration blebs after XGI present numerous and large areas of vessel displacement within the bleb-wall, along with a rarefied vascular network. These OCT-A features can be considered angiographic biomarkers of a good aqueous humour percolation through the bleb-wall layers.
Introduction
In the last years, several new surgical approaches for lowering intraocular pressure (IOP) have been proposed for patients with medical uncontrolled glaucoma, with the aim to improve the predictability and the safety profile of surgery (Lavia et al. 2017). To date, the scientific community is still debating whether or not to group these procedures under the name of minimally invasive glaucoma surgery (MIGS), and whether or not the term is appropriate.
Among all MIGS currently available, the XEN gel stent implantation represents the only approach that creates an ab interno communication between the anterior chamber (AC) and the sub-conjunctival space to drain the aqueous humour (AH) (Green et al. 2018). Because of this, to date, the XEN gel implantation (XGI) represents the only minimally invasive procedure that lowers the IOP in the same way of trabeculectomy, that is by creating a filtration bleb. Given the limited tissue manipulation during surgery, one of the main advantages of this approach is the conjunctival sparing, which is crucial to improve the long-term success of filtration surgery (Schlenker et al. 2017; Marcos Parra et al. 2019).
In fact, the most important risk factor for surgical failure is represented by the conjunctival bleb fibrosis (Yu et al. 2009). Therefore, an accurate analysis of the filtration bleb during follow-up is one of the most essential steps in the postoperative patient evaluation.
The clinical assessment of blebs is generally conducted according to classification systems such as the Indiana Bleb Appearance Grading Scale (IBAGS) and Moorfields Bleb Grading Scale (MBGS), which offer important information on the bleb status (Picht & Grehn 1998; Wells et al. 2006). Nevertheless, clinical assessment misses some information, since does not allow studying the bleb-wall layers, bleb cavity and the sclera underlying bleb, which are key sites for the early identification of failure (Wells et al. 2007).
During the last decades, imaging techniques such as the anterior-segment optical coherence tomography (AS-OCT) and the in vivo confocal microscopy (IVCM) have been used to improve the filtering bleb assessment after trabeculectomy, providing structural biomarkers useful to early recognize bleb dysfunction (Labbé et al., 2005; Messmer et al. 2006; Carpineto et al. 2011; Mastropasqua et al. 2014a; Mastropasqua et al. 2014b; Agnifili et al. 2016; Mastropasqua et al. 2017). In the last years, the advent of the OCT-angiography (OCT-A) further improved the ocular tissues analysis, providing angiographic information of the posterior and anterior segment of the eye (Lee et al. 2019). Recent studies investigated the role of OCT-A in the bleb assessment after trabeculectomy, showing that a poor bleb vascularization is associated with lower IOP values, and that OCT-A parameters can be used to define the bleb filtration ability (Hayek et al. 2019; Seo et al. 2019a, 2019b). However, to date, no previous studies have analysed the filtration bleb features after XGI using OCT-A. The purposes of the present study were to describe the vascular features in functioning and failed filtration blebs after XEN gel stent implantation and to investigate whether OCT-A biomarkers that distinguish functioning from non-functioning filtration blebs exist. The correlations between vascular and bleb-wall OCT structural parameters were also investigated.
Materials and Methods
Patient enrolment
This was an observational, single centre and cross-sectional study. The study was carried out at the Ophthalmic Clinic, University G. d'Annunzio of Chieti–Pescara, Italy. Forty-three consecutive patients (43 eyes) who underwent Mitomycin C (MMC) augmented XGI were enrolled. Surgery was considered successful when a third reduction of baseline IOP was achieved at least 6 months after surgery; according to this criterion, a success group (Group 1) and a failure group (Group 2) were defined.
All patients provided written informed consent prior to enrolment, after explanation of the purpose, nature and possible consequences of the study. The study protocol was approved by our institutional review board (Department of Medicine and Ageing Science of the University ‘G. d'Annunzio' of Chieti–Pescara, Chieti, Italy) and adhered to the tenets of the Declaration of Helsinki.
Inclusion criteria were as follows: primary open angle, pseudo-exfoliative or pigmentary glaucoma, uncontrolled IOP (>21 mmHg, mean of three measurements acquired during a diurnal tonometric curve) under maximal tolerated medical therapy (including oral acetazolamide), or progression of the visual field (VF) damage confirmed on three consecutive examinations [Humphrey field analyser (HFA) II 750; Carl Zeiss Meditec Inc., Dublin, CA, USA (30-2 test, full-threshold)]. Only reliable tests (<33% fixation losses and false-negative errors and <10% false-positive errors) and without artefacts or evidence of abnormal results caused by a disease other than glaucoma were included. In the case both eyes were eligible, the eye with the higher IOP or the more advanced perimetric damage [Glaucoma Staging System 2 (GSS2)] (Brusini & Filacorda 2006) was included in the study. Eyes scheduled to combined cataract and glaucoma surgery were also considered eligible. Only patients with a completely successful surgery 6 months after the XGI were enrolled in the study.
Exclusion criteria were the followings: diagnosis of angle closure or secondary glaucoma, microphthalmus, previous filtration surgery for glaucoma or other ocular surgeries, history of ocular diseases other than glaucoma, pregnancy and the need for IOP lowering medications after surgery. In order to avoid potential biases on the bleb-wall features, postoperative filtration bleb needling and administration of anti-fibrotic agents were considered exclusion criteria.
XEN gel implant procedure
The XEN gel implant is a hydrophilic tube composed of porcine gelatin crosslinked with glutaraldehyde. Briefly, after topical anaesthesia with oxybuprocaine, 0.1 ml MMC (0.2 mg/ml) is injected under the conjunctiva at 12 o'clock, approximately 8 mm apart from the limbus and then spread towards the superior nasal quadrant. After viscoelastic (Healon GV; Abbott Medical Optics Inc., Santa Ana, CA, USA) filling of the AC, the injector is directed through the main corneal incision (inferior temporal) towards the superior nasal quadrant. Before injecting the device, a gonioscopic lens is used to confirm the correct placement of the needle against the trabecular meshwork. At the end of the injection and the viscoelastic removal, the surgeon verifies the correct position of the device (‘3:2:1 rule': 3 mm under the conjunctiva, 2 mm intra-sclerally, and 1 mm left in the AC) and the presence of the filtration bleb, by injecting balanced salt solution into the AC.
Six months after surgery, all enrolled patients underwent a careful slit-lamp examination of the anterior and posterior segment of the eye, with particular attention to the conjunctival filtration bleb and the device positioning in the AC. Immediately after the clinical examination, patients underwent OCT-A of the bleb-wall to evaluate the vascular features; at the same time, the structural B-scans were also considered to investigate the bleb-wall morphology.
Optical coherence tomography-angiography of the filtration blebs
The AngioVue OCT-A system (Optovue Inc., Fremont, CA, USA) was used to image the vascularization of the conjunctival bleb-wall. The device uses a scan speed of 70 000 A-scans per second and a light source centred on 840 nm, with a bandwidth of 45 nm. The OCT-A images are processed using a split-spectrum amplitude-decorrelation angiography (SSADA) algorithm (version 2018.1.0.24), providing axial and transverse resolutions of 15 µm in tissue for OCT-A images.
In this study, the 3 × 3 mm AngioRetina scan was used to image the vascularization of the bleb-wall following the XGI. The patient was asked to look at an external fixation target in order to send the OCT beam perpendicular to the filtering bleb location, and focal lengths were then manually specified by adjusting the manual F and Z settings (with the F and Z motors usually set close to maximal values, i.e. 14 and 14D, respectively) until the vessels in the scanning window were clearly in focus. Patients were instructed to fixate the target during the image acquisition and avoid blinking or eye movements during the scanning process.
After completion of the volumetric OCT dataset, the software applied motion control technology to remove saccades and minor loss of fixation. Low-quality scans (i.e. if the subject blinked or the scan had significant motion artefacts) were excluded and repeated until good-quality scans were achieved; a signal strength index >60 was considered for the analysis. For the segmentation of the filtration bleb OCT-A image, we considered a ‘bleb-slab' from the outer to the inner border of the bleb-wall conjunctiva. In order to obtain a better and appropriate definition of en face slab for the qualitative and quantitative analysis, we used the ‘segmentation editing and automatic propagation tool'. Briefly, users can manually correct one or a few affected B-scans and propagate the correction throughout the entire scan volume or through a user-selected region in few seconds. For the qualitative and quantitative analysis, we used the 3 × 3 mm en face angiogram, divided into 1 × 1 mm nine quadrants.
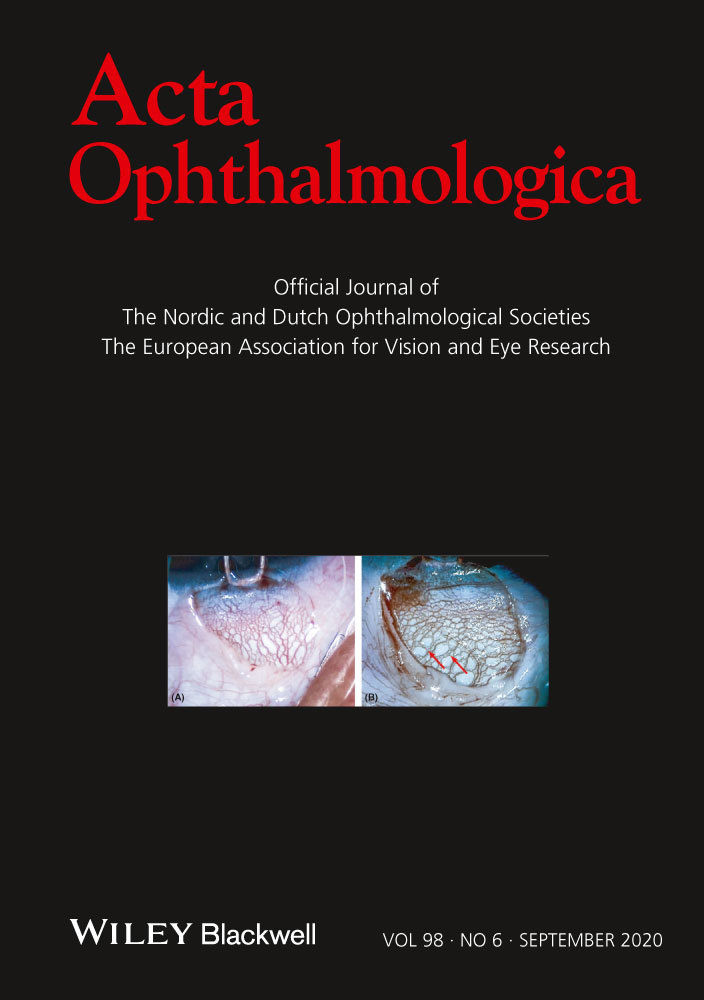
The main bleb-wall angiographic parameters were as follows: (i) presence (yes (1) or not (0) and numbers of the vessel displacement areas (VDAs), defined as flow-void areas in the whole OCT-A image, manually selected and calculated by imagej software (https://imagej.nih.gov/ij/). A VDA was defined as a flow-void area, delimited by flow vessel signals, whose size had to be at least one-third of a single quadrant of the colour coded angiographic map. VDAs were considered present even just one flow-void area was recognizable; (ii) major vessel displacement area (MVDA; mm2) defined as the largest flow-void area (flow-void area greater than a quadrant of coded colour angiographic square-grid map) in the whole OCT-A image, manually outlined and calculated using the imagej software (Fig. 1A); (iii) non-flow whole area (NFWA; mm2) defined as the sum of each VDA, including the MDVA (Fig. 1B) and calculated using the imagej software; (iv) bleb-wall vessel density (BVD; %) defined as the percentage area occupied by vessels in the whole 3 × 3 mm OCT-A image. The AngioVue software automatically outputs the vessel density value in percentage of the whole OCT-A image. The quantitative analysis of VDA, MVDA, NFWA and BVD was performed by two expert ophthalmologists (LA and LDA). Intraclass correlations between the two readers were 0.99 (95% CI: 0.98–0.99) for all parameters.

Structural optical coherence tomography of filtration blebs
To evaluate the structural parameters of the bleb-wall, the co-registered B-scan of the 3 × 3 mm en face image (3 × 3 mm AngioRetina scan) was used. Images were analysed by a second qualified operator, which was masked for the grouping and patient surgical history (EZ). The following OCT parameters were analysed, using the imagej software: (i) bleb-wall cyst-like structures density and area (BCSD, cysts/mm2; BSCA, mm2): hypo-reflective cyst-like structures recognized between the outer and inner surface of the bleb-wall; (ii) bleb-wall thickness (BT, µm), calculated at the maximum elevation point of the bleb.
Statistical analysis
The analysis was performed using spss V.20.0 Software (2011; SPSS Inc.; Chicago, IL, USA). The sample size was calculated considering difference between groups of almost 10%, a power of 80% and type I error rate (α) of 5%. To detect data distribution from normality, a Shapiro–Wilk's test was performed for all variables. Data were reported as the mean value ± standard deviation (SD), and percentage, as appropriate. Student t test and chi-square test were used to evaluate age, IOP, and gender differences between groups. Mann–Whitney U test was used to evaluate the differences in angiographic and B-scan parameters between groups, and Spearman's correlation analysis was used to investigate correlations between OCT-A and B-scan parameters, and IOP. A p < 0.05 was considered statistically significant.
Results
Demographic and clinical data
According to the success criterion, 21 patients (21 eyes) were in the success group (Group 1) and 22 (22 eyes) in the failure group (Group 2). All patients belonging to Group 1 were on complete success. Mean postoperative follow-up was 7.5 ± 0.14 months.
No significant differences were found for baseline demographic and clinical parameters between groups, except for postoperative IOP that was significantly lower in Group 1 compared to Group 2 (p < 0.001); the mean postsurgical follow-up was similar between Groups (Table 1). None of the patients experienced serious intra- or postoperative complications and the XEN gel implant was correctly positioned, respecting the 3-2-1 rule; three patients per Group underwent combined phacoemulsification and XGI.
| Age (y) | M/F | Pre-op IOP | Pre-op drugs (n ± SD) | MD | Post-op IOP | Post-op drugs (n ± SD) | Duration of the disease (mo) | Mean follow-up (mo) | |
|---|---|---|---|---|---|---|---|---|---|
| Success (Group 1) | 69.3 ± 13.4 | 10/12 | 28.2 ± 3.6 | 2.9 ± 0.5 | −7.81 ± 3.21 | 14.0 ± 2.5* | 0.0 ± 0.0† | 73.2 ± 3.9 | 7.6 ± 1.2 |
| Failure (Group 2) | 67.54 ± 14.1 | 11/10 | 27.9 ± 3.1 | 3.1 ± 0.8 | −6.72 ± 2.66 | 25.3 ± 2.1 | 2.6 ± 1.2 | 68.5 ± 4.1 | 7.4 ± 0.8 |
- F = female; IOP = intraocular pressure (mmHg; mean ± SD), M = male, Mo = months (mean ± SD), MD = mean defect (dB; mean ± SD), Y = years (mean ± SD).
- * p < 0.05 versus postoperative IOP in Group 2 and versus preoperative IOP in Group 1.
- † p < 0.001 versus postoperative drugs in Group 2 and versus preoperative IOP in Group 1.
Optical coherence tomography-angiography of the filtration blebs
For all parameters examined, there were significant differences between groups. Lower BVD (p < 0.001), higher NFWA (p = 0.001), VDAs number (p < 0.001) and MVDA (p = 0.046) were found in Group 1 compared to Group 2.
In more detail, MVDA and NFWA values were twice in successful XGI than in failed surgery. VDAs were found in all successful blebs but only in the 28.4% of failed blebs, with the number of VDAs four times higher in functional compared to failed blebs (Table 2; Figs 2 and 3); MVDA was found in the 76.2% of successful cases and in 9.1% of the failed cases.
| VDAs (n°) | MVDA (mm2) | NFWA (mm2) | BVD (%) | |
|---|---|---|---|---|
| Success (Group 1) | 3.8 ± 1.3* | 0.32 ± 0.03‡ | 1.65 ± 0.61† | 46.19 ± 3.82* |
| Failure (Group 2) | 1.0 ± 1.4 | 0.15 ± 0.07 | 0.79 ± 0.45 | 54.15 ± 4.40 |
- BVD = bleb-wall vessel density, MVDA = Major vessel displacement area, NFWA = Non-flow whole area, VDA = vessel displacement areas.
- * p < 0.001 versus Group 2.
- † p = 0.001 versus Group 2.
- ‡ p = 0.046 versus Group 2.


Structural optical coherence tomography of the filtration blebs
Significant differences were found between groups for all structural B-scan OCT parameters (p < 0.001; Table 3). In detail, BCSD and BT values were twice in Group 1 compared to Group 2, whereas BCSA was three times higher in the success Group.
| BCSD (cysts/mm2 ± SD) | BCSA (mm2 ± SD) | BT (µm ± SD) | |
|---|---|---|---|
| Success (Group 1) | 3.73 ± 1.28* | 0.115 ± 0.046* | 702.80 ± 257.14* |
| Failure (Group 2) | 1.81 ± 0.75 | 0.041 ± 0.038 | 354.45 ± 153.51 |
- BCSA = Bleb-wall cyst-like structure area, BCSD = Bleb-wall cyst-like structure density, BT = bleb-wall thickness, OCT = optical coherence tomography.
- * p < 0.001 versus Group 2.
Correlations
In both groups, VDA and MVDA negatively correlated with BVD (r = −0.437, p = 0.026; r = −0.577; p = 0.031) and positively with NFWA (r = 0.699, p < 0.001; r = 0.712; p < 0.001); conversely, BVD negatively correlated with NFWA (r = −0.617; p = 0.001). Postoperative IOP positively correlated with BVD (r = 0.567; p = 0.003), but negatively with VDAs, MVDA (r = −0.581, p = 0.002; r = −0.619, p = 0.001, respectively). BCSA and BT positively correlated with VDA (r = 0.590; p = 0.002; r = 0.618; p = 0.001). BT, BCSD and BCSA negatively correlated with postoperative IOP (r = −0.627, p = 0.001; r = −0.580; p = 0.002; r = −0.664; p < 0.001).
Discussion
A careful assessment of the filtration bleb after glaucoma surgery is crucial for identifying early signs of failure. Along with the bleb height, extent and leakage, the bleb-wall vascularization provides key information on the bleb status and its filtration ability (Wells et al. 2006). In fact, an increased conjunctival vascularization correlated with higher levels of inflammation and collagen deposition within the bleb-wall layers and, therefore, to an increased risk of filtration failure (Picht & Grehn 1998; Sacu et al. 2003; Messmer et al. 2006; Wells et al. 2006; Yu et al. 2009; Yin et al. 2018). Nevertheless, clinical assessment may fail to identify the signs of bleb dysfunction at the very early stages, when changes are developing at the cellular level, but are still clinically undetectable (Wells et al. 2007; Ciancaglini et al. 2008). In addition, clinical methods are subjective, qualitative and poorly reproducible. These concepts indicate the needs to use diagnostic tools, such as IVCM, AS-OCT or OCT-A the better characterize the bleb features.
In the present study, we investigated for the first time the bleb-wall vascularity after XGI using OCT-A. Overall, we found that successful cases presented lower vascularization of the bleb-wall compared to failed cases and showed specific differential vascular patterns. Specifically, a lower BVD and a greater NFWA were the main OCT-A features of functioning blebs. These results are in line with previous histological studies, which found that less vascularized blebs were generally less inflamed, less prone to develop fibrosis, because of the reduced supply of fibroblast stimulating cytokines, and with a greater filtration ability (Picht & Grehn 1998; Sacu et al. 2003; Messmer et al. 2006). As additional peculiar aspects, functioning XEN gel blebs presented several areas of vessel displacement (VDAs), frequently coupled with a greater area of vessel displacement (MVDA) (Fig. 2C).
The use of OCT-A for the filtration bleb analysis represents a very recent field of interest. Seo et al. (2019a) reported a good correlation between the OCT-A colour and brightness densities of the bleb-wall and the IBAGS and MBGS vascularity grading, proposing the OCT-A parameters as biomarkers of the bleb vascularity after trabeculectomy. These initial results are pivotal since they suggest that information provided by OCT-A are in line with those obtained during the clinical examination. Even though we used different parameters to determine the bleb-wall vasculature, and our study was dedicated to a different filtration surgery, our results are line with the conclusions of Seo et al. (2019a), since our angiographic parameters are also clear indicators of the bleb-wall vascularity. Differently from these authors our angiographic parameters significantly correlated with the IOP. This could be due to the fact that BVD and NFWA can be considered as direct indicators of the bleb-wall vascularization, whereas the colour and brightness density could be indirect indicators.
In others OCT-A studies, the authors mainly focused on the evaluation of the bleb-wall vascular aspects as predictors of the IOP control (Yin et al. 2018; Hayek et al., 2019; Seo et al. 2019a). Hayek et al. (2019), who studied the conjunctiva before and after trabeculectomy, observed that the preoperative vessel density is a good indicator of further surgical success and that the bleb-wall vascular density at months one and six, significantly correlated with the IOP at the same follow-ups. Similar results were reported by Yin et al. (2018) who found that the 1-month vessel area modification was positively correlated with the 6-month IOP after trabeculectomy, and Seo et al. (2019a) who found that 1-week brightness density was a good predictor of the trabeculectomy outcome. Our results agree with these findings since the last follow-up (7 months) BVD and IOP showed a significant correlation between them.
Notably, we added new parameters compared to all previous studies, that were the VDAs and MVDA. Generally, the higher the density and size of VDAs, the lower the vasculature of the bleb-wall, and the better the IOP control. Since VDAs and MVDA were inversely related to the BWD, the presence of vessel displacement areas could be an indirect sign of a less vascularized (and fibrotic) conjunctiva, with wider areas of loosely arranged tissue available for the AH resorption.
When trying to explain the origin of these displacement areas, one may suppose that in presence of a greater AH outflow through the bleb-wall layers, vessels are mechanically dislocated by the fluid flow. This supposition is in line with known evidences demonstrating that the fluid pressure significantly affects the remodelling processes and the vascularity of soft tissues (Mellander & Albert 1994; Swartz & Fleury 2007). In fact, the exerted mechanical pressure may lead to the collapsing of blood vessels with rarefaction of the vascular network and modifications of the extracellular matrix (Mellander & Albert 1994).
The co-registered B-scan images seem to confirm this hypothesis since less vascularized blebs showed several cystic structures within the bleb-wall, with high BCSD and BCSA values. Moreover, we frequently observed a topographic correspondence between the bleb-wall cyst-like structures and the areas of vessel displacement. This was even more evident when looking at the MVDA, which evidently corresponded to the wider bleb-wall cyst (macrocyst) found in the B-scan analysis (Fig. 2C,D). Given that macrocysts frequently presented inside the hyper-reflective signal corresponding to the XEN gel stent (Figs 2 and 3F), we suggest that the MVDA is generated by the AH flow at the point of discharge from the device, where the fluid flow into the sub-conjunctiva is probably greater and more turbulent.
The presence of micro- and macrocysts within the bleb-wall layers has been widely associated to a good bleb filtration ability after trabeculectomy, either with AS-OCT or IVCM, because these structures were interpreted as drops of AH within the bleb-wall (Labbé et al., 2005; Messmer et al. 2006; Ciancaglini et al. 2008; Carpineto et al. 2011; Mastropasqua et al. 2014a; Mastropasqua et al. 2014b; Agnifili et al. 2016; Mastropasqua et al., 2017). Recent AS-OCT studies confirmed these findings also after XGI, reporting that functioning blebs showed multiple optically clear small spaces in the more superficial layers of the bleb-wall (Teus et al. 2019; Lenzhofer et al. 2019a). In further support of these suppositions, we found that MVDA significantly correlated with the postoperative IOP, this indicating that when AH percolates outwards, the bleb-wall vasculature is reduced and rarefied.
Based on all these findings, we hypothesize that the active AH flow through the bleb-wall could be one of the main determinants leading to the formation of the vessel displacement areas, even though we cannot exclude that VDAs and MVDA primitively characterize a less fibrotic conjunctiva. Given that VDAs were found in all successful cases and MVDA in two-third of cases, these parameters may be considered as specific angiographic biomarkers of a good filtration ability after XGI. The availability of non-invasive imaging biomarkers of failure is highly important in a surgical procedure such as that of the XGI, that often require a particularly vigilant follow-up, and in which the rate of needling procedures can be high (Schlenker et al. 2017; Widder et al. 2018; Lenzhofer et al. 2019b; Reitsamer et al. 2019).
Some limitations of the study must be pointed out. First, this is a mid-term observational follow-up study, and the present results should be confirmed in long-term prospective works. Prospective studies will also clarify the over-time changes of these angiographic parameters during bleb remodelling. Second, we do not know whether our findings are also valid for other filtration surgeries. This is, at least in part, hypothesizable since the presence of a device under the conjunctiva may affect the bleb features; moreover, Seo et al. (2019b) reported different OCT-A bleb-wall vascular features between trabeculectomy and phaco-trabeculectomy. Third, the inclusion of patients in qualified success or who underwent bleb needling will allow the evaluation of the impact of postsurgical IOP lowering medications and the effects of bleb manipulation procedures and anti-fibrotic agents on the angiographic features.
In conclusion, OCT-A is progressively gaining a role in the postoperative filtration bleb assessment. This depends on the opportunity given by this tool for evaluating the bleb-wall vasculature, which significantly affects the bleb functionality, but has not been adequately explored with the available diagnostic platforms. Whether or not the OCT-A features described in our study are confirmed in subsequent studies, they could help clinicians in the postoperative management of patients, by providing information about the timing of bleb management after XGI, especially considering the significant rate of needling after this surgery.