The positive effects of taurine on growth performance, immunohaematological parameters and stress response of farmed beluga (Huso huso) in both fresh water and brackish water
Abstract
Taurine is one of the most studied amino acids in aquaculture over the last decade. This study was conducted to investigate the taurine requirements in terms of growth, immune system, antioxidant enzyme activities and stress response of beluga (Huso huso) (209.1 ± 23 g) in both fresh water (FW) and brackish water (BW: 15 ppt). Twelve experimental tanks with six taurine levels (2.1 g/kg_21.8 g/kg), for FW (Tau2.1, Tau4.3, Tau7.1, Tau12.3, Tau16.7 and Tau21.8) and BW (BwTau2.1, BwTau4.3, BwTau7.1, BwTau12.3, BwTau16.7, and BwTau21.8), were designed to feed and farm fish for eight weeks. Generally, fish farmed in BW had better growth and immune response performance compared with FW. The quadratic relations for pooled data determined taurine requirements in terms of weight gain (12.1 g/kg), lysozyme (13.5 g/kg), IgM (12.7 g/kg) and osmolality (15.1 g/kg) (p<0.05). Furthermore, taurine requirements to obtain the minimum cortisol before and after stress were 10.4 g/kg and 14.3 g/kg, respectively. When we exposed fish to high stock density stress (12 kg/m3 for 4 hours), those fed dietary 16.7 and 21.8 g/kg had more stable glucose, cortisol and lactate before and after stress in both FW and BW. In conclusion, beluga fed diets with 12.3 g/kg and 16.7 g/kg taurine in both FW and BW groups had the best performance regarding growth and health status, respectively.
1 INTRODUCTION
Aquaculture has a high potential to provide food for humans in the next decades (Zaretabar et al., 2021). As the profitability of fish farming depends on growth performance and feed efficiency, any attitude towards improving these parameters can help increase sustainability (Asgari et al., 2020; Ghosi Mobaraki et al., 2020). An ideal diet for omnivorous fish species such as beluga (Huso huso) usually has 30%-40% fish meal and fish oil. However, providing fish meal is becoming a major challenge. Finding alternative protein sources such as plant proteins in aquafeeds can be a sustainable option (Daniel, 2018; Matani Bour et al., 2018). However, an imbalanced amino acids profile is a challenge when fish meal is replaced by the plant protein sources in fish diets (Napier et al., 2020). The negative effects of fishmeal replacement on antioxidant activities, immunohaematology, stress response and fish health were broadly investigated (Esmaeili et al., 2017a, 2017b; Matani Bour et al., 2018).
Taurine is abundant in marine-based ingredients such as fish meal, but it is close to absent in plant protein sources (Sampath et al., 2020). Taurine has shown a wide range of positive effects on the immune system (Adeshina & Abdel-Tawwab, 2020; Zhang et al., 2018), haematology, blood biochemistry (Li et al., 2016; López et al., 2015), the antioxidant system (Adeshina & Abdel-Tawwab, 2020; Bañuelos-Vargas et al., 2014; Dehghani et al., 2020) and protective effects against stress (Shi et al., 2020; Zhang et al., 2018). Although some studies have been done in fish, no study is available on the effect of taurine on the health and immunity of sturgeons held at different salinities.
Increasing density to enhance productivity and profitability is a common action in fish farming. However, high stocking density (HSdensity) is stressful for fish. Stress physiology, markers of HSdensity stress and the effects of water quality, feed and water additive to reduce stress were reviewed by Baldwin (2011). Positive effects of feeding fish with some additives such as vitamins (Bacchetta et al., 2020; Naderi et al., 2017), fatty acids (Bahurmiz & Ng, 2007), amino acids such as arginine (Hoseini et al., 2019), tryptophan (Hoseini et al., 2020) and minerals (Adineh et al., 2020; Naderi et al., 2017) to reduce HSdensity stress have been found.
Many countries such as Iran have massive brackish water resources that cannot be used for agriculture purposes. Developing brackish water aquaculture can be a sustainable option for producing food from these areas (Ghoshal et al., 2019; Hadipour et al., 2015). Numerous important aquatic species (more than 40 species) can grow well in both fresh water (FW) and brackish water (BW) when they are juvenile such as catfishes, goldfish (Carassius auratus), salmonids and sturgeons (Nadarajah & Eide, 2020). The long-term impact of high salinity on the immune system, fish health, oxidative stress and haematology of pipefish (Syngnathus typhle) (Birrer et al., 2012), Coho salmon (Oncorhynchus kisutch) (Maryoung et al., 2015), striped catfish (Plotosus lineatus) (Schmitz et al., 2017) and Japanese eels (Anguilla japonica) (Gu et al., 2018) were reported. However, none of them has reported the optimum amino acid requirements under the same experimental design with the same temperature, fish size, feed, etc., in both FW and BW.
Sturgeons are euryhaline fish species that have developed specific mechanisms of osmotic and ion regulation to adapt to varying salinity. Among sturgeon species, beluga has the best meat quality, is the most expensive species and is one of the fastest-growing sturgeons (Montazeri Parchikolaei et al., 2021). Although this fish species can be farmed both in BW and FW, most farms are based on FW. Salinity can alter fish growth and health, and there is a large gap in our knowledge about the beluga health and stress response under both FW and BW under the same farming conditions. Farming beluga and other sturgeons in BW can be an important step towards aquaculture sustainability in rural areas with vast BW resources. The present study was conducted to investigate the growth performance, immune response, haematology, antioxidant system and stress response of beluga fed various dietary taurine levels and farmed in either FW or BW.
2 MATERIALS AND METHODS
2.1 Ethics statement
All procedures involving animals were conducted according to the Tarbiat Modares University protocols, which seek to optimize handling and minimize animal stress (Asadi et al., 2020; Roohani et al., 2019; Safavi et al., 2019; Tazikeh et al., 2020).
2.2 Diet preparation
Six isonitrogenous (400 g crude protein/kg feed) and isoenergetic (20 kJ/g) diets were formulated by Lindo software. The diet components were purchased from the Mazandaran Animal & Aquatic Feed (Sari, Mazandaran, Iran). The six levels of taurine (0, 2, 5, 10, 15 and 20 g/kg) were added to make six diets including Tau2.1 (2.1 g/kg), Tau4.3 (4.3 g/kg), Tau7.1 (7.1 g/kg), Tau12.3 (12.3 g/kg), Tau16.7 (g/kg) and Tau21.8 (21.8 g/kg)). These six treatments were fed in FW and BW (12.0±1.2) to conduct each treatment in triplicate. We added these levels of taurine according to previous works (Hoseini et al., 2017; Sampath et al., 2020). The dietary ingredients were first dried and mixed carefully and became homogeneous. After complete mixing, liquid ingredients such as Kilka fish oil and soybean oil were weighed carefully and added gradually to the mixture. The resulting mixture was ground by a meat grinder (Electrokar EC-1, Tehran, Iran) to form pellets with 3 mm diameter. Then, pelleted granules were spread out on a tray and dried in an oven to ≥90% dry matter at 60°C for 24–48 hr. After drying the pellets, they were packed in suitable packages and kept at 4°C. The chemical compositions of experimental diets are presented in Table 1.
| Tau2.1 | Tau4.3 | Tau7.1 | Tau12.3 | Tau16.7 | Tau21.8 | |
|---|---|---|---|---|---|---|
| Ingredient | g/kg, as-fed basis | |||||
| Fish meal | 250 | 250 | 250 | 250 | 250 | 250 |
| Soybean meal | 300 | 300 | 300 | 300 | 300 | 300 |
| Corn meal | 156.8 | 156.8 | 156.8 | 156.8 | 156.8 | 156.8 |
| Wheat gluten | 120 | 120 | 120 | 120 | 120 | 120 |
| Fish oil | 80 | 80 | 80 | 80 | 80 | 80 |
| Soybean oil | 34.8 | 34.8 | 34.8 | 34.8 | 34.8 | 34.8 |
| Other ingredientsa | 38.4 | 38.4 | 38.4 | 38.4 | 38.4 | 38.4 |
| Taurine | 0 | 2 | 5 | 10 | 15 | 20 |
| Filler (Cellulose) | 20 | 18 | 15 | 10 | 5 | 0 |
| Proximate composition (g/kg dry matter)b | ||||||
| Taurine contents | 2.1 | 4.3 | 7.1 | 12.3 | 16.7 | 21.8 |
| Crude protein | 403.3 | 399.4 | 406.1 | 409.5 | 411.2 | 416.8 |
| Crude lipid | 148.4 | 151.0 | 150.2 | 152.5 | 149.6 | 145.3 |
| Ash | 71.2 | 80.5 | 77.6 | 73.5 | 79.7 | 74.4 |
| Carbohydratec | 376.8 | 369.1 | 366.1 | 364.5 | 359.2 | 363.5 |
| Moisture | 108.1 | 105.4 | 113.0 | 107.2 | 110.8 | 106.0 |
| Gross energy (kJ/g)d | 20.00 | 19.92 | 19.87 | 20.11 | 19.89 | 20.01 |
Note
- Diet components were purchased from the Mazandaran Animal & Aquatic Feed (Sari, Mazandaran, Iran).
- a Other ingredients: dicalcium phosphate 3 g/kg; mineral premix† 10 g/kg; vitamin premix § 10 g/kg; antifungus Toxiban premix 10 g/kg; antioxidant, butylated hydroxytoluene (BHT) 0.2 g/kg; phytase 0.2 g/kg; lysine 4 g/kg; methionine 1 g/kg.
- b Protein, lipid, ash, and moisture were analysed using AOAC methods (AOAC, 2000). For the detection of taurine in diets, the method of o-phthaldialdehyde (OPA) was used (Lindroth & Mopper, 1979).
- c Carbohydrate=100 - (crude protein +crude lipid +ash).
- d Estimated gross energy was calculated based on 1 g crude protein being 23.6 kJ, 1 g crude fat being 39.5 kJ, and 1 g carbohydrate being 17.2 kJ. NRC (2011).
- † Each kg of the minerals mixture supplied cobalt, 100 mg; iodine, 400 mg; selenium, 20 mg; zinc, 10,000 mg; ferrous, 6,000 mg; copper, 600 mg; magnesium, 50,000 mg
- § Each kg of the vitamins mixture supplied vitamin A, 1,200,000 IU; vitamin D3, 250,000 IU; vitamin E, 4000 mg; vitamin k3, 1200 mg; thiamin, 3000 mg; riboflavin, 4000 mg; pyridoxine, 3500 mg; pantothenic acid, 1500 mg; niacin, 20,000 mg; biotin, 200 mg; folic acid, 2000 mg; vitamin B12, 100 mg; inositol, 50,000 mg; ascorbic acid, 6000 mg; choline chloride 3000 mg.
2.3 Fish and experimental conditions
For this experiment, a total of 612 juvenile belugas (initial weight: 209.1 ± 23) were obtained from the Ghareboron Farm Centre (Chickrood, Mazandaran, Iran). Fish used for BW treatments (natural brackish water) were moved from FW to BW gradually in one week and then adapted for two weeks to the experimental condition in this centre. The FW treatments were adapted three weeks to the experimental condition. Thirty-six 2000-L fibreglass tanks within a semi-recirculating system were adjusted for this experiment for twelve treatments in triplicate (17 fish per tank). Throughout the trial, tank water was siphoned off daily 20–30% of water to remove faeces and debris. Water quality parameters were regularly checked and kept at the standard levels for the culture of beluga throughout the 8-week experiment. Photoperiod was maintained at 12D:12L, and the fish were hand-fed twice daily to apparent satiation. The temperature (21.5 ± 1.0) was measured by mercury thermometer (Zomorodazma Company, Iran), dissolved oxygen (6.7 ± 0.8) by Cyberscan Eutech instruments (DO 110, Singapore) and pH (7.6± 0.6) by Hanna instrument (8314, USA) (Hosseinpour Aghaei et al., 2018). Ammonia (0.41± 0.08), nitrite (0.021± 0.003) and nitrate (22.4± 1.9) were measured by ASTM International D1426-08 and D3867-09, respectively, and they were in a standard range. Furthermore, salinity was measured daily with a salinity refractometer tester ATC (Vertex TM) and adjusted (14.9± 2.2) in the water source before adding water to the experimental tanks.
2.4 Growth performance


2.4.1 Blood collection and sample preparation
Six fish from each tank were sampled for haematological, immune response, blood biochemistry and antioxidant analyses. For preventing stress, the fish were anaesthetized by a stock solution of clove oil (50 mg/L), and blood samples were collected quickly through venipuncture of the caudal vein using a sterile 5-ml syringe. Next, blood was kept in the fridge for 2 hours for blood clotting, and then, serum was collected after centrifuging at 3000 × g at 4°C (Esmaeili et al., 2017a).
2.4.2 Haematology profile
Red blood cells (RBCs) were counted in a Neubauer haemocytometer after diluting the whole blood with Natt, M. P. and C. A. Herrick solution (1:200), containing 0.1 g of brilliant cresyl blue, 3.8 g of sodium citrate and 0.2 ml of 37% formaldehyde in 100 ml of distilled water. We counted five central compartments of the Neubauer chamber's middle square, and the results were multiplied by 10,000. Four marginal squares in the Neubauer chamber were used to count white blood cells (WBCs) once the blood was diluted 1:50 with Natt, M. P. and C. A. Herrick solution, where the results were multiplied by 50 (Kenari et al., 2013). Haemoglobin was measured using the cyanmethaemoglobin method. The uncoagulated blood (20 μl) was mixed with 5 ml of Drabkin's solution and placed in dark for 5 min. Afterwards, it was read (in g/dl) by a spectrophotometer at 540 nm. Haematocrit was determined by the microhaematocrit method. Initially, more than two-thirds of haematocrit capillary tubes were filled with uncoagulated blood. The tubes were centrifuged at 13,000 × g for 5 min in a microhaematocrit apparatus, and then, haematocrit values were read using a specific graded sheet (Řehulka et al., 2004). Mean corpuscular volume (MCV), mean corpuscular haemoglobin (MCH), mean corpuscular haemoglobin concentration (MCHC) (Wintrobe, 1929) and blood performance (this formula was introduced by Moha Esmaeili and reported elsewhere (Montazeri Parchikolaei et al., 2021)) were calculated according to the below formula:
Mean corpuscular volume (MCV) (fl)= (Haematocrit/(RBC 106/mm3)) ×10.
Mean corpuscular haemoglobin (MCH) (pg)= Haemoglobin/ RBC 106/mm3× 10.
MCHC =Haemoglobin/Haematocrit ×100.
Blood performance=RBC (106/mm3) + WBC (103/mm3) + Haematocrit (%) +Haemoglobin (g/dl) + total protein (g/dl).
2.4.3 Blood biochemistry, antioxidant enzymes activities and cortisol
According to the protocols, glucose, total protein, albumin, globulin and lactate were measured by the kits from the Pars Azmun Company (Pars Azmun, Karaj, Iran). According to the protocol, the antioxidant enzymes, including superoxide dismutase (SOD), catalase (CAT), glutathione peroxidase (GPx) and malondialdehyde (MDA), were determined using ELISA kits analysis (ZellBio, GmbH, Germany). Cortisol in the serum was measured using commercial kits (i-CHROMA, South Korea) based on the protocol available in the kit package.
2.5 Non-specific immune parameters
2.5.1 Lysozyme activity
Serum lysozyme was determined by the gram-positive bacteria sensitive to the lysozyme enzyme method (Micrococcus lysodeikticus) (Clerton et al., 2001). In summary, the egg white lysozyme enzyme was used as standard; 0, 5, 10, 25, 50 and 100 μg/ml dissolved in the phosphate buffer (0.1 M and pH =5.8). Then, 25 μl of the standard sample and serum of different treatments were separately poured into each 96-well microplate, each with three replicates. Next, 175 μl of suspension of M. lysodeikticus in the same buffer (75 μg/ ml) was added to each well and immediately mixed with serum samples and allowed to react at 20 ° C. The light absorbance of the samples was read at a wavelength of 450 nm every 30 seconds once for up to five minutes with Microplate Reader (Awareness Technology Stat Fax 3200, Ramsey, USA) (Tukmechi et al., 2007). The amount of the sample resulted in a decrease in absorbance of 0.001/min, considered a unit of lysozyme activity.
2.5.2 Alternative complement pathway haemolytic activity (ACH50)

In the above relation, K is the volume of serum in ml, which causes 50% haemolysis, 0.5 is constant, and finally, the dilution factor in this test is 0.01.
2.5.3 Immunoglobulin M (IgM)
Serum IgM levels were measured by ELISA method using a kit (CUSABIO-CSB-E12045Fh-China) at a wavelength of 450 nm based on the protocol available in the kit package.
2.5.4 Serum levels of complement C3 (C3)
Serum C3 levels were measured by the ELISA method using a kit (CUSABIO, CSB-E09727s-China) at a wavelength of 450 nm. This assay employs the competitive inhibition enzyme immunoassay technique. The microtiter plate provided in this kit was precoated with goat-anti-rabbit antibody. Standards or samples were added to the appropriate microtiter plate wells with an antibody specific for C3, and horseradish peroxidase (HRP) conjugated C3. The competitive inhibition reaction was launched between HRP labelled C3 and unlabelled C3 with the antibody. A substrate solution was added to the wells, and the colour developed opposite to the amount of C3 in the sample. The colour development was stopped, and the intensity of the colour was measured.
2.5.5 Serum levels of complement C4 (C4)
Serum C4 levels were measured by fish C4 ELISA Kit (MyBioSource, USA) at a wavelength of 450 nm. This assay employs the quantitative sandwich enzyme immunoassay technique. Antibody specific for C4 was precoated onto a microplate. Standards and samples were pipetted into the wells, and the immobilized antibody bound to any C4 present. After removing any unbound substances, a biotin-conjugated antibody specific for C4 was added to the wells. After washing, avidin-conjugated horseradish peroxidase (HRP) was added to the wells. Following removal of any unbound avidin-enzyme reagent, a substrate solution was added to the wells and colour developed in proportion to the amount of C4 bound in the initial step. The colour development was stopped, and the intensity of the colour was measured at a wavelength of 450 nm.
2.6 High stocking density (HSDensity) stress
According to previous research in beluga (Feshalami et al., 2017; Rafatnezhad et al., 2008), we set up the optimum density during the experimental period (2.2 kg/m3), which means 17 fish (209.3+25.4) per 1600-litre water (size tank 2*1*1 m with a water depth of 80 cm). After sampling the fish at the end of the experiment (6 fishes per tank), the rest of the fish were divided between 24 tanks (1000 litter), which means two tanks (11 fish per each) per treatment for HSDensity stress. For this stress, according to the previous works (Feshalami et al., 2017; Rafatnezhad et al., 2008), the highest density that brought in impairment of growth (8 kg/m3) did not affect cortisol level. Therefore, we selected a higher density (12 kg/m3) to simulate a stressful situation for fish. For setting up this density, water volume was set up according to the weight of the fish. The water supply of each tank was independent of the others. After 4 hours, blood samples were taken as described in section 2.4.1 for monitoring stress factors (glucose, lactate and cortisol), haematology and ion parameters. Three fish per tank were sampled for measuring these factors. There was no mortality after 4 hours of HSDensity stress.
2.7 Osmolality and inorganic ions
For measuring inorganic ions, including serum sodium, potassium and chloride, an electrolyte analyzer (Eppendorf, EPOS, Germany) was used and reported as millimoles per litre. Plasma osmolality was determined using a freezing point osmometer (Knauer, K-7400, Germany) and reported as milliosmoles per kilogram. Finally, the calcium contents in serum were measured by a commercial kit (Pars Azmun, Karaj, Iran).
2.8 Statistical analysis
This experiment was conducted in a completely randomized design with twelve treatments and three replications. For providing a comprehensive analysis, we applied orthogonal polynomial contrasts to determine whether the taurine level had linear and/or quadratic relations with the measured parameters. Furthermore, we used a two-way ANOVA to investigate the ‘taurine effect’ and ‘salinity effect’. Data were analysed after checking the normality of data and homogeneity of variance. Furthermore, for checking how stress affected each treatment, we compared the data before and after stress using an independent sample t test. For all analyses, the level of 5% was considered as the threshold for a significant difference between the treatments or trends. The SPSS software (version 21.0 for Windows) was used for data analyses.
3 RESULTS AND DISCUSSION
Taurine requirement is a relatively new topic, and most studies on fish have been performed since the early 2000s. Different fish species from different trophic levels (herbivores/detritivores (2:He/De), omnivorous (2–3.5:Omn) and carnivorous (4–5:Car)) have shown a wide range of requirements, and sti, limited knowledge is available for the many fish species. In the only study in sturgeons, Persian sturgeon (Acipenser persicus) (Omn) had close to zero taurine requirements to maintain growth and health (Hoseini et al., 2017). Our study is the first to investigate amino acid requirements at different salinity levels in aquaculture species. Traditionally, beluga has been farmed in FW, but a few farmers farm this species in BW.
3.1 End of the experimental period
3.1.1 Growth performance
Growth performance is widely used to estimate amino acid requirements. The quadratic regression analysis showed that 12.1 g/kg was the threshold for providing maximum weight gain in FW and SW (Table S3; Figure 1). According to Table S2, there was no significant taurine effect on survival rate, hepatosomatic index, feed conversion efficiency (FCE) and feed consumption, but FCE, weight gain and feed consumption in BW were significantly higher than in FW (p<0.05). The most fish species have requirements between 10 and 15 g/kg (40 out of 85 species) (Sampath et al., 2020), which is consistent with our data. Unlike the present study, in the only available taurine study in sturgeons, even supplementing 2.8 g/kg taurine to diets reduced growth rate. Those results show how taurine acts differently even among fish from the same family. Further research is required to determine taurine requirements for each fish species. Both taurine and salinity positively affected appetite and eventually caused an increased growth rate.
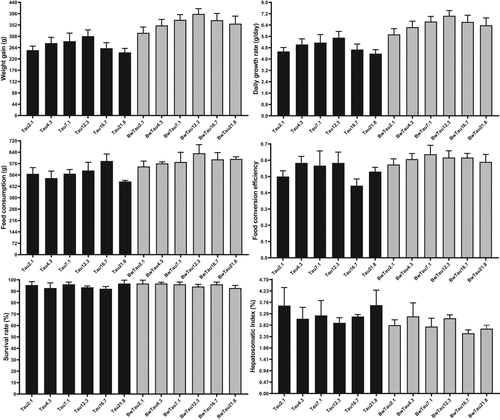
Salinity up to 15 ppt improved growth and feed utilization in Coho salmon (Car) (Otto, 1971), grass carp (Ctenopharyngodon idella) (He/De) (Kilambi, 1980) and redbreast tilapia (Tilapia rendalli) (Omn) (Kang'ombe & Brown, 2008). In 22-g beluga, unlike our study, growth was reduced/unchanged with increasing salinity up to 12 ppt (Jalali et al., 2017), indicating that the size of fish matters. However, the difference between the SGR of fish farmed in FW (2.5) and salinity of 12 (2.4) in their work (Jalali et al., 2017) was not notable. In our study, the initial weight of fish was 209 g showing bigger fish are able to grow better at higher salinity. In this regard, effects of age/size were reported on oxygen consumption, growth and osmoregulation in green sturgeon (Acipenser medirostris) (Omn) (Allen & Cech, 2007).
3.1.2 Immune response
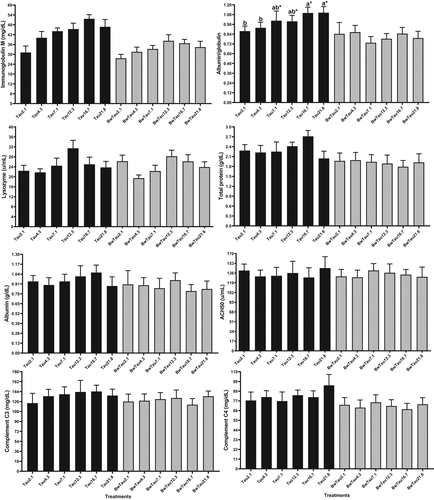
In other animals, strong evidence suggests that taurine regulates pro-inflammatory and immune responses (Marcinkiewicz & Kontny, 2014; Schuller-Levis & Park, 2004). Taurine does this with two cascading mechanisms: i) neutralization of oxidative species and modulation of leukocyte gene expression (Schuller-Levis & Park, 2004) and ii) modulating the inflammatory response by inhibiting the production of pro-inflammatory mediators TNF-α, PGE2, nitric oxide and interleukins (Park et al., 2002). However, the exact mechanism of its immunoregulatory properties is still not clear in fish. In the present study, IgM (max: 12.72 g/kg) and lysozyme (max: 13.54 g/kg) were affected by taurine with a quadratic relation between these parameters and increasing taurine in diets (p < 0.05) (Table S3; Figure 2). The TauEff for lysozyme and IgM was significant. Additionally, the salinity effect (SalEff) for IgM, total protein and C4 was significant (Table S2) (p < 0.05). In teleost fish, IgM is a major component in the specific humoral defence system. Similarly, higher lysozyme and IgM were observed when yellow catfish (Pelteobagrus fulvidraco) (Omn) were fed with dietary 16 g/kg taurine compared to 0.2 or 0.4 g/kg diets (Li et al., 2016). A study on yellowfin seabream (Acanthopagrus latus) (Car) indicated feeding fish with 12.5 g/kg taurine improved lysozyme and ACH50 in the mucus compared with those fed dietary 2.3 g/kg taurine (Dehghani et al., 2020). Adeshina and Abdel-Tawwab (2020) reported improved total protein, albumin and ACH50 upon feeding African catfish (Clarias gariepinus) (Omn) with 21.6 g/kg taurine as compared with those fed 0.9 g/kg taurine. Similar to our study for the IgM, C4 and total protein, farming fish in BW decreased cellular immune responses, including phagocytosis as well as the number of circulating neutrophils and monocytes (Choi et al., 2013). Unlike our results, improvement of serum IgM level was reported in Chinese sturgeon (Acipenser sinensis) (Omn) (Qin et al., 2020), and lysozyme and ACH50 in yellowfin seabream (Car) and Asian seabass (Lates calcarifer) (Omn) (Mozanzadeh et al., 2021). Most of the literature has reported improved immune response through farming in BW. Generally, 13–16 g/kg taurine is the requirement of beluga to provide an optimum immune response (Tables S2 and S3) in FW and BW.
3.1.3 Antioxidant enzymes activities
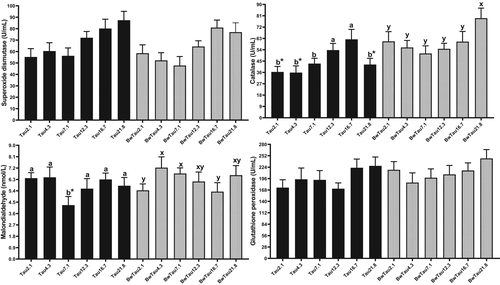
Studies of antioxidant enzymes such as SOD, CAT, GPx, and MDA compounds in fish can offer useful biomarkers for fish physiology under stress or environmental alterations. These enzymes play vital roles in protecting cells against uncontrolled oxidative processes, leading to the radical damage of superoxide and H2O2 (Martínez-Álvarez et al., 2005). In the present study, there was a linear relationship with increasing taurine and SOD, CAT and GPx in both FW and SW (Table S3; Figure 3) (p < 0.05). Both taurine and salinity affected SOD and GPx (Table S2) (p < 0.05). As some linear relationships were observed, we can propose that even including higher taurine levels can trigger the antioxidant system of beluga. Taurine is well known as a strong antioxidant and protects animals from oxidative stress by conferring an oxygen-free radical scavenger effect, leading to reduced lipid peroxidation, lowered membrane permeability and diminished intracellular oxidation (Ince et al., 2017; Nikkhah et al., 2021). As with our data, other studies have reported enhancements of SOD, CAT and GPx, and reduced MDA, for example, zebrafish (Danio rerio) (Omn) (Mezzomo et al., 2019), yellow catfish (Omn) (Li et al., 2016), yellowfin seabream (Car) (Dehghani et al., 2020), African catfish (Omn) (Adeshina & Abdel-Tawwab, 2020) and totoaba (Totoaba macdonaldi) (Omn) (Bañuelos-Vargas et al., 2014). However, no improvement was observed when fed different taurine levels in terms of SOD, CAT and GPx in flounder (Platichthys stellatus) (Car) (Li et al., 2021). Enhancement of SOD and GPx with dietary taurine supplementation may be a sign of increased resistance of beluga to oxidative stress. However, the optimum dosage of growth did not match with the optimum antioxidant system and fish health. Unlike our results, higher antioxidant activities were parallel with high growth performance in other studies (Ramezanzadeh et al., 2020a, 2020b; Zeilab Sendijani et al., 2020).
3.2 HSDensity stress
3.2.1 Haematology before and after HSDensity stress
Haematology and biochemistry parameters in the blood are relevant factors for monitoring fish status during environmental and nutritional changes (Fazio, 2019). These parameters can be influenced by multiple factors such as species, size, age, physiological status, environmental conditions and diet.
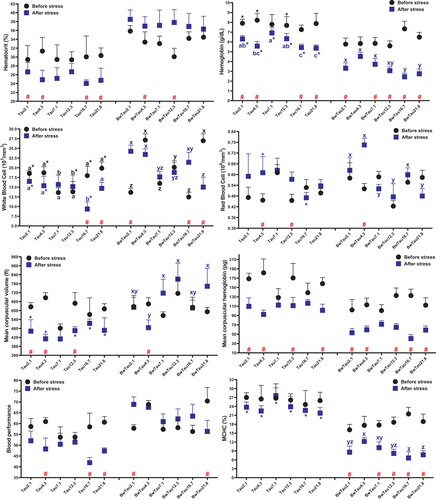
According to Table S3 before stress, there was a quadratic relationship between ‘taurine levels’ and RBC as well as blood performance in pooled data from both salinities, along with ‘taurine levels’ WBC in both FW and BW. Poststress, there was a linear relation in blood performance in pooled data, and haemoglobin, RBC, WBC with taurine levels in FW and BW. Two-way ANOVA analysis for prestress showed salinity affected haematocrit, haemoglobin, RBC, MCH, MCHC and blood performance. Poststress, the SalEff was significant for haematocrit, MCH and blood performance. Blood performance as a new haematological factor for aquaculture studies, a sum of the RBC, WBC, haematocrit, haemoglobin and total protein, was introduced elsewhere for the first time by Moha Esmaeili (Montazeri Parchikolaei et al., 2021). This factor worked well in our study as well, showing how stress negatively affected fish in FW rather than in BW. These results showed too much or too little inclusion of taurine affects haematological parameters. Feeding yellow catfish with a high taurine level in the diet elevated haemoglobin, RBC and haematocrit contents (Li et al., 2016), which is inconsistent with our study. Similar results were reported when yellowtail (Seriola quinqueradiata) (Car) were fed 33 g/kg taurine (Takagi et al., 2006). Unlike our data, after transferring beluga (28 g) from freshwater to BW (12 ppt), RBC, haematocrit, haemoglobin and MCH dropped, but MCV increased after 21 days of exposure (Zarejabad et al., 2010). Furthermore, they did not acclimate fish while we did it for three weeks to salinity before starting the eight-week experiment.
In other sturgeons, such as shortnose sturgeon (Acipenser brevirostrum) (Omn) (Jarvis & Ballantyne, 2003), Adriatic sturgeon (Acipenser naccarii) (Omn) (Martinez-Alvarez et al., 2002) and gulf sturgeon (Acipenser oxyrinchus desotoi) (Omn) (Altinok et al., 1998), both rise and fall were observed in haematocrit, RBC and haemoglobin level after living in different salinities.
After HSdensity stress, haematocrit, WBC, MCV and blood performance in FW were lower than in BW for most taurine levels. On the contrary, haemoglobin and MCHC in FW were higher than in BW after stress at most taurine levels showing that salinity affected these parameters after stress but not taurine. When each treatment was compared before and after stress, data showed a reduction in haematocrit, haemoglobin, MCV, MCH, blood performance and MCHC across all six treatments in FW (Figure 4), but not in BW. Beluga of size 93 g subjected to a high density showed elevated haematocrit, haemoglobin and RBC (Rafatnezhad et al., 2008). Similarly, 143 g beluga subjected to high-density stress showed declined WBC, but no changes in haematocrit and RBC (Feshalami et al., 2017). Both studies were in FW and fish was stocked in the same density. The observed difference can be explained by fish size, which is compatible with our FW outputs. The basic level of the abovementioned factors between FW and BW was approximately the same in our study. However, after HSDensity stress, haematological profiles of fish farmed in BW were more stable, showing that farming beluga in BW benefits fish health.
3.2.2 Ion and osmolality factors after HSDensity stress
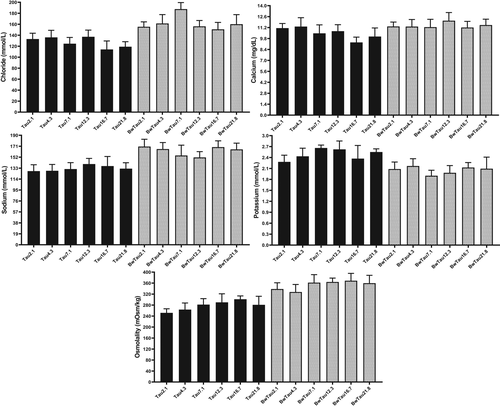
Plasma inorganic ions have been frequently used to test the amount of stress (Sampaio & Freire, 2016). According to Table S2, taurine only affected osmolality, while salinity affected calcium, potassium, chloride, sodium and osmolality. Takagi et al. (2006) reported a reduction in serum osmolality and osmotic tolerance of erythrocytes, which was in parallel with the present study.
In the present study, osmolality and inorganic ions in BW were statistically increased by taurine but not in FW (Figure 5). When a beluga (22 g) was farmed 60 days in 12 ppt, a rise in plasma sodium, potassium, calcium and magnesium was found (Jalali et al., 2017). In another study on Chinese sturgeon (Omn, 190 g), osmolality, sodium, chloride increased and potassium decreased in the serum of fish farmed in BW (15 ppt) as compared with FW (Zhao et al., 2016). These results were compatible with our data showing that increasing osmolality and inorganic ions are strategies to cope with salinity. Zhao et al. (2016) mentioned that elevated serum osmolality in sturgeon of this size/age may be normal and does not necessarily mean the occurrence of a stressful situation. In our study, higher growth in BW as compared to FW indicated that fish had no problem and could do salinity acclimation well. This point makes more sense knowing that sturgeon live at various salinities in the wild. The possibly higher contents of serum osmolality and inorganic ions are mechanisms for acclimation. However, unlike sturgeons, studies in other euryhaline fish species such as tilapia showed that osmolality and inorganic ions were the same between fish farmed at different salinities (Hwang et al., 1989; Soegianto et al., 2017).
3.2.3 Stress response after HSDensity
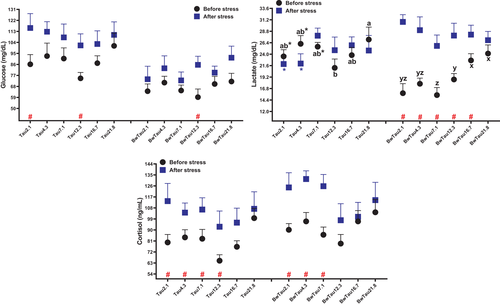
The prestress results of the present study indicated that taurine levels affected glucose and cortisol in both FW and BW. Quadratic and linear relations were observed for cortisol, lactate and glucose, showing that a moderate range of taurine can lower these parameters (Table S3). Accordingly, both SalEff and TauEff affected glucose and cortisol significantly (Table S2) (p<0.05). Few investigations in fish found a glucose-lowering effect of taurine (Martins et al., 2021; Salze et al., 2016). Regarding salinity, when beluga (22 g) was farmed 60 days in 12 ppt, an increase in plasma glucose levels was found (Jalali et al., 2017), which is compatible with our study.
After HSDensity stress, the results of cortisol in pooled data indicated downward linear and quadratic relations with increasing taurine (Table S3; Figure 6). The minimum stress measured as cortisol before and after stress was found at 10.44 g/kg and 14.32 g/kg taurine, respectively. These outputs showed that after stress, fish required more taurine to control cortisol levels and eventually alleviate stress by lowering it. The fish fed higher dosages of taurine (16.7 g/kg and 21.8 g/kg) controlled stress better, with no significant difference observed before and after stress for these taurine levels. Furthermore, glucose before and after stress in most of the treatments in BW was statistically lower than in FW. Similar to the present data, dietary taurine supplementation (1.5 g/kg diet) improved the capability of resisting dry stress in rice field eel (Monopterus albus) (Omn) (Hu et al., 2018). Unlike our data, when 93 g beluga (Rafatnezhad et al., 2008) and 143 g beluga (Feshalami et al., 2017) were subjected to a high density, there was no significant difference in glucose or cortisol as compared with fish farmed in low density. The reason for the lack of any considerable difference across treatments in their studies can be due to the fact that fish had enough time to acclimate with stress. In our study, increasing glucose and cortisol may have only been a short-term stress response.
4 CONCLUSION
Fish in BW grew better and had a more robust immune system in terms of IgM than in FW. There was a quadratic relation between weight gain and taurine level; the taurine requirement was 12.1 g/kg in BW and FW. Regarding immune system parameters, beluga fed 16.7 and 12.3 g/kg taurine had a better performance in FW and BW, respectively. In terms of the antioxidant system, the Tau16.7 group in FW and BwTau21.8 in BW had the best performance. Finally, when we exposed fish to HSDensity stress, those fed dietary 16.7 and 21.8 g/kg taurine had more stable glucose, cortisol and lactate pre- and poststress in both FW and BW. More molecular studies should focus on checking how taurine contributes to the improvement of the factors measured in this study. As beluga of this size grew in BW without any impairments of growth and health factors, farming this species in the BW resources (that cannot be used for other agriculture purposes) is a crucial step towards aquaculture sustainability in these areas.
ACKNOWLEDGEMENTS
The authors wish to thank the Islamic Azad University for its financial support. Many thanks to Moha Esmaeili for his valuable efforts in the writing process and other steps of this research. Many thanks to Ghareboron Farm Centre for providing fish and places, and thanks are also extended to all people for their valuable practical assistance.
CONFLICT OF INTEREST
There is no conflict of interest for reporting.
Open Research
DATA AVAILABILITY STATEMENT
Data are available on request due to privacy/ethical restrictions (The data that support the findings of this study are available on request from the corresponding author. The data are not publicly available due to privacy or ethical restrictions).


