Automated motility and morphology measurement of live spermatozoa
Funding information
This work was funded by the Natural Sciences and Engineering Research Council of Canada (NSERC), the Canada Research Chairs Program, and the Ontario Research Fund—Research Excellence program.
Abstract
Background
Automated sperm analysis has wide applications in infertility diagnosis. Existing systems are not able to measure sperm count and both motility and morphology of individual live spermatozoa. Morphology measurement requires invasive staining, making the spermatozoa after morphology measurement not applicable to infertility treatment.
Objective
To evaluate the reproducibility and reliability of automated measurement of individual live sperm's motility and morphology.
Materials and methods
Fresh semen samples were obtained from twenty male partners attending for fertility investigations. The system firstly measured motility for all the spermatozoa within the field of view under a low magnification (20×), then a spermatozoa of interest is selected by the user and automatically relocated by the system after switching to a high magnification (100×) for morphology measurement. Reproducibility of sperm measurements was evaluated by intraclass correlation coefficients on consecutive measurement. Reliability of motility and morphology measurement was evaluated by tracking error rate and limits of agreement, respectively, with manual measurement as benchmark.
Results
Measurement of all motility and morphology parameters had intraclass correlation coefficients higher than 0.94. Sperm motility measurement had a tracking error rate of 2.1%. Limit of agreement analysis indicated that automated measurement and manual measurement of sperm morphology were interchangeable. Automated measurement of all morphology parameters was not statistically different from manual measurement, as confirmed by the paired sample t test.
Discussion
Automated motility and morphology measurement of single sperm revealed high reproducibility and reliability. The system also achieved a high efficiency for motility and morphology measurement. In addition to the intracytoplasmic sperm injection (ICSI) samples with polyvinylpyrrolidone (PVP), the developed sperm measurement technique is also effective for analyzing semen and washed samples. The system provides a valuable tool for quantitative measurement and selection of single spermatozoa for ICSI. It can also be used for sperm motility and morphology analysis in andrology laboratories.
1 INTRODUCTION
Sperm analysis constitutes a central part in male infertility diagnosis and treatment.1 In assisted reproductive technologies (ART), the measurement of individual live spermatozoa is used to select normal spermatozoa for treatment. For instance, in intracytoplasmic sperm injection (ICSI), a single spermatozoa is selected by observing its motility and morphology and injected into an oocyte, in which the normalcy of the selected sperm impacts clinical outcomes such as fertilization and pregnancy rates.2-4 However, for the past decades, the motility and morphology characteristics of individual spermatozoa in ICSI have been qualitatively evaluated by manual observation, which involves significant inconsistency and subjectivity.
Techniques have been developed for automated sperm measurement, such as computer-aided sperm analysis (CASA). The CASA systems measure motility on live spermatozoa but need to fix and stain spermatozoa for morphology measurement,5-7 thus cannot measure both motility and morphology on the same live spermatozoa. Fixation and staining of spermatozoa also make the spermatozoa after measurement unusable for ART treatment.8 CASA systems are not presently used to guide sperm selection for ICSI.
For morphology measurement in ICSI, it is performed without staining under 20× or 40× microscope objective, but the limited imaging resolution cannot visualize subcellular structures such as vacuoles. According to World Health Organization (WHO) guidelines,9 the sperm acrosomal region should contain no large vacuoles or no more than two small vacuoles, and the post-acrosomal region should not contain any vacuoles. Large vacuoles are indicative of abnormal chromatin packaging10 and DNA fragmentation.11 It was reported that the classification of spermatozoa based on vacuole size and number was strongly associated with fertilization rate and expansion rate of blastocysts.3 The use of spermatozoa with no vacuole or one small vacuole also led to significantly higher blastocyst and pregnancy rates than that with large vacuoles.12, 13
Although sperm vacuole can be visualized under 100× microscope objective, motility parameters are difficult to measure under 100× due to the limited field of view. Additionally, searching for and locating a normal spermatozoa is time consuming. For instance, it took more than 2 h under 100× to search for ten normal spermatozoa for injection.14 Currently, there is no technique capable of quantitatively measuring both motility and morphology on individual live spermatozoa.
The present study describes the evaluation of a sperm analysis system for measuring both motility and morphology of individual live spermatozoa. The system integrates novel computer vision algorithms and automatic magnification switch control, both developed by the authors, to provide reproducible and accurate results. The system was evaluated in terms of reproducibility in consecutive measurements and reliability in comparison with manual measurement.
2 MATERIALS AND METHODS
2.1 Semen preparation
Twenty semen specimens were obtained from the CReATe Biobank, CReATe Fertility Centre. The CReATe Biobank approved by Veritas IRB, collects, stores and distributes biological materials from consenting patients according to best practice-based standards of biobanking. Patients were recruited at reception, and all semen samples used in this study were fresh. Semen samples were collected by masturbation after 2 to 5 days of sexual abstinence. The semen was incubated at 37°C, 5% CO2 for 30 min to be liquefied. A routine semen analysis according to WHO guidelines along with the density gradient centrifugation was performed to evaluate the sperm quality and to separate motile from immotile sperm populations, respectively. Semen analysis data are summarized in Table 1. The sperm concentrations of all semen specimens in this study were higher than 30×106/ml. To isolate motile spermatozoa, the semen sample was placed on top of 2 ml of gradient medium (PureSperm 80 and PureSperm 40) in a 15 ml conical tube, and centrifuged at 200 × g for 10 min, allowing the motile sperm cells to move through the gradient medium and form a pellet (ie, motile spermatozoa). The samples were spared from the same clinical samples used in ICSI. The ICSI sperm samples were processed using the standard protocol including density centrifugation and mixing with 7% polyvinylpyrrolidone (PVP).
| Semen parameters | Mean (±standard deviation) |
|---|---|
| Ejaculate volume (ml) | 2.9 (±1.5) |
| Sperm concentration (×106/ml) | 34.1 (±29.6) |
| Sperm motility (%) | 39.8 (±15.8) |
| Normal morphology (%) | 9.3 (±4.8) |
2.2 Automated measurement system
The system was built around an inverted microscope (Eclipse Ti-S, Nikon) equipped with a motorized stage (H117, Prior) and a motorized nosepiece (TI-ND6-E). The motorized nosepiece contains a 20× objective (Plan Fluor, Nikon) and a 100× objective (Plan Apo, Nikon). A camera (acA1300-30gc, Basler) was connected to the microscope to capture images at 30 frames per second. The frame rate of 30 Hz was experimentally determined for motility measurement of ICSI samples with 7% PVP. The comparison of motility measurement made at different frame rates was summarized in Table S1. The system setup is shown in Figure 1A.
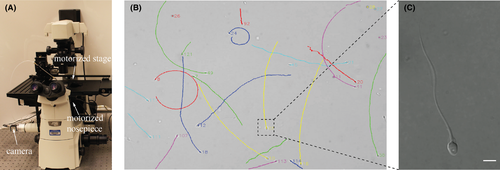
Sperm motility measurement requires low magnification to have a large field of view. Differently, morphology measurement needs high magnification to have a high imaging resolution. To tackle this trade-off, we developed the system to measure both motility and morphology on individual spermatozoa by automatic magnification switch. During switch, the motorized nosepiece firstly lowers the 20× microscope objective, switches to the 100× microscope objective, and then raises the 100× objective. The lowering and raising distances are calibrated to ensure the same spermatozoa to be in focus after switch. It firstly measures motility for all the spermatozoa within the field of view under a low magnification (20×), then a spermatozoa of interest is selected by the user and automatically relocated by the system after switching to a high magnification (100×) for morphology measurement, as shown in Figure 1B,C. The automated measurement process is also shown in Video S1.
After switching to high magnification, relocating the same spermatozoa is complicated by sperm movement and reduced field of view. In the automated system, the sperm position after magnification switch is predicted based on its trajectory measured under 20×, and coordinate transformation between different magnifications is built in the system to automatically move the predicted sperm position to the center of the field of view under 100×.
2.3 Automated motility measurement
Sperm motility is measured by computer tracking of each spermatozoa to derive its trajectory under 20×. A spermatozoa is computer tracked for 2 s (60 image frames), and motility parameters are calculated based on the sperm trajectory captured during the two-sec period. Since sperm swim slower in ICSI samples than in raw semen, the capture duration was selected to be longer than that of most CASA systems.15, 16 The comparison of motility measurement made under different capture duration was summarized in Table S2. Comparing the 2 s and 10 s capture durations, one can see that the difference in all the motility parameters was <4%. In accordance with the WHO guidelines,10 nine motility parameters are calculated including curvilinear velocity (VCL), straight-line velocity (VSL), average path velocity (VAP), amplitude of lateral head displacement (ALH), linearity (LIN), wobble (WOB), straightness (STR), beat-cross frequency (BCF), and mean angular displacement (MAD). These parameters are derived from a sperm's trajectory. For example, VCL is the velocity along the trajectory; VAP is the velocity along the path that averages the trajectory every 5 frames; and ALH is the Euclidean distance from the curvilinear trajectory to the average path, which is derived by averaging the trajectory every 5 frames.
Sperm crossing over each other can cause mismatch of the tracked spermatozoa. Commercial CASA systems are prone to tracking errors from sperm crossing over,17, 18 which results in disturbances to sperm's trajectories and hence motility measurement.19 To achieve reliable tracking of individual spermatozoa even when they cross-over each other, we have developed a shape-based robust sperm tracker, which is built upon joint probabilistic data association filter (JPDAF).20 Since JPDAF only utilizes kinematics information (position and velocity) and is still prone to tracking errors when cross-over spermatozoa have similar positions and velocities, our sperm tracker incorporates additional shape information of spermatozoa (e.g. head orientation angle) to better differentiate the cross-over spermatozoa. In the shape-based robust sperm tracker, the state vector of a spermatozoa at time (frame) k is  , in which x and y are sperm positions on the image,
  and
and  are sperm velocities, and θ is the head orientation angle. The robust sperm tracker enumerates all association cases between spermatozoa and measurements and updates association probability, to reduce tracking errors from sperm crossing over. Our previous results showed that standard JPDAF method only had a success rate of 81.2% for sperm tracking, and our developed sperm tracker achieved a success rate of 95.6%.20
2.4 Automated morphology measurement
Sperm morphology is automatically measured by image processing under 100×. Differential interference contrast (DIC) imaging is used to increase image contrast without invasive staining. Since most sperm spin their head during swimming, their morphology parameters keep changing. It is desired to measure morphology when the flat plane of the sperm head is parallel with the image plane; otherwise, the measured head dimension is less than the true value and vacuoles are not visible (see Figure 2A,B). Thus, the system automatically detects head spin by measuring periodic changes of head width during head spin. Sperm morphology is measured in 60 consecutive image frames, and morphology parameters are derived only from the frame in which sperm head's flat plane is maximal, indicating the head's flat plane is parallel with the image plane. (see Figure 2C).
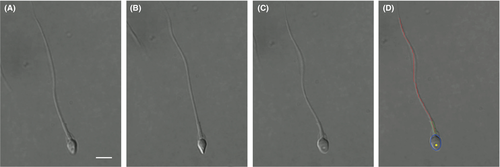
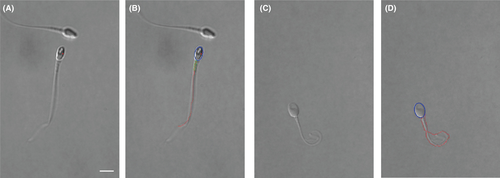
Image segmentation is then performed to extract the sperm's contour, as shown in Figure 2D. The contour of sperm head is fit into an ellipse with lengths of its major and minor axes to be head length and width. The neck angle is measured as the angle between the major axes of head and midpiece. Vacuoles on the sperm head are detected by finding holes on the head in segmented image. The vacuole area ratio is measured as the ratio of vacuole area to the head area. Besides head morphology, we also used the extracted tail contour to identify tail defects such as bent tail and coiled tail (see Figure 3).
2.5 Manual measurement
For motility measurement, the sperm tracking was examined manually on recorded videos to confirm if the tracking points (labeled with different colors in Video S1) were consistently on each sperm's head. Tracking was evaluated until a tracked sperm swam out of the field of view. Tracking errors occurred when the system lost track of a spermatozoa or mismatched two spermatozoa when they crossed over each other. For morphology measurement, manual measurements were made offline by embryologists on videos recorded by the developed system and were overseen by an experienced andrologist. In each video, the image frame was carefully selected with sperm head's flat plane parallel with the image plane. The embryologists zoomed in and labeled using ImageJ with best care for morphology measurement. Since fixation and staining change the morphometric dimension of spermatozoa,21, 22 both automated and manual morphology measurements were made on the same live spermatozoa.
2.6 Statistics
MedCalc software (version 19.1) was used for statistical analysis. In this study, motility and morphology measurement were made on 1000 spermatozoa (50 spermatozoa from each of the 20 patient samples). The power analysis shown in Supplementary Materials Supplementary Materials proved the sufficiency of this sample size. The 50 spermatozoa in each patient sample were randomly selected to cover a range of different motility and morphology, and measurement was performed on each of the 50 individual spermatozoa.
To assess the reproducibility of motility and morphology measurement, the intraclass correlation coefficients (ICC) and their 95% confidence interval (CI) were calculated from three consecutive measurements. The ICC is the ratio of the between-subject variability to the total variability. A high ICC indicates a high agreement among consecutive measurements. Its corresponding 95% CI means that with 95% confidence the true ICC value is within the range.
The reliability of motility measurement was assessed by the tracking error rate, which is the ratio of tracking errors to the total tracked spermatozoa. To assess the reliability of morphology measurement, limits of agreement and ICC were calculated by comparison with manual measurement. To statistically compare automated and manual measurement, paired sample t test was used and a p value less than 0.05 was considered to be statistically different.
3 RESULTS
Automated measurement of sperm motility is highly reproducible. Table 2 presents the measurement reproducibility for each motility parameter, evaluated by ICC, and the ranges for each motility parameter in ICSI samples. The measurements were performed on 1000 spermatozoa (50 per patient). Each sperm was measured consecutively for three times. The ICC values for all motility parameters were higher than 0.94 from consecutive measurement on individual spermatozoa. Considering that ICC values ranging from 0.41 to 0.60, 0.61 to 0.80 and greater than 0.80 were regarded as moderate, substantial and almost perfect agreement,23, 24 the ICC value of 0.94 achieved by our automated system indicates high reproducibility.
| Motility parameters | ICC (95% CI) | Range |
|---|---|---|
| VCL | 0.995 (0.990 to 0.998) | 3.48 to 32.23 µm/s |
| VSL | 0.994 (0.988 to 0.997) | 2.17 to 30.84 µm/s |
| VAP | 0.995 (0.985 to 0.997) | 4.82 to 31.52 µm/s |
| ALH | 0.974 (0.938 to 0.993) | 0.05 to 1.09 µm/s |
| LIN | 0.956 (0.900 to 0.986) | 0.31 to 0.99 |
| WOB | 0.940 (0.840 to 0.977) | 0.27 to 1.00 |
| STR | 0.945 (0.861 to 0.978) | 0.30 to 1.00 |
| BCF | 0.941 (0.865 to 0.982) | 2.16 to 25.55 Hz |
| MAD | 0.974 (0.935 to 0.990) | 0.07 to 1.54 |
- Abbreviations: ALH, amplitude of lateral head displacement; BCF, beat-cross frequency; LIN, linearity; MAD, mean angular displacement; STR, straightness; VAP, average path velocity; VCL, curvilinear velocity; VSL, straight-line velocity; WOB, wobble.
Motility parameters of each spermatozoa were derived from the tracked sperm trajectory. To evaluate the reliability of motility measurement, we examined tracking errors on the 20 patient samples, as shown in Table 3. Multiple fields of view were collected for each patient sample, with all spermatozoa within the field of view simultaneously tracked. The error rate is defined as the ratio of tracking errors (sperm lost or mismatched) to the total tracked spermatozoa. A total of 3226 spermatozoa from the ten patients were measured, and the overall error rate was 1.5%. The developed robust sperm tracker can reliably handle sperm crossing over even for high sperm concentrations, and the tests on semen and washed samples achieved the ICC higher than 0.93 and the error rate of 2.1% (n = 1000, see Table S3).
| Patient | #1 | #2 | #3 | #4 | #5 | #6 | #7 | #8 | #9 | #10 | #11 | #12 | #13 | #14 | #15 | #16 | #17 | #18 | #19 | #20 | Overall |
|---|---|---|---|---|---|---|---|---|---|---|---|---|---|---|---|---|---|---|---|---|---|
| Sperm number | 147 | 182 | 152 | 173 | 179 | 144 | 139 | 152 | 161 | 180 | 156 | 149 | 187 | 162 | 139 | 181 | 172 | 159 | 145 | 167 | 3226 |
| Tracking errors | 3 | 2 | 4 | 4 | 5 | 2 | 3 | 4 | 3 | 4 | 2 | 1 | 2 | 1 | 1 | 2 | 3 | 1 | 2 | 1 | 50 |
| Error rate (%) | 2.0 | 1.1 | 2.6 | 2.3 | 2.8 | 1.4 | 2.2 | 2.6 | 1.7 | 2.2 | 1.3 | 0.6 | 1.1 | 0.6 | 0.7 | 1.1 | 1.7 | 0.6 | 1.3 | 0.6 | 1.5 |
To evaluate the reproducibility of automated morphology measurement, the measurements were performed on 1000 spermatozoa (50 per patient). Each spermatozoa were measured consecutively for three times. As summarized in Table 4, for the measured head length, head width, vacuole area ratio, and neck angle, their ICC values were all higher than 0.96 from consecutive measurement on individual spermatozoa, indicating high reproducibility.
| Morphology parameters | ICC (95% CI) | Error (±standard deviation) |
|---|---|---|
| Head length | 0.971 (0.889 to 0.995) | 0.14 ± 0.10 µm |
| Head width | 0.976 (0.909 to 0.995) | 0.13 ± 0.09 µm |
| Vacuole area ratio | 0.964 (0.862 to 0.994) | 0.011 ± 0.008 |
| Neck angle | 0.968 (0.881 to 0.994) | 1.03 ± 0.80° |
Limits of agreement were used to evaluate the reliability of automated morphology measurement. Figure 4 shows the limits of agreement between automated measurement and manual measurement for the four morphology parameters. The 95% limits of agreement (and corresponding 95% confidence interval) as shown in Figure 3, indicating that there is a 5% chance for the difference to reach the limits, were −0.33 (−0.35 to −0.32) to 0.34 (0.33 to 0.36) µm for head length, −0.31 (−0.33 to −0.30) to 0.31 (0.29 to 0.33) µm for head width, −0.028 (−0.030 to −0.027) to 0.026 (0.025 to 0.028) for vacuole area ratio, and −2.59 (−2.73 to −2.45) to 2.48 (2.35 to 2.62)° for neck angle. Furthermore, errors of automated measurement were calculated as the absolute difference between automated and manual measurements, as summarized in Table 4. The errors were 0.14 ± 0.10 µm for head length, 0.13 ± 0.09 µm for head width, 0.011 ± 0.008 for vacuole area ratio, and 1.03 ± 0.80° for neck angle. Our staining-free morphology measurement resulted in errors less than 5%. Previous methods require invasive staining to measure sperm morphology, and their measurement errors ranged from 5% to 15% compared with manual benchmarking.8, 25
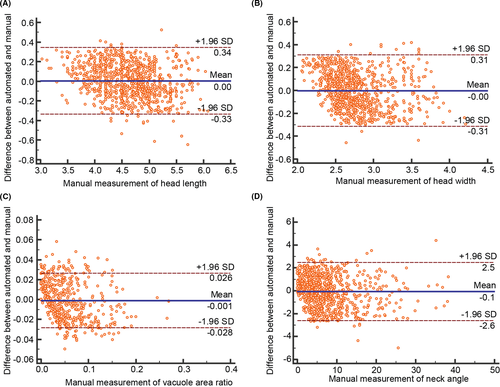
Reliability of automated morphology measurement was also evaluated by ICC. The ICC values, correlating automated and manual morphology measurements, are summarized in Table 5. A high ICC indicates a high agreement between automated and manual measurements. The ICC values for the four morphology parameters were all higher than 0.94 from the measurement made on individual spermatozoa. By using the paired sample t test, it was found that the automated and manual measurements were not statistically different for all morphology parameters: p = 0.41 for head length, p = 0.62 for head width, p = 0.19 for vacuole area ratio, and p = 0.16 for neck angle. The measurement of tail defects including bent tail and coiled tail achieved a precision of 97.6% and a specificity of 98.0% (n = 1000).
| Automated vs. manual | ICC | 95% CI |
|---|---|---|
| Head length | 0.972 | 0.965 to 0.977 |
| Head width | 0.945 | 0.934 to 0.952 |
| Vacuole area ratio | 0.961 | 0.952 to 0.970 |
| Neck angle | 0.986 | 0.981 to 0.990 |
To evaluate the inter-operator variation in automated morphology measurement, three operators used the system to measure morphology on the same spermatozoa, and the ICC values were calculated to determine the agreement among the measurement by different operators. As summarized in Table S4, the ICC values for all morphology parameters are higher than 0.95, showing a small inter-operator variation.
4 DISCUSSION
Presently, ART especially ICSI relies on manual observation to select spermatozoa with normal motility and morphology. CASA systems were developed to overcome subjectivity and inconsistency in manual observation; however, they cannot measure motility and morphology of the same spermatozoa and require invasive staining for morphology measurement.5, 6 To quantitatively measure both motility and morphology of individual live spermatozoa, we developed an automated system by adding standard off-the-shelf motorized stage and nosepiece to a typical ICSI setup. Novel algorithms were developed for automated measurement and magnification switch, and customized software was designed for ease of use.
This study evaluated the reproducibility and reliability of the automated sperm measurement system. The high reproducibility in automated measurement can reduce intra- and inter-operator variability, which is inevitable in manual observation. A low tracking error rate of 2.1% demonstrated the reliability of motility measurement. Automated and manual measurements of sperm morphology were confirmed to be interchangeable, based on limits of agreement analysis. It should be noted that the manual morphology measurement, as benchmark here, was performed offline with best care on recorded videos, which took about 2 min to measure the morphology parameters for one spermatozoa. Automated morphology measurement instead cost less than 2 s.
The system also achieved a high efficiency for motility and morphology measurement. It performs motility measurement under low magnification (20×) to filter out spermatozoa with low motility, and the following morphology measurement under high magnification (100×) is only performed on those spermatozoa with high motility. The time cost of a complete measurement process is ~6 s, including 2 s for motility measurement, 2 s for magnification switch, and 2 s for morphology measurement. The process may be repeated several times to search for a normal spermatozoa. This approach has the throughput comparable to experienced embryologists for manually observing, estimating, and selecting spermatozoa under 20× or 40× in ICSI, but provides quantitative data for both motility and morphology parameters, and the morphology parameters are measured with a higher resolution under 100×.
Computer-aided sperm analysis systems suffer from sperm count errors by incorrectly detecting non-sperm cells (leukocytes or immature germ cells) and cell debris as spermatozoa.15 The most common approach to reduce miscounting is by gating on the pixel size so that an object whose pixel size is larger or smaller than the threshold is removed.16 However, this approach is not effective for eliminating those debris with similar sizes to spermatozoa. The automated system in this paper used additional shape information to reduce detection errors. Specifically, the elliptical shape of a sperm head was used to differentiate sperm from non-sperm cells and debris.
The semen samples in this study were from 10 patients with normospermia and another 10 patients with oligospermia. In the specimens of normospermia, a field view under 20× had many sperm crossing over each other, and the multi-sperm tracking algorithm was tested to handle these challenging cases. In the case of oligozoospermia, there were fewer spermatozoa in a field view and thus a lower likelihood of sperm crossing over, leading to lower tracking errors. Although a lower concentration of spermatozoa can reduce sperm tracks crossing, too low a concentration makes it time consuming to search for a normal spermatozoa due to the low number of sperm present in each field of view. The developed sperm tracker was effective to high sperm concentrations, capable of reliably handling sperm crossing over when the number of spermatozoa was high in the field of view. It was also robust to debris which were excluded based on their shape and size. For immotile spermatozoa, the tracker rarely mismatched an immotile sperm with its nearby swimming spermatozoa since the state model of the tracker included both sperm position and velocity. In addition to the ICSI samples with PVP we tested, the developed sperm measurement technique is also effective for analyzing semen and washed samples. The tests on these samples showed that the reproducibility and reliability were comparable with those on ICSI samples.
Although a few works indicated there might not be an apparent relationship between DNA integrity and sperm motility and morphology,26 most of the literature on this topic supported a strong correlation between DNA integrity and sperm motility and morphology.27-29 In ICSI, embryologists routinely observe spermatozoa through the eyepieces of a microscope and qualitatively select a sperm with normal motility and morphology. Motility and morphology normalcy of spermatozoa have been positively correlated with ICSI outcomes including fertilization and pregnancy rates.30, 31 The developed system can help embryologists quantitatively (vs. qualitatively) select live spermatozoa with normal motility and morphology for ICSI.
The system provides automated measurement of both motility and morphology parameters on the same live spermatozoa, based on which the embryologist can perform more quantitative and informed sperm selection. Our next step is to explore the quantitative correlation between single sperm's motility and morphology and its DNA integrity as well as the effect of quantitative sperm selection on improved ICSI outcomes.
In conclusion, automated motility and morphology measurement of individual live spermatozoa have high reproducibility and reliability. It achieves efficient measurement by automatically switching between different magnifications and enables non-invasive morphology measurement with novel algorithms. It offers new capabilities for accurate and consistent assessment of sperm motility and morphology, and holds potential for standardizing sperm selection in ICSI. The system can also be used for semen analysis in andrology laboratories.
CONFLICT OF INTEREST
The authors have no conflict of interest to disclose.
AUTHOR CONTRIBUTIONS
C. Dai., Z. Zhang, S. Jahangiri, G. Shan, S. Moskovstev, C. Librach, K. Jarvi, and Y. Sun contributed to development of study idea, design and methodology. All co-authors contributed to the manuscript drafting and the critical discussion of this manuscript.


