Seasonal shifts in habitat use and diet by eland confined in a small fenced reserve
Abstract
enLarge-scale environmental changes create challenges for conservation of wildlife, particularly in fenced, insular protected areas where many wildlife populations persist. Moreover, large mammalian herbivores inhabiting spatially and temporally heterogeneous environments face the challenge of securing highly variable forage resources. Mixed feeders like the eland (Taurotragus oryx) can switch between browse and grass, but the cues that elicit that switch are not well understood. We investigated the seasonal diet shift of eland confined to a small fenced reserve and the role of greenness to elicit that shift. Eland changed from a diet in the wet season, consisting of grasses and browse found in woodland and grassland vegetation types, to a diet in the dry season dominated by the greenest browse species still available in woodland vegetation types, as greenness of dry season forage decreased. Our results suggest that eland switch from browsing to grazing in response to phenophase of the grass sward, which could explain the varying selection of grasses versus browse observed across the species range.
Résumé
frLes changements environnementaux à grand-échelle créent des défis pour la conservation de la faune, en particulier dans les zones protégées insulaires où de nombreuses populations d'espèces sauvages persistent. De plus, les grands mammifères herbivores habitant dans des environnements spatialement et temporellement hétérogènes sont confrontés au défi de sécuriser des ressources fourragères très variables. Les mangeoires mixtes comme l'Eland (Taurotragus oryx) peuvent parcourir entre la végétation et l’herbe, mais les indices qui suscitent ce changement ne sont pas bien compris. Nous avons étudié le changement de régime alimentaire saisonnier d'un Eland confiné dans une petite réserve clôturée et le rôle de la verdure pour susciter ce changement. L’Eland a changé d’un régime alimentaire composé de graminées et de feuilles trouvées dans les types de végétation des bois et des prairies pendant la saison des pluies à un régime alimentaire dominée par les espèces de feuilles les plus vertes encore disponibles dans les types de végétation forestière des zones boisées, comme la verdure du fourrage de saison sèche a diminué. Nos études suggèrent que le changement du broutage au pâturage en réponse à la phénophase du gazon, pourrait expliquer la diversité de sélection de graminées par rapport au pâturage observé à travers la gamme d’espèces.
1 INTRODUCTION
The variable nature of semi-arid savannahs and subtropical grasslands presents considerable challenges to large herbivores as they search for adequate forage. Large mammalian herbivores inhabiting these environments face the challenge of securing sufficient nutrition in a variable environment with periods of seasonal scarcity (Wilmshurst, Fryxell, & Colucci, 1999). One strategy to meet this challenge is to shift diet preference from preferred forage types that are available in times of plenty and can provide high-quality nutrition, to types that can sustain individuals during the lean times of suboptimal conditions. This is the strategy of mixed-foraging intermediate feeders (Meissner, Pieterse, & Potgieter, 1996; van Rooyen, 1992; du Toit, 1988). Such herbivores switch between grass and browse in response to variation in the abundance and quality of each (Hofmann & Stewart, 1972; Jarman, 1974). While some intermediate feeders demonstrate a preference for grass (e.g., impala [Aepyceros melampus], van Rooyen, 1992), others prefer browse (e.g., eland [Taurotragus oryx], Watson & Owen-Smith, 2000; nyala [Tragelaphus angasii], van Rooyen, 1992), and each shifts away from its preferred type when availability or quality of that type is insufficient to meet nutritional requirements (McNaughton & Georgiadis, 1986). The cues from forage that elicit a switch, and the environmental conditions that determine those cues, are central to understanding how herbivores respond adaptively to variation in food supply (Owen-Smith, 1982; du Toit, 1988).
The cues that signal a shift are linked to the nutritional quality of the forage, which is determined by characteristics of plant cells, season and differences between monocotyledonous and dicotyledonous plants (Codron, Lee-Thorp, Sponheimer, & Codron, 2007; Jarman, 1974; van Soest, 1994). Plant nutritional value depends on the proportion of more-digestible cell content to less-digestible cell wall in leaves and other plant parts (Demments & van Soest, 1985). Protein levels, fibre content, oils and resins in foliage all vary with forage maturity (Jarman, 1974; van Soest, 1994). In grasses, new leaf growth occurs at the beginning of each growing season and is triggered by increasing temperature and rainfall following the onset of the rains (Owen-Smith, 2008; Shorrocks, 2007). Thus, protein levels in savannah grasses peak in young swards during the early wet season, but an increase in structural fibre reduces digestibility as maturation progresses (Owen-Smith, 2008; Sinclair, 1975); exceptions are grasses growing on wet soils which retain low but acceptable protein contents, and new growth after fire which has high protein levels independently of the season (Scoones, 1995). In contrast, browse leaves grow in clusters continuously through the rainy season, such that some young browse foliage might be available when most grasses are mature and of relatively poor quality (Jarman, 1974). Browse species have higher soluble cell contents than grasses but also higher lignin content that lowers digestibility (Demment & van Soest, 1985) and defensive secondary metabolites which slow down digestive processes (Bryant et al., 1991).
The common eland (Taurotragus oryx) is a mixed-feeding large herbivore whose shift between browse- and grass-dominated diets occurs likely in response to local forage availability and seasonal changes in the cues in its forage. Selection of grasses versus browse in the seasonal diet of eland seems to be site-specific (Thouless, 2014; Venter & Kalule-Sabiti, 2016) and dependent on the availability of protein-rich and fibre-deficient forage (Field, 1975; Watson & Owen-Smith, 2000). Given the challenge for a large herbivore to acquire sufficient nutrition from a variable and generally poor food source, and the unique nature of this process for mixed-feeding large herbivores, our aim was to investigate the switching by eland between a grass-dominated diet and a browse-dominated diet. We tested the predictions that (a) eland would utilise dry grassland areas during the late wet season when grass was widely available, and concentrate on wet grassland and woodland areas during the dry season; (b) acceptance of grasses would be highest in the late wet season and eland would switch to woody browse species during the dry season as grass quality deteriorated; (c) eland would feed on a wide range of grass and browse species during the late wet season, but restrict their diet to those grasses and browse species that remained greenest during the dry season.
2 METHODS
2.1 Study area
Kgaswane Mountain Reserve (KMR, 35°43′S 27°11′E; 4,257 ha; 1,300–1,660 m a.s.l) is located in the north-western area of the Magaliesberg Mountain Range (North-West Province, South Africa; Figure 1). Mean annual rainfall is 682 mm (CV = 27%, calculated over 44 years; KMR Weather Station, 1,100 m a.s.l.). Eighty-eight per cent of precipitation falls during the wet season (October-April). Mean daily temperatures range from 9.7°C in July to 21.3°C in January. Soils are derived mostly from quartzitic sandstone (Carruthers, 2014). The topography varies between an elevated plateau and low-lying valleys (Carruthers, 2014; Wilson & Hirst, 1977). Surface water is available year-round (Nel, 2000).
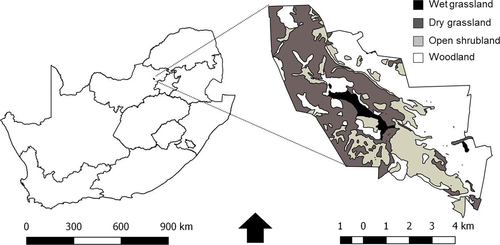
The reserve lies in the transition zone between the bushveld and the rocky highveld grassland biomes (Mucina & Rutherford, 2006). Four broad vegetation types occur in the study area: dry grassland, wet grassland or vlei, open shrubland and open woodland (Figure 1). Dominant grass species are Themeda triandra, Trachypogon spicatus, Loudetia simplex, Tristachya leucothrix and Hyparrhenia hirta (Nel, 2000). Reed beds of Phragmites australis characterise the wet grassland (Nel, 2000). Common woody species include Englerophytum magalismontanum, Zanthoxylum capense, Ancylobotrys capensis and Vangueria parvifolia in open shrubland, and Senegalia caffra and Protea caffra in woodland. Prescribed burning during the dry season has been implemented as a management tool since 1975, to remove dead plant material and stimulate grass growth (Nel, 2000; Parrini & Owen-Smith, 2010).
The eland population in KMR fluctuates between ~45 and ~120 individuals (Nel, Knoop, Seithlamo, & Tshenkeng, 2011). Other ungulates in the reserve include sable antelope (Hippotragus niger), plains zebra (Equus quagga), red hartebeest (Alcelaphus buselaphus), impala (Aepyceros melampus), blesbok (Damaliscus pygargus), waterbuck (Kobus ellipsiprymnus), greater kudu (Tragelaphus strepsiceros), warthog (Phacocoerus africanus), klipspringer (Oreotragus oreotragus) and reedbuck (Redunca sp) (Nel et al., 2011). Carnivorous mammals include black-backed jackal (Canis mesomelas), caracal (Felis caracal) and occasionally leopard (Panthera pardus).
2.2 Data collection
Eland were observed in March–April (wet season) and July–August (dry season) 2015. Observations were conducted at times of peak foraging activity in the morning (06:30–10:30) and afternoon (15:30–18:30). Observation focussed on adult females because they represented the reproductive segment of the eland population, and because males were expected to exhibit different foraging behaviour from adult females caused by sexual size dimorphism (Hillman, 1988). We defined a feeding site as the area where a herd or solitary adult female spent ≥5 min feeding. Because elands were easily frightened, we observed them from ≥50 m away with binoculars (Nikon Aculon 8x42, Tokyo, Japan). Feeding sites for the same focal herd were treated as independent samples when the entire herd clearly started a period of resting and/or ruminating of no less than three hours between two foraging bouts. Feeding sites for different herds were considered as independent samples. Individuals were considered as in different herds when they were ~500 m apart and in a social association presenting a clearly different age–sex structure from the one previously sampled during the same observation session. We discarded sites where other herbivore species were foraging near the focal herd, or when fresh hoof prints or fresh dung pellets of other species were found at the feeding site.
After the animals moved away from the feeding site, we confirmed that feeding had occurred through fresh bite signs on grasses or browse (Hensman, Owen-Smith, Parrini, & Bonyongo, 2014; van der Merwe & Marshal, 2012). Fresh bites were identified by their bright colour and lack of dried edges (O'Shaughnessy, Cain, & Owen-Smith, 2014). We noted the vegetation type (dry grassland, wet grassland, open shrubland, open woodland), and we placed a 1 m × 1 m quadrat at the location of the first identified bite and extended up to 2.5 m in height, encompassing the range of potential browse within reach of an adult eland (Underwood, 1975). Each quadrat therefore represented a feeding station, as the area accessible to a large antelope without moving its front feet (Novellie, 1978). We then placed eight additional quadrats per feeding site, either two quadrats per cardinal direction 3 m apart (Hensman et al., 2014) or along a feeding path 3 m apart (van der Merwe & Marshal, 2012). If we found no bite signs in the selected quadrats, we flipped them along the two main diagonals in the first arrangement (O'Shaughnessy et al., 2014) or along the path in the second arrangement (Hensman et al., 2014). The two sampling protocols were adopted in order to reflect, as accurately as possible, the plasticity in foraging behaviour of the eland, which tended to disperse over a large feeding area while grazing or browsing on forbs in open grassland, and to move in a single line along a feeding path when browsing in woodland.
Within each quadrat all plants were identified and categorised by growth form (Valeix et al., 2011): grass, herbaceous forb, woody forb (including creepers and shrublets), shrub (woody plants <3 m in height), tree (woody plants >3 m) and seedling (woody plants <30 cm). We identified plant species in the field with guidebooks (van Oudtshoorn, 1999; van Wyk & Wyk, 2002) or later with herbarium specimens. Species which could not be identified were assigned to a genus or growth form class only. We counted the number of bites per species within each quadrat, to a height of 2.5 m on woody plants (i.e., maximum reach of adult eland; Underwood, 1975). A bite was considered as the area of a grass tuft, or of a cluster of branches or leaves, covered by the closed fist of the observer (Hensman et al., 2014). Greenness, defined as the proportion of green versus brown leaves of each plant within a quadrat, was scored according to Walker's (1976) eight-point visual scale: 0; 1%–10%; 11%–25%; 26%–50%; 51%–75%; 76%–90%; 91%–99%; 100%.
2.3 Statistical analyses
We estimated the use of vegetation types by calculating the proportion of feeding sites in each vegetation type for each season. We estimated the availability of each grass species in each vegetation type as the number of sites in which a species was present, divided by the total number of feeding sites in that vegetation type for each season (Hensman et al., 2014; Owen-Smith & Cooper, 1987). We calculated the seasonal acceptance of plant species as the number of feeding sites in which a species was eaten, divided by the total number of feeding sites in which the species was present for each season (Owen-Smith & Cooper, 1987). Both availability and acceptance vary between 0 and 1, with species close to 0 regarded as uncommon (availability) or discarded (acceptance), and species approaching a value of 1 representing common species (availability) or favoured food resources (acceptance). We included only plant species present in ≥10 feeding sites in at least one season in the analyses. Because biomass per bite differs between grasses and browse, we calculated dietary contribution separately for monocotyledons and dicotyledons as the proportion of bites recorded for each species over the total number of bites across all monocots or dicots for each season (Hensman et al., 2014). We evaluated seasonal changes in dietary contribution for each species with one-way chi-square tests of independence. We calculated a greenness value for each plant species by averaging the mid-point greenness category for each species across all quadrats containing that species for each feeding site and each season. Analyses were conducted in R 3.2.2 (R Development Core Team).
3 RESULTS
A total of 150 feeding sites were sampled over the entire study period (wet season: n = 80; dry season: n = 70). Eland feeding sites were found in all vegetation types in all seasons, but the occupancy of the woodland vegetation type increased from 37% in the wet season to 52% in the dry season, and the use of dry grassland decreased from 24% to 11%. The proportion of sites in open shrubland and wet grassland remained similar across the two seasons (19% vs. 20% and 20% vs. 17%, respectively). We recorded 56 species of grasses and 120 different species of browse in the feeding sites. Of these, 21 species of browse occurred in ten or more feeding sites in at least one of the seasons. Senegalia caffra, Lippia javanica, Searsia pyroides, Solanum sp. and Tagetes minuta occurred mostly in woodland (Table 1). Shrubs and small trees, like Vangueria parvifolia, were common in open shrubland but not in other vegetation types. The most available woody species on wet grassland was an invasive forb, Verbena bonariensis (Table 1). Among grasses, 11 species plus the Eragrostis genus and sedges were encountered in more than ten feeding sites in at least one of the season. Eragrostis sp. was common in all vegetation types, while Themeda triandra occurred in all vegetation types except wet grassland (Table 2). Loudetia simplex and Tristachia leucothrix had greatest availability in open shrubland and dry grassland, Cymbopogon sp. was typically found in wet grassland, and Setaria sphacelata was common only in wooded areas (Table 2).
| Dicot species | Vegetation-specific availability | |||
|---|---|---|---|---|
| Woodland | Open shrubland | Dry grassland | Wet grassland | |
| Ancylobotrys capensis | 0.12 | 0.54 | 0.25 | 0.00 |
| Diospyros lycioides | 0.28 | 0.11 | 0.11 | 0.28 |
| Dombeya rotundifolia | 0.29 | 0.07 | 0.00 | 0.00 |
| Englerophytum magalismontanum | 0.09 | 0.39 | 0.07 | 0.00 |
| Faurea saligna | 0.26 | 0.00 | 0.11 | 0.07 |
| Ferns | 0.17 | 0.25 | 0.04 | 0.34 |
| Herbaceous forbs | 0.58 | 0.54 | 0.71 | 0.72 |
| Halleria lucida | 0.22 | 0.04 | 0.00 | 0.03 |
| Lippia javanica | 0.63 | 0.07 | 0.14 | 0.28 |
| Parinari capensis | 0.14 | 0.25 | 0.43 | 0.00 |
| Senegallia caffra | 0.31 | 0.07 | 0.00 | 0.00 |
| Sersia pyroides | 0.37 | 0.14 | 0.00 | 0.10 |
| Solanum sp | 0.34 | 0.29 | 0.18 | 0.14 |
| Tagetes minuta | 0.43 | 0.25 | 0.07 | 0.10 |
| Vangueria parvifolia | 0.09 | 0.50 | 0.11 | 0.00 |
| Verbena bonariensis | 0.05 | 0.07 | 0.07 | 0.66 |
| Woody forbs | 0.55 | 0.36 | 0.50 | 0.48 |
| Zisiphus mucronata | 0.25 | 0.07 | 0.11 | 0.07 |
| Grass species | Vegetation type-specific availability | |||
|---|---|---|---|---|
| Woodland | Open shrubland | Dry grassland | Wet grassland | |
| Aristida sp. | 0.11 | 0.25 | 0.39 | 0.31 |
| Cymbopogon sp. | 0.15 | 0.50 | 0.29 | 0.41 |
| Cynodon dactylon | 0.15 | 0.18 | 0.25 | 0.17 |
| Eragrostis sp. | 0.52 | 0.71 | 0.82 | 0.59 |
| Hypperhenia hirta | 0.11 | 0.18 | 0.07 | 0.41 |
| Hypertelia dissoluta | 0.20 | 0.07 | 0.07 | 0.21 |
| Loudetia simplex | 0.20 | 0.43 | 0.57 | 0.03 |
| Panicum maximum | 0.20 | 0.04 | 0.00 | 0.03 |
| Schozachyrium sanguineum | 0.18 | 0.46 | 0.32 | 0.07 |
| Setaria sphacelata | 0.42 | 0.11 | 0.25 | 0.24 |
| Themeda triandra | 0.40 | 0.54 | 0.64 | 0.17 |
| Trachypogon spicatus | 0.38 | 0.36 | 0.36 | 0.10 |
| Tristachya leucothrix | 0.34 | 0.46 | 0.64 | 0.03 |
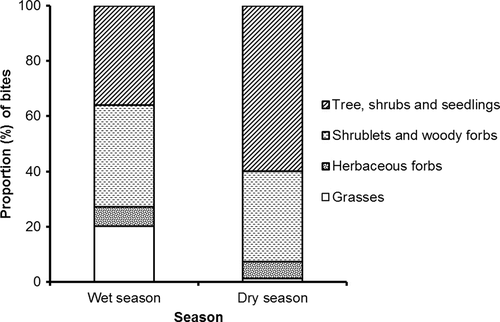
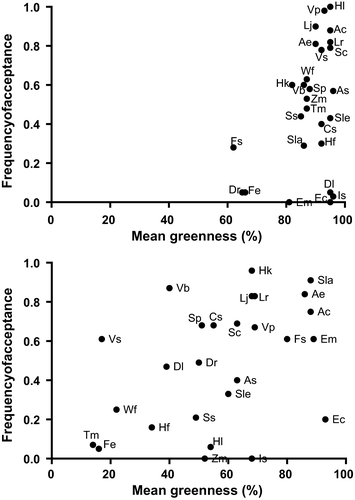
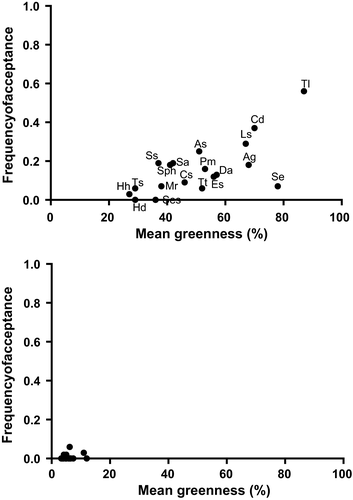
The contribution of shrublets, dwarf shrubs and woody forbs to the eland diet was relatively similar across the two seasons (37% vs. 33% of total bites), while the proportion of shrubs, seedlings and trees increased by 26% from the wet to the dry season (36% to 60%; Figure 2). Eland fed on 54 dicot species during the wet season and on 64 species during the dry season. Almost half of the diet (44% of bites) during the wet season consisted of four highly accepted (>0.81) woody species (Ancylobotrys capensis, Athrixia elata, L. javanica and V. parvifolia) that also had high greenness (Figure 3). Of these, A. capensis and V. parvifolia decreased in the diet (A. capensis: 9%–2%, χ2 = 108.59, df = 1, p = <0.01; V. parvifolia: 11%–3%, χ2 = 139.85, df = 1, p = <0.01; Table 3) and showed decreasing acceptance in the dry season with decreasing greenness (Figure 3). Lippia javanica and A. elata had high acceptance in both seasons because they retained green leaves (Figure 3), despite a lowered contribution to the dry season diet (A. elata: 8%–4%, χ2 = 38.92, df = 1, p = <0.01; L. javanica: 16%–10%, χ2 = 42.13, df = 1, p = <0.01; Table 1). In contrast, Searsia lancea and Helichrysum kraussii were rarely eaten during the wet season (0.2% and 1% of bites, respectively) but they became the most common species in the dry season (S. lancea: 11%, χ2 = 462.21, df = 1, p = <0.01; H. kraussii: 12%, χ2 = 305.16, df = 1, p = <0.01; Table 3) having ≥70% green leaves (Figure 2). Herbaceous forbs constituted a small but constant proportion of the wet season diet, especially Vernonia sp. which retained green leaves during the dry season and showed moderate acceptance in both seasons (Figure 3, Table 3).
| Dicot species | Seasonal availability | Seasonal dietary contribution | ||
|---|---|---|---|---|
| Wet season | Dry season | Wet Season | Dry season | |
| Ancylobotrys capensis | 0.08 | 0.03 | 0.09 | 0.02 |
| Asparagus sp | 0.03 | 0.02 | 0.01 | 0.00 |
| Athrixia elata | 0.18 | 0.05 | 0.08 | 0.04 |
| Combretum sp | 0.01 | 0.05 | 0.01 | 0.05 |
| Diospyros lycioides | 0.03 | 0.06 | 0.00 | 0.03 |
| Dombeya rotundifolia | 0.03 | 0.06 | 0.00 | 0.02 |
| Englerophytum magalismontanum | 0.02 | 0.03 | 0.00 | 0.04 |
| Euclea crispa | 0.001 | 0.02 | 0.00 | 0.00 |
| Faurea saligna | 0.03 | 0.04 | 0.00 | 0.03 |
| Ferns | 0.08 | 0.03 | 0.00 | 0.00 |
| Herbaceous forbs | 0.28 | 0.07 | 0.04 | 0.01 |
| Halleria lucida | 0.02 | 0.03 | 0.01 | 0.00 |
| Helichrysum kraussii | 0.03 | 0.14 | 0.01 | 0.11 |
| Indigofera sp | 0.05 | 0.01 | 0.00 | 0.00 |
| Lantana rugosa | 0.04 | 0.01 | 0.02 | 0.01 |
| Lippia javanica | 0.12 | 0.13 | 0.16 | 0.10 |
| Searsia lancea | 0.01 | 0.07 | 0.00 | 0.12 |
| Searsia lepodyctia | 0.01 | 0.03 | 0.00 | 0.01 |
| Searsia pyroides | 0.05 | 0.06 | 0.03 | 0.04 |
| Senegalia caffra | 0.03 | 0.05 | 0.02 | 0.03 |
| Solanum sp | 0.09 | 0.06 | 0.03 | 0.01 |
| Tagetes minuta | 0.06 | 0.04 | 0.01 | 0.00 |
| Vangueria parvifolia | 0.08 | 0.03 | 0.11 | 0.03 |
| Verbena bonariensis | 0.08 | 0.12 | 0.03 | 0.04 |
| Vernonia sp | 0.06 | 0.07 | 0.04 | 0.02 |
| Woody forbs | 0.28 | 0.06 | 0.11 | 0.01 |
| Ziziphus mucronata | 0.04 | 0.01 | 0.02 | 0.00 |
Note
- Chi-squared tests were used to compare differences in dietary contribution and availability between seasons. Bold numbers indicate comparisons that were significant at p < 0.05. Availability = the number of samples (grouped morning and afternoon foraging sites) where a species was present divided by the total number of samples for all vegetation types. Dietary contribution = the number of bites recorded from each species divided by the total number of bites recorded across all species in each season.
Bites on grasses were 20% of total bites during the wet season, but only 1% during the dry season (Figure 2). During the wet season, grasses were a dominant food item on green burns (47% of bites) but had a lower contribution (7%) on burnt areas that did not produce green flush and on unburnt areas. The dominant grass in the diet was T. leucothrix, the second most available and the greenest grass in the wet season (Table 4, Figure 4). Grasses in the dry season were almost entirely brown and were avoided (Table 4, Figure 4).
| Species | Seasonal availability | Seasonal dietary contribution | ||
|---|---|---|---|---|
| Wet season | Dry season | Wet season | Dry season | |
| Andropogon gayanus | 0.05 | 0.00 | 0.02 | 0.00 |
| Aristida spp | 0.07 | 0.02 | 0.05 | 0.00 |
| Cymbopogon sp | 0.14 | 0.05 | 0.04 | 0.00 |
| Cynodon dactylon | 0.05 | 0.05 | 0.05 | 0.04 |
| Diheteropogon amplectens | 0.03 | 0.00 | 0.01 | 0.00 |
| Eragrostis sp | 0.37 | 0.16 | 0.07 | 0.08 |
| Hyparrhenia hirta | 0.05 | 0.11 | 0.00 | 0.00 |
| Hypertelia dissoluta | 0.04 | 0.03 | 0.00 | 0.00 |
| Loudetia simplex | 0.10 | 0.10 | 0.04 | 0.04 |
| Melinis repens | 0.04 | 0.01 | 0.00 | 0.00 |
| Panicum maximum | 0.03 | 0.01 | 0.01 | 0.00 |
| Schizachyrium sanguineum | 0.04 | 0.12 | 0.01 | 0.00 |
| Sedge | 0.06 | 0.03 | 0.02 | 0.00 |
| Setaria sp | 0.05 | 0.02 | 0.00 | 0.00 |
| Setaria sphacelata | 0.10 | 0.06 | 0.04 | 0.00 |
| Sporobolus africanus | 0.04 | 0.08 | 0.02 | 0.00 |
| Themeda triandra | 0.13 | 0.13 | 0.01 | 0.00 |
| Trachypogon spicatus | 0.05 | 0.15 | 0.01 | 0.00 |
| Tristachya leucothrix | 0.22 | 0.18 | 0.53 | 0.77 |
Note
- Chi-squared tests were used to compare differences in dietary contribution and availability between seasons. Bold numbers indicate comparisons that were significant at p < 0.05. The dry season sample size was too small to perform any statistical comparison. Availability = the number of samples (grouped morning and afternoon foraging sites) where a species was present divided by the total number of samples for all vegetation types. Dietary contribution = the number of bites recorded from each species divided by the total number of bites recorded across all species in each season.
4 DISCUSSION
Eland demonstrated clear shifts in dietary use between the wet and the dry season, moving from a diet relatively high in grasses in the wet season to one dominated almost entirely by browse, as greenness of grass (a cue to its nutritional quality) decreased. Coincident with this dietary shift was a change in vegetation types where eland foraged. The small areal extent of KMR appeared not to constitute a limiting factor for the foraging requirements of eland, providing draught-buffering resources thanks to its variety of plant species and vegetation communities (Nel, 2000).
Eland concentrated foraging activities in woodland, where a staple browse species (L. javanica) was available year-round; however, they increased their use of dry grassland during the wet season, when green grass regrowth was available on burnt areas. The diet of eland in KMR was dominated by browse species, such as V. parvifolia, which were among the greenest available during the wet season. Species that were highly accepted in the wet season, but retained green leaves into the dry season, remained highly accepted but decreased in the diet. Furthermore, eland switched to evergreen trees and shrubs such S. lancea and H. kraussii, which were avoided in the wet season. Eland in the Zimbabwean Lowveld show a similar pattern by browsing on woody plants that offer the greatest amount of green leaves, shifting to less-palatable species when they produced new growth (Kerr, Wilson, & Roth, 1970). Greater kudu in Nylsvley Nature Reserve, South Africa, also increase the consumption of evergreen Searsia species as the dry season progresses (Owen-Smith & Cooper, 1987), a species which might be important food during the limiting dry season. The two shrublets L. javanica and A. elata were more than 10% of the diet in both seasons and were highly available and very green. Lippia javanica was also commonly used by eland in the central highlands of Kenya (Hillman, 1979) and in the Suikerbosrand Nature Reserve, South Africa (Wallington, McKechnie, Owen-Smith, & Woodborne, 2007). Herbaceous forbs were consumed by eland in both seasons. In the dry season, forbs consumption was mainly restricted to V. bonariensis, an invasive weed growing on wet bottomlands when other species were mostly dormant. Selection for alien invasive plants that contain aromatic oils has been observed for common eland (Fabricius, 1989; Hillman, 1979) and for Lord Derby's eland (Tragelaphus derbianus) in the Sudano-Sahelian and Guinean savannahs (Graziani & D'Alessio, 2004; Hejcmanova, Homolka, Antonínová, Hejcman, & Podhájecká, 2010). Grasses contributed substantially to eland diet during the wet season only when eland used burnt dry grassland areas. The bulk of grazing was mainly T. leucothrix, a grass of low nutritional quality (van Oudtshoorn, 1999). Grasses of low nutritional quality are eaten by buffalo, Syncerys caffer (Field, 1975) and sable antelope, Hippotragus niger (Parrini, 2006) when green growth is available on burnt patches.
The importance of grasses to the diet of eland, and the cues that trigger a shift from grazing to browsing during the early dry season, is poorly understood (Thouless, 2014). Diets of eland in East Africa contain 20%-45% grass (Field, 1975). Eland in South Africa, however, have mostly browse-dominated diets (Codron et al., 2007; Sponheimer et al., 2003; Wallington et al., 2007; Watson & Owen-Smith, 2000), with grazing during the wet season on burnt areas (Kelso, 1986; Rowe-Rowe, 1982). Wallington et al. (2007) predicted that eland of the East African plateau would have more grasses in their overall diets compared with eland elsewhere because of the extent of grasslands in this region (Wronski, 2002). D'Ammando, Parrini, Attorre, and Boitani (2015) proposed a similar explanation for eland dry season grass preference in KMR because dry grassland is the main vegetation type in that reserve (Nel, 2000). However, our results suggest that the switch to grazing is rather influenced by the phenophase of the grass sward, which in turn is affected by vegetation structure, rainfall and fire (Archibald, Bond, Stock, & Fairbanks, 2005; Sinclair, 1975). Differences in diet between years at KMR might indicate that eland can take advantage of local patterns of forage quality and availability. This is likely through consuming grasses and foliage of deciduous species when high wet season rainfall contributes to the retention of green leaves into the dry months (D'Ammando et al., 2015) and through expanding the diet to include low-palatability evergreens during drought conditions as observed in this study. Bimodal seasonal rainfall in East Africa allows for more continuous growth of green grass leaves and therefore might also contribute to the higher availability and intake of grasses compared to southern Africa. Differences in switching behaviour by eland in different regions thus could be influenced by site-specific environmental conditions that affect changes in forage greenness and nutritional quality, as well as the cues that signal these changes.
ACKNOWLEDGEMENTS
Financial support was provided by the National Research Foundation (NRF) of South Africa (grant 76584 to JPM) and the University of the Witwatersrand. Logistic support was provided by North West Parks and Tourism Board, and we are particularly indebted to Piet Nel, Phenya Tshenkeng, and all Kgaswane Mountain Reserve staff for making this study possible.


