Modelling the distribution of a potential invasive tropical fern, Cyclosorus afer in Nigeria
Abstract
enIn this study, we predicted the distribution of Cyclosorus afer in Nigeria using the Maximum Entropy (Maxent) technique. We used 95 occurrence points in one State to extrapolate its spread in other States in Nigeria. Three sites of sizes 500 × 500 m2 separated by minimum distance of 1,000 m2 were sampled in the study area. Seven bioclimatic and elevation variables were selected for the model. Maxent model was run using standard settings with 70% of the occurrence data as training and remaining 30% as test data. The result showed that Maxent performed better than random prediction due to the area under curve for receiver operating characteristics of training (0.990) and test data (0.987) closer to 1. The sensitivity of the Maxent model for occurrence data of C. afer was found to be 100%. The model predicted higher probability of occurrence covering an area of 26019.11 km2 in 4 States of Nigeria. Jackknife evaluation of the model revealed that the environmental predictors of C. afer in Nigeria are annual mean temperature, mean temperature of driest quarter, precipitation seasonality, Precipitation of driest quarter and precipitation of coldest quarter. These variables all showed higher gain and contributions to the model.
Résumé
frDans cette étude, nous avons prédit la distribution de Cyclosorus afer au Nigéria en utilisant la technique d'entropie maximale (Maxent). Nous avons utilisé 95 points d'occurrence dans un État pour extrapoler sa propagation dans d'autres États du Nigéria. Trois sites de tailles 500 × 500 m2 séparés par une distance minimale de 1,000 m2 ont été échantillonnés dans la zone d'étude. Les variables des sept bioclimatiques et d'altitude ont été sélectionnées pour le modèle. Le modèle Maxent a été géré à l'aide de paramètres standards avec 70% des données comme une formation et 30% restantes comme des données de test. Les résultats ont montré que Maxent a mieux réussi que la prédiction au hasard en raison de la surface sous courbe pour la fonction d'efficacité du récepteur pour l'entraînement (0.990) et aux données de test (0.987) plus proches de 1. La sensibilité du modèle Maxent aux données d'occurrence de C. afer s'est avérée être de 100%. Le modèle a prédit une probabilité d'occurrence plus élevée couvrant une superficie de 26019.11 km2 dans 4 États du Nigéria. L'évaluation Jackknife du modèle a révélé que les prédicteurs environnementaux de C. afer au Nigéria sont la température moyenne annuelle, la température moyenne du trimestre le plus sec, la fluctuation saisonnière des précipitations, les précipitations du trimestre le plus sec et les précipitations du trimestre le plus froid. Ces variables ont toutes montré un gain et une contribution plus élevés au modèle.
1 INTRODUCTION
The distribution patterns of plant species in areas where they maintain stable populations are determined by distinct ecological factors (Araujo & Guisan, 2006). As a result of this, the use of ecological niche-based modelling, which incorporates species distribution data with environmental factors, is necessary for accurate predictions of habitats suitable for the spread of invasive plant species (Peterson & Vieglais, 2001). These species distribution models usually predict the probability of occurrence of a species in a particular location. They may also estimate the probability of future establishments of such plant species in that location (Ficetola, Thuiller, & Miaud, 2007). Environmental variables have been used as useful predictors of the establishments of invasive plants species in new geographical locations (Kilroy, Snelder, Floerl, Vieglais, & Dey, 2008; Zambrano, Martinez-Meyer, Menezes, & Peterson, 2006).
Also, prediction of the distribution of invasive plant species could be very challenging as the behaviour of most individual invasive plants varies with respect to different sites invaded (Ricciardi & Kipp, 2008). The measure of the impacts of invasive species is a function of the abundance and population density in the sites invaded. However, ecological factors that drive the abundance of invasive plant species may be different from those responsible for the occurrence in such locations (Heinanen, Ronka, & Numers, 2008). This is why predicting the probability of occurrence and distribution patterns of invasive species in invaded areas is preferable in assessing invasion risks.
There has been successful mapping of the distribution of a lot of plant species together with their ecosystems, and other environmental factors enhancing invasions such as bioclimatic conditions using integrated geographical information system (GIS) and satellite remote sensing techniques (Haltuch, Berkman, & Garton, 2000; Stow et al., 2000). It is mostly impossible to get reliable data on the absence of a species in a habitat due to a lot of limitations in field samplings. Therefore, reliable species distribution models prefer to make use of presence data only (Anderson, 2003). Control and eradication of invasive species are however difficult and costly and often impracticable when an invasion has already progressed too far. Hence, early detection and reliable prediction of areas at risk of invasion are of primary concern.
Cyclosorus afer (Christ) Ching also known as Pneumatopteris afra (Christ) Holttum has been reported as a widely spread fern in many countries in Africa such as Cameroon, Ghana, Liberia and Sierra Leone (Mazumdar, 2013), Gabon (Mundy, 2000), Equatorial Guinea (Velayos et al., 2013), Togo (Abotsi, Kokou, Dubuisson, & Rouhan, 2018). Its occurrence and widespread abundance has been reported in Nigeria after it was introduced in the early 1960s as an ornamental plant. This fern has the ability to grow fast and colonise wetlands easily due to its adaptation to different soil conditions in Nigeria (Oloyede, Aponjolosun, & Ogunwole, 2011). It has been widely distributed and has colonised most wetlands in North Central (Akomolafe, Oloyede, & Chuk, 2017; Akomolafe & Sulaimon, 2018) and South Western Nigeria (Awodoyin et al., 2013). Its colonisation of wetlands has led to mechanical obstruction of water and poses threats to the survival of aquatic animals and native plants.
Despite the visual observations of its occurrence and widespread occurrence in some parts of Nigeria, there are still paucity of data and a lot of gaps in its ecological studies and prediction of environmental factors responsible for its colonisation. We used a distribution modelling approach to predict the environmental suitability of this plant in Nigeria as an awareness creation for its potential invasiveness in the areas affected. Most times, ecologists have ignored ferns as invasive plants. Recent studies have shown that ferns have proved to be stubborn invaders of some regions of the world and are very difficult to control if not detected early (Akomolafe & Rahmad, 2018). This study is more like a first detection of the invasive ability of this plant, after observing its recent spread in Nigeria. Therefore, this study predicted the environmental factors suitable for its occurrence and distribution in Nigeria using a machine learning maximum entropy (Maxent) as the species niche model.
2 MATERIALS AND METHODS
2.1 Study area
The study was carried out at Lafia, Nasarawa State, Nigeria. Lafia is the capital city of Nasarawa State and lies between latitude 8°25′40°N to 8°34′15°N and longitude 8°24′25°E to 8°39′19°E in the Guinea savannah region of North-Central Nigeria. Mean annual rainfall ranges from 1,000 to 1,500 mm and annual growing period of about 200–300 days. Rainy season occurs in Lafia from early May to late September, while dry season occurs from October to April of the following year. The mean annual temperature ranges between 21.6 and 31.5°C.
2.2 Sampling site/plant collection
A total of three wetlands invaded by C. afer were chosen as sampling sites in Lafia, Nigeria. Each site has an area of 500 m × 500 m demarcated for the study. Each site is separated from the other by a minimum distance of 1 km. We used the occurrence data of C. afer in Lafia to predict its occurrence and distribution in other parts of Nigeria.
2.3 Spatial data mapping and distribution modelling
2.3.1 Occurrence data
The presence data for C. afer was taken on the field during the peak of the growing season between August and December (4 months) through georeferencing. The geographical points of occurrence within each invaded sites were taken with a Garmin Etrex 10 GPS device along multiple 200 m transects. A minimum distance of 20 m between each point was maintained at each site. A total of 95 occurrence points was recorded in all the invaded sites.
2.3.2 Selected environmental variables
The environmental variables used for the species distribution modelling included the bioclimatic and elevation variables. We decided to use the bioclimatic variables because the occurrence and distribution of ferns are generally influenced by microclimatic conditions especially light intensity, temperature and humidity in their respective habitats (Othman, Latiff, Tukiman, & Hashim, 2015). Therefore, we based our model on general reports that bioclimatic factors do influence the productivity of plant species in an environment and also influence their distributions at local and global scales (Gogol-Prokurat, 2011; Lennon, Greenwood, & Turner, 2000). These bioclimatic variables were derived to explain seasonal variations in climatic factors relating to the physiology of plant species (Hijmans, 2004). They represent annual trends, seasonality and limiting environmental factors (Table 1). Bioclimatic variables were taken from the WorldClim version 2.0 dataset (Hijmans, Phillips, Leathwick, Elith, & Hijmans, 2017). Elevation data were obtained from the global digital elevation model at USGS Earth Explorer. All these variables which were obtained at the same spatial resolution of 30 arc seconds were later converted into raster layers using ArcGIS 10.2.1. Due to potential multicollinearity among these preselected 20 bioclimatic and elevation variables, we extracted the values using sample extraction tool of ArcGIS 10.2.1 and tested for multicollinearity using linear regression in IBM SPSS version 24. High correlations among variables usually affect the performance of distribution models (Lai, 2009). Variables with variance inflation factor (VIF) greater than 10 were removed from the model. After multicollinearity analysis, seven bioclimatic and elevation variables were used as environmental predictors in the Maxent model (Table 2). These in association with the species occurrence data were later converted into ASCII format for further analysis.
| S/N | Code | Description |
|---|---|---|
| 1 | Bio1 | Annual mean temperature |
| 2 | Bio2 | Mean diurnal range (mean of monthly (maximum temperature – minimum temperature) |
| 3 | Bio3 | Isothermality (bio2/bio7 × 100) |
| 4 | Bio4 | Temperature seasonality |
| 5 | Bio5 | maximum temperature of warmest period |
| 6 | Bio6 | Minimum temperature of coldest period |
| 7 | Bio7 | Temperature annual range (bio5-bio6) |
| 8 | Bio8 | Mean temperature of wettest quarter |
| 9 | Bio9 | Mean temperature of driest quarter |
| 10 | Bio10 | Mean temperature of warmest quarter |
| 11 | Bio11 | Mean temperature of coldest quarter |
| 12 | Bio12 | Annual precipitation |
| 13 | Bio13 | Precipitation of wettest period |
| 14 | Bio14 | Precipitation of driest period |
| 15 | Bio15 | Precipitation seasonality (Coefficient of Variation) |
| 16 | Bio16 | Precipitation of wettest quarter |
| 17 | Bio17 | Precipitation of driest quarter |
| 18 | Bio18 | Precipitation of warmest quarter |
| 19 | Bio19 | Precipitation of coldest quarter |
| S/N | Code | Description |
|---|---|---|
| 1 | Elevation | Elevation |
| 2 | Bio1 | Annual mean temperature |
| 3 | Bio15 | Precipitation seasonality (Coefficient of Variation) |
| 4 | Bio17 | Precipitation of driest quarter |
| 5 | Bio18 | Precipitation of warmest quarter |
| 6 | Bio19 | Precipitation of coldest quarter |
| 7 | Bio9 | Mean temperature of driest quarter |
2.3.3 Spatial resolution adjustment
The resolution of species occurrence data and all the selected environmental variables were adjusted to be the same. This was done by using the “feature to point” tool of the ArcGIS software.
2.3.4 Species distribution modelling
The Maxent (maximum entropy) model was used to develop a dynamic species niche model for C. afer in the entire Nigeria using the occurrence points in Lafia and the selected environmental variables. Maxent was chosen because it has been tested and confirmed by researchers as a reliable predictive model that makes use of few presence data collected in a relatively small area and without considering the absence records (Guisan et al., 2007; Phillips, Anderson, & Schapire, 2006; Wisz et al., 2008). Maxent is able to estimate the probability distribution of species. The principle of operation of Maxent is estimating species niche by discovering the distribution of probabilities that is closest to maximum entropy (uniform) from sets of species occurrence and environmental variables (Phillips et al., 2006, Elith et al., 2011).
In order to achieve this, Maxent 3.4.1 software was used. This software has the potential of using many and diverse environmental data which may either be continuous or categorical. It is also able to produce reliable models whose outputs will indicate the role played by each variable in the model. The species occurrence data (comprising the latitude and longitude) were saved as point data in MS Excel format and were divided into training and testing point proportions. 70% of the data was used as training data while the remaining 30% was used as test data. The environmental variables which have been adjusted to the same cell size and geographical boundary were imputed into the model as ASCII format.
2.4 Assessment of environmental variables contributions
After the modelling process has finished, the individual importance or contribution of each environment variable was determined using the Jackknife test in the Maxent software. The Jackknife did this by removing each environmental variable out of the model one by one and running the model using other variables. It also ran a model using only the removed variable alone.
2.5 Evaluation of the model

3 RESULTS
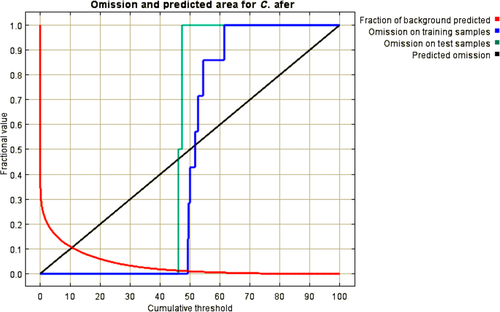
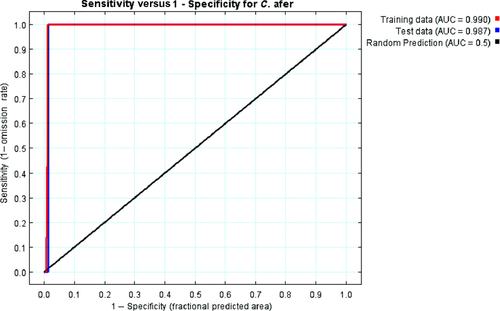
The result of the omission/commission rate, which was analysed based on omission and predicted areas of invasion of C. afer in Nigeria, is shown in Figure 1. This is a threshold dependent binomial test whereby omission rate represents the proportion of the test data that is captured in the pixels not predicted as suitable for C. afer whereas predicted area is regarded as the proportion of all the pixels predicted as suitable for C. afer. The omission rate for both training and test data is 0. The receiver operating characteristics (ROC) curve compared the Maxent prediction to random prediction. The area under curve (AUC) for random prediction is 0.5 while those of training and test data are 0.990 and 0.987, respectively (Figure 2).
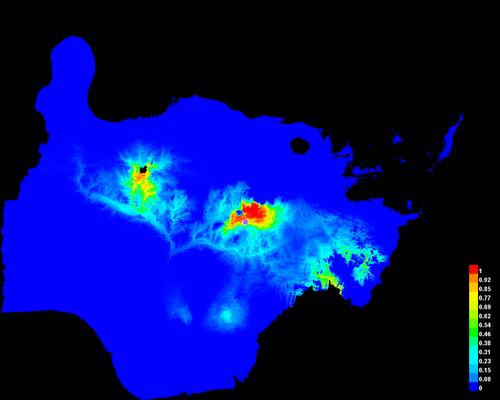
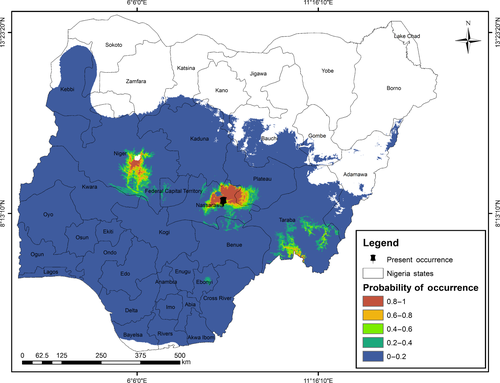
It was observed that all the sample presence points are located in the areas of high probability of occurrence predicted by Maxent (Figure 3). In this Figure 3, warmer colours show areas with better-predicted conditions. White dots show the presence locations used for training, while violet dots show test locations. The correctly predicted points by Maxent were 95 while the observed presence points were 95 (see Appendix 1). Therefore, the sensitivity of the Maxent model for local occurrence data of C. afer is 100%. The predicted spatial extent of C. afer in Nigeria is between 8°10′10″–10°17′14″ N and 5°5′0″–13°18′12″E (Figure 4). As shown in Figure 4, areas in red indicated areas with very high probability of occurrence of C. afer while those in blue indicated areas with very low probability of occurrence. Our local occurrence data of C. afer indicated in black is found within the region of very high probability of occurrence. The total area predicted to have high probability of occurrence of C. afer in Nigeria was found to be approximately 11,846 Km2 in Niger State, 5262.72 Km2 in Nasarawa State, 3445.32 Km2 in Plateau State and 5465.07 Km2 in Taraba State (Figure 4). All the affected States are within the North-Central part of Nigeria.
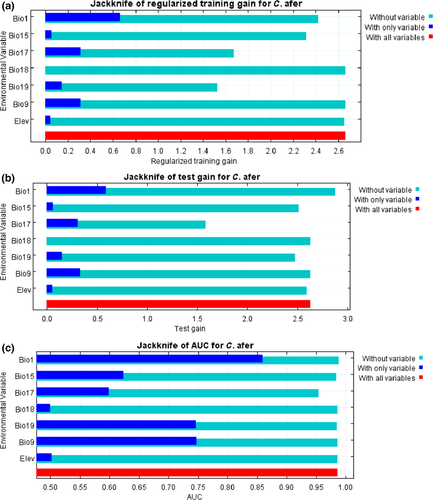
The environmental variable with highest gain when used in isolation is bio1, that is annual mean temperature, which therefore appeared to have the most useful information by itself. The environmental variable that decreases the gain the most when it is omitted is bio19, that is precipitation of coldest quarter (Figure 5a,b). The variable which did not produce any gain is precipitation of warmest quarter. The most important environmental variables regarded as predictors of distribution of C. afer in Nigeria are annual mean temperature (bio1), mean temperature of driest quarter (bio9), precipitation seasonality (bio15), Precipitation of driest quarter (bio17) and precipitation of coldest quarter (bio19). These predictor variables have AUC greater than 0.5 (Figure 5c).
4 DISCUSSION
The model accuracy range was described using the following scale: 0.9–1.0 as high accuracy, 0.7–0.9 as good accuracy, 0.5–0.7 as low accuracy and less than 0.5 as a poor model performance (Anderson et al., 2003). It is clear from this result that the Maxent prediction of both training and test data are higher than random prediction. This is explained by the higher area under curve (AUC) of the Maxent predictions which are closer to 1. This shows that the model is highly sensitive and accurate (Anderson et al., 2003) and also indicates that this model is able to correctly project the occurrence of C. afer in this region. A model with such high sensitivity has been described as very suitable for the prediction of invasive plant species (Thompson et al., 2011). C. afer can be referred to as a species having smaller geographical range with extreme environmental tolerance due to the high accuracy of the model. Usually, lower model accuracy has been attributed to species having broad geographical ranges and environmental tolerances (Elith et al., 2006; Thuiller, Lavorel, & Araújo, 2005).
Considering the distribution probability of C. afer in Nigeria, most of the areas with high probability of occurrence are located in places mostly occupied by different kinds of wetlands. This indicates the extent of present and future threats posed by C. afer on aquatic biodiversity of this area. This could also be a serious concern for farmers who engage in irrigation and wetland farming during the dry season in this study area due to the massive growth of C. afer preventing normal flow of water. As reported by Jimenez-Valverde et al. (2011) and Rameshprabu and Swamy (2015), confirmation of model-predicted probability of occurrence through ground check of the areas is necessary for validation of accuracy. Therefore, the areas predicted for occurrence of C. afer were visited and found to have some occurrence of C. afer. Furthermore, the predicted spread and the geographical area covered by this plant in four different States of Nigeria should be a serious concern to ecologists and conservationists. From the model, Niger State has the highest potential for invasion of C. afer followed by Taraba State and Nasarawa State, according to the predicted area of coverage.
The environmental variables selected by this model as predictors of distribution of C. afer are mostly temperature and rainfall variables. They are categorised as variables representing annual trends, seasonality and limiting environmental factors (Rameshprabu & Swamy, 2015). These variables have been described as having direct influences on invasive species distributions (Austin, 2007). According to the model, the probability of occurrence of C. afer increases with increase in annual mean temperature, mean temperature of driest quarter, precipitation seasonality and precipitation of coldest quarter. Some of these predictors of C. afer explain the distribution of a species as being affected by ranges of extreme environmental conditions within a year (O'Donnell & Ignizio, 2012).
This model showed that the probability of presence of C. afer decreases with increase in precipitation of driest quarter (i.e. total amount of rainfall in January, February and March) and elevation in the predicted areas. This can also be regarded as a limiting or extreme environmental factor predicting the distribution of C. afer in the Nigeria. All these factors directly explain the tolerance of C. afer to heat and drought stress (Austin, 2007). Considering the biology and ecology of this plant, our model has accurately justified its environmental predictors. Cyclosorus afer has never been reported to be found in areas of high elevation in Nigeria. More so, its widespread in these regions considered to be subhumid or savannah in Nigeria, means that it is very tolerant to heat and drought stress.
5 CONCLUSION
Maxent model for prediction of distribution and probability of occurrence of C. afer in Nigeria has been proved to be accurate compared to random predictions. The environmental variables regarded as predictors of distribution of C. afer have clearly indicated that the plant has a narrow geographical range and is influenced by extreme environmental conditions. Areas with such environmental conditions are likely to be invaded in other parts of Africa and entire world. This research has shown the early detection of invasive potential of this fern in Nigeria. Our interviews with the indigenous people of the study area revealed that this plant has been a problem to local fishing and wetland farming as it grows all-through the year. Therefore, awareness and appropriate control measures need to be implemented early as the high probability of occurrence has been predicted in most wetlands, suburbs and agricultural production areas of North-Central Nigeria.
ACKNOWLEDGEMENTS
The authors hereby acknowledge the immense contribution of Dr. Shomboro D.K. of National Center for Remote Sensing, Jos, Nigeria towards the success of the modelling. This study was funded by Nigerian Government Tertiary Education Trust Fund (TETFund) ASTD PhD Grant (FUL/REG/TETfund/002/VOL.II/182).
APPENDIX A
SPECIES OCCURRENCE DATA OF CYCLOSORUS AFER IN LAFIA, NIGERIA
| S/N | Latitude (N) | Longitude (E) | Elevation (m) |
|---|---|---|---|
| 1 | 8.56640 | 8.55082 | 149 |
| 2 | 8.56627 | 8.55093 | 148 |
| 3 | 8.56651 | 8.55103 | 149 |
| 4 | 8.56615 | 8.55126 | 146 |
| 5 | 8.56603 | 8.55132 | 150 |
| 6 | 8.56583 | 8.55142 | 148 |
| 7 | 8.56500 | 8.55159 | 155 |
| 8 | 8.56397 | 8.55201 | 156 |
| 9 | 8.56362 | 8.55218 | 152 |
| 10 | 8.56355 | 8.55229 | 150 |
| 11 | 8.56341 | 8.55237 | 154 |
| 12 | 8.56311 | 8.55252 | 154 |
| 13 | 8.56297 | 8.55247 | 154 |
| 14 | 8.56287 | 8.55252 | 156 |
| 15 | 8.56268 | 8.55272 | 152 |
| 16 | 8.56246 | 8.55284 | 154 |
| 17 | 8.56215 | 8.55292 | 154 |
| 18 | 8.56189 | 8.55292 | 155 |
| 19 | 8.56161 | 8.55314 | 155 |
| 20 | 8.56135 | 8.55322 | 156 |
| 21 | 8.56103 | 8.55349 | 156 |
| 22 | 8.56098 | 8.55357 | 155 |
| 23 | 8.56091 | 8.55367 | 156 |
| 24 | 8.56080 | 8.55390 | 158 |
| 25 | 8.56059 | 8.55414 | 158 |
| 26 | 8.57925 | 8.55608 | 143 |
| 27 | 8.57947 | 8.55611 | 142 |
| 28 | 8.57964 | 8.55615 | 141 |
| 29 | 8.57984 | 8.55618 | 143 |
| 30 | 8.58075 | 8.55652 | 144 |
| 31 | 8.58100 | 8.55653 | 144 |
| 32 | 8.58104 | 8.55667 | 144 |
| 33 | 8.58135 | 8.55708 | 147 |
| 34 | 8.58121 | 8.55704 | 141 |
| 35 | 8.58001 | 8.55596 | 143 |
| 36 | 8.57989 | 8.55581 | 143 |
| 37 | 8.57896 | 8.55573 | 141 |
| 38 | 8.57983 | 8.55569 | 142 |
| 39 | 8.57976 | 8.55580 | 145 |
| 40 | 8.57967 | 8.55575 | 144 |
| 41 | 8.57970 | 8.55568 | 143 |
| 42 | 8.57950 | 8.55585 | 144 |
| 43 | 8.57927 | 8.55581 | 144 |
| 44 | 8.57761 | 8.55517 | 141 |
| 45 | 8.57735 | 8.55497 | 142 |
| 46 | 8.57741 | 8.55464 | 140 |
| 47 | 8.56963 | 8.55661 | 146 |
| 48 | 8.56964 | 8.55679 | 146 |
| 49 | 8.56959 | 8.55700 | 147 |
| 50 | 8.56954 | 8.55767 | 148 |
| 51 | 8.56968 | 8.55730 | 148 |
| 52 | 8.56933 | 8.55781 | 150 |
| 53 | 8.56927 | 8.55790 | 150 |
| 54 | 8.56920 | 8.55820 | 150 |
| 55 | 8.56915 | 8.55820 | 150 |
| 56 | 8.56913 | 8.55827 | 150 |
| 57 | 8.56901 | 8.55849 | 150 |
| 58 | 8.56898 | 8.55860 | 151 |
| 59 | 8.56885 | 8.55873 | 148 |
| 60 | 8.56873 | 8.55895 | 152 |
| 61 | 8.56869 | 8.55917 | 152 |
| 62 | 8.56880 | 8.55919 | 150 |
| 63 | 8.56853 | 8.55936 | 152 |
| 64 | 8.56838 | 8.55956 | 152 |
| 65 | 8.56836 | 8.55977 | 152 |
| 66 | 8.56828 | 8.55990 | 153 |
| 67 | 8.56815 | 8.56012 | 152 |
| 68 | 8.56802 | 8.56034 | 153 |
| 69 | 8.56785 | 8.56046 | 154 |
| 70 | 8.56774 | 8.56056 | 154 |
| 71 | 8.56754 | 8.56067 | 154 |
| 72 | 8.56739 | 8.56082 | 155 |
| 73 | 8.55411 | 8.54059 | 219 |
| 74 | 8.55433 | 8.54107 | 170 |
| 75 | 8.55397 | 8.54165 | 170 |
| 76 | 8.55382 | 8.54181 | 167 |
| 77 | 8.55349 | 8.54194 | 163 |
| 78 | 8.55315 | 8.54225 | 161 |
| 79 | 8.55308 | 8.54239 | 162 |
| 80 | 8.55307 | 8.54253 | 162 |
| 81 | 8.55298 | 8.54292 | 160 |
| 82 | 8.55243 | 8.54373 | 163 |
| 83 | 8.55215 | 8.54417 | 161 |
| 84 | 8.55281 | 8.54346 | 160 |
| 85 | 8.55287 | 8.54346 | 160 |
| 86 | 8.55335 | 8.54250 | 158 |
| 87 | 8.55425 | 8.54006 | 156 |
| 88 | 8.53819 | 8.53195 | 152 |
| 89 | 8.53815 | 8.53211 | 153 |
| 90 | 8.53803 | 8.53239 | 153 |
| 91 | 8.53795 | 8.53254 | 152 |
| 92 | 8.53857 | 8.53454 | 155 |
| 93 | 8.53870 | 8.53479 | 151 |
| 94 | 8.53916 | 8.53557 | 154 |
| 95 | 8.53923 | 8.53565 | 155 |


