Histological characterization of the maturation stages of the ovarian follicles of the goldfish Carassius auratus (Linnaeus, 1758)
Abstract
The goldfish is a model organism showing great potential for research, particularly in comparative endocrinology concerning the neuroendocrine signalling and regulation of vertebrate reproduction. Furthermore, this teleost is increasingly stressed as a relevant alternative to more common fish model organisms, namely zebrafish. However, quality descriptions and illustrations of the complete goldfish gonadal histology are surprisingly scarce, but needed, to support research using this fish. Therefore, the main aim of this work is to describe in detail and adequately illustrate the goldfish oogenesis, from oogonia to late maturation, by applying routine stains (haematoxylin–eosin) and special procedures (periodic acid–Schiff and Goldner's trichrome). We hypothesized that the combined strategies would enable not only to observe the most general features but also to perceive some poorly described details of oocytes better. We describe the details of the following maturation stages: oogonia proliferation, chromatin–nucleolus, primary growth (one nucleolus step, multiple nucleoli step, perinucleolar step, cortical alveoli step) and secondary growth (early secondary growth step, late secondary growth step). Additionally, we report aspects of early and late follicular atresia. The study allowed comparisons with other species and showed that the Goldner's trichrome has the best discriminative power and should be the preferred stain, despite more time-consuming.
1 INTRODUCTION
The goldfish (Carassius auratus) is a freshwater fish that belongs to one of the largest vertebrate families, the Cyprinidae, of the order Cypriniformes, being native from East Asia (Nelson, 2006). Selective breeding over the years led to the development of numerous breeds of goldfish, which vary in colour, body shape, size, fins and eye configuration, and are used for ornamental along with research purposes (Smartt, 2001). The goldfish is a cyprinid closely related to the most used fish in research laboratories worldwide: the zebrafish (Danio rerio). It has been used increasingly over the years as model organism due to its ample size range, easy handling, great adaptability, commercial availability, and low costs of rearing and husbandry, which make it an excellent tool for fundamental and applied research (Pierantoni, Cobellis, Meccariello, & Fasano, 2002; Popesku et al., 2008; Wong, Zhou, Jiang, & Ko, 2006). Significant advances were achieved using goldfish as model organism, especially in neuroendocrine signalling and brain regulation of biological events, such as growth, reproduction, sex pheromones signalling, comparative endocrinology, behaviour and stress responses (Bernier & Peter, 2001; Hanington, Barreda, & Belosevic, 2006; Lee, Caldwell, & Gibbons, 1997; Popesku et al., 2008).
Oogenesis is a complicated dynamic procedure that involves phases of oocyte development, which are overall similar in different fish species. However, according to the pattern of the oocyte development, three main types of ovarian development have been described for fish, as it is detailed in the literature (Rocha & Rocha, 2006; Selman & Wallace, 1989). Teleost oocytes, as in other vertebrates, are enveloped by cellular layers, which follow the growth of the oocyte. The follicle cell layer consists of a well-defined inner stratum, the granulosa cell layer and, more externally, one or two sub-layers of theca cells, which forms the theca layer (Nagahama, 2002). Once the oocyte starts growing, the follicular layers change, to support and adjust its development continuously (Nagahama, 2002; Rocha & Rocha, 2006).
There is ample information on the reproductive biology of the goldfish, with most studies relying on the use of analytical chemistry, and biochemical and molecular biology techniques. In contrast, and surprisingly, there is lack of in-depth studies using histological methods to describe the normal ovarian microanatomy and better understand the normal reproductive biology of the goldfish; and that offer a pedagogical illustration of its ovarian follicles. Given the literature, it seems that the goldfish is an asynchronous spawner, which means that the ovaries should present oocytes at different development stages during the reproductive period. The asynchrony in goldfish ovarian morphology, if confirmed, should make it easier to compare its structure with better-known asynchronous spawners, such as the zebrafish (Lubzens, Young, Bobe, & Cerdà, 2010; Nagahama, 1983; Rocha & Rocha, 2006).
Irrespective of the type of ovary maturation kinetics, for the successful reproduction of a fish a cascade of neuro-hormonal events must occur, primarily relying on the hypothalamus–hypophysis–gonad axis (Urbatzka, Rocha, & Rocha, 2011). The events are triggered by external factors, such as light cycle, temperature or nutrition. Often, fish in captivity fail to fully mature and reproduce. In the case of cyprinids, including goldfish, the common problem is to fail final oocyte maturation (Podhorec & Kouril, 2009). This can be circumvented either by manipulating the environment or by hormonal challenging, aiming to trigger the hypophyseal synthesis and release of luteinizing hormone (LH) secretion. In cyprinids, hormonal induction of final oocyte maturation and ovulation can be attained by intramuscular injection of the luteinizing hormone-releasing hormone analogue (LHRHa), a gonadotropin-releasing hormone, followed by injection of a dopamine antagonist (e.g. pimozide), because this neurotransmitter inhibits the LH secretion in the Cyprinidae (Podhorec & Kouril, 2009; Sokolowska et al., 1984).
For conducting studies on fish reproductive biology and toxicology, it is advantageous to monitor gametogenesis by histology. However, to do so, it is vital to rely on baseline descriptions that accurately illustrate the normal maturation stages. According to some authors, the oocyte development in fishes includes five stages (Grier, 2012; Uribe, Grier, & Parenti, 2012): oogonia proliferating, chromatin–nucleolus, primary growth (previtellogenesis), secondary growth (vitellogenesis) and ovulation. However, the terminology used differs among researchers, often impairing the interpretation and comparison of results between studies (Patiño & Sullivan, 2002). The latter aspect is another reason to have baseline studies with individual fish species of interest.
Our study aims to use histology to describe qualitatively the oogenesis in goldfish, and to examine the value of implementing the periodic acid–Schiff and Goldner's trichrome stainings in addition to the routinely used haematoxylin–eosin. The study establishes staining guidelines and offers the baseline histological framework to support further studies on the healthy or diseased goldfish ovary. At last, the study allows comparing goldfish with other fish species.
2 MATERIALS AND METHODS
The study was carried out at in-house aquatic animal facilities, being supervised by experts accredited in laboratory animal science by the Portuguese Directorate-General for Food and Veterinary. The protocol and procedures were approved according to the legal requirements (Decree Laws 113/2013 and 1/2019), based on the European directive of on the protection of animals used for scientific purposes (2010/63/EU).
Common goldfish, with an average total length of 11 cm and total body weight (BW) of 18 g, were acquired from a legally authorized supplier. They were subjected to a quarantine period of 30 days, with no mortality and kept at a maximum density of 20 fish per 120-L fibreglass tank. The temperature was kept at 22 ± 1ºC, and photoperiod of 14 hr of light and 10 hr of dark. The tanks were based on a recirculating water system, being subjected to mechanical and biological filtration. Aeration was mechanical, oxygen (O2) concentration was kept close to saturation, and pH was set close to neutrality. Ammonia and nitrites were measured once a week, typically being ≈ 0, and always below 0.05 mg/L. The animals were fed twice a day so that the food was totally consumed in less than 5 min, both with Goldfish Flakes (Prodac) and with frozen Artemia salina (Ocean Nutrition). Some of the fish were submitted to a hormonal induction of maturation, with a single dose (under anaesthesia) of 0.5 µg/g BW of luteinizing hormone-releasing hormone analogue (CAS 79561-22-1, from Sigma-Aldrich) and 10 µg/g BW of pimozide (CAS 2062-78-4, Sigma-Aldrich), and part of them was non-injected. Fish were killed with an overdose (1.0 ml/L) of the anaesthetic 2-phenoxyethanol (Sigma-Aldrich).
After necropsy, ovaries were extracted, weighed and then after processed for histology. The ovaries of injected mature females were used here for illustration, as they showed all types of ovarian follicles, but with a predominance of advanced maturation stages. Those mature females showed a mean gonad weight of 2.5 g and a gonadosomatic index (gonad weight/total weight) of 13%. As the ovaries could measure over 2 cm long, each one was cross-sectioned in half to promote good fixation, while offering the chance to do a systematic sampling strategy of the organ. One-half of the gonad was further cut longitudinally in half, and the other half was sliced transversally, to produce cross sections. The pieces for histological processing were ≈ 0.3–0.5 cm in thickness. These were fixed in Bouin's fluid for 48 hr, dehydrated in ascending grades of alcohol until absolute, cleared in xylene and embedded in paraffin (Shandon, melting point 56–57ºC). Serial sections of 4 µm thickness were cut with a fully automatic rotary microtome (Leica RM2255), picked and extended in a warm water bath, put on silane-coated glass slides (Klinipath). Groups of serial sections were stained using three staining procedures: haematoxylin–eosin (HE), periodic acid–Schiff (PAS) and Goldner's trichrome (GT). For the latter, following section hydration, we used the following protocol: celestial blue (2 min); tap water (5 min); Mayer's haematoxylin (2 min); tap water (5 min); xylidine Ponceau–acid fuchsin (Masson mix) (5 min); acetic acid 1% (rinse only); orange G-phosphomolybdic acid mixture (10 min); acetic acid 1% (rinse only); light green 0.2% (10 min); acetic acid (1–5 min); 100% alcohol (1 min × 3); and xylene (1 min × 2).
Mounting under glass coverslips was made using the Coverquick 2000 medium (VWR International). The slides were observed using a bright light microscope (Olympus BX50) and photographed with a 2-megapixel digital camera (Olympus DP21). The ovarian follicle phases were classified considering the terminology and baseline criteria used by Grier (2012) and Uribe et al. (2012). In addition to the oogonia and oocyte stages, the atresia (including of post-ovulatory follicles) was also considered. As implemented by the cited authors, the stages were further divided into steps, designed to refine the description and the identification of all the morphological changes occurring in the oocytes during growth and maturation.
3 RESULTS
3.1 Ovarian components
Our observations support that the goldfish ovary is of the cystovarian type, once they are surrounded by a well-developed capsule, have an inner cavity, or lumen, and oviducts. Irregular ovigerous lamellae are projected from the capsule into the cavity. The lamellae are filled with connective tissue that encloses the ovarian follicles. The peripheral connective tissue contains mostly oogonia and early-stage oocytes, appearing as cell nests, as detailed below. The follicular stages from oogonia to well-grown oocytes are present (Figures 1-8).
3.2 Oogenesis and folliculogenesis
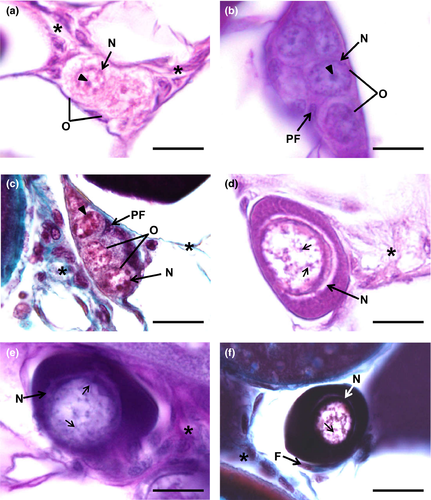
Oogenesis begins with the differentiation of germ cells, which produce gametes, and somatic cells that will later turn into follicular layers, by a process known as folliculogenesis. The transformation of germ cells into oogonia in goldfish is detectable as the latter elements appear dispersed within the connective tissue or as cell nests of oogonia (Figure 1a–c). Then, oogonia become early oocytes, which remain in meiotic arrest, at the end of prophase, in the diplotene stage (Figure 1d–f). Within the nests, tiny, elongated pre-granulosa cells are closely associated with the oogonia (Figure 1b,c). During folliculogenesis, the newly formed oocytes become fully enclosed by the follicular cells (Figure 1f), and together with the oocyte, an early follicle is formed. Upon completion of folliculogenesis, the ovarian follicle basic structure is established when follicular layers develop in more advanced phases (Figures 3b–f, 4c–f, 5d–f, 7a–f). An inner acellular layer, the zona pellucida (or zona radiata) (Figures 4f, 5f, 6a–f, 7c–f), appears as a well-defined densely stained line, subjacent to the follicular cell layer. Some of these layers often look detached from the oocyte due to technical artefacts, inherent to the histological processing recurring to paraffin embedding and associated procedures.
3.3 Oogonia proliferation stage
Oogonia can be spotted in the interstitial connective tissue as isolated cells or more often in groups that form “cellular pockets” (Figure 1a–c). When sectioned, no more than six oogonia could be seen simultaneously. Oogonia are unequivocally identifiable as small and roughly spherical cells that can attain up to 20 µm in diameter. The cytoplasm is scarce and looks somewhat hyaline as if it was “empty.” The nucleus is spherical, displaying one or eventually more densely stained nucleoli and a fine network of granular chromatin (Figure 1a–c). The transition from oogonia to a primary oocytes is characterized by changes in both the size and aspect of the follicle, typifying the entrance in the next so-called chromatin–nucleolus phase.
3.4 Chromatin–nucleolus stage
The oocyte is in the chromatin–nucleolus phase when meiosis begins and chromosomes within the nucleus are seen as fine and intensely stained chromatin threads (Figure 1d–f). This feature indicates that the chromatin-nucleolar oocyte advances through leptotene, zygotene and pachytene stages until it reaches the early diplotene stage of the prophase, where the chromosomes begin to decondense and the cell stops the division, remaining arrested until further maturation phases. The nucleus is often seen containing one or various conspicuous nucleoli, and most of the observed chromatin-nucleolar oocytes start to gain stain affinity in the cytoplasm. During early diplotene stage, the oocyte begins to grow, reaching up to 40 µm in diameter. Follicular cells (Figure 1f) start to set in the oocyte outer periphery and enclose it, beginning to confer definition to the developing follicular structure in the connective tissue.
3.5 Primary growth stage
Also named as the previtellogenic stage, it covers various steps: one nucleolus, multiple nucleoli, perinucleolar and cortical alveolar. The latter contains further sub-steps, depending on the progression and positioning of the cortical alveoli in the cytoplasm during growth.
3.5.1 One nucleolus step
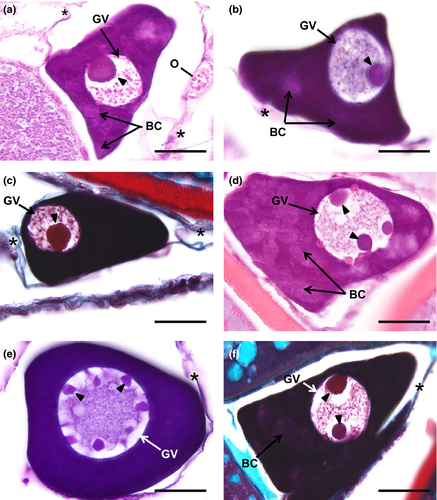
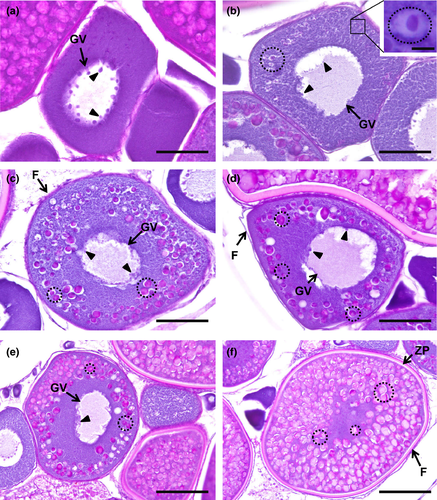
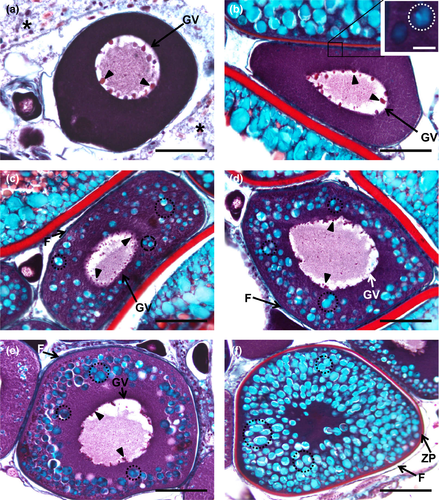
The oocyte slight increases in diameter, reaching more than 50 µm. The nucleus is now denominated as germinal vesicle due to its enlargement in volume, corresponding up to half of the diameter of the entire oocyte (15–25 µm) in most of the oocytes (Figure 2a–c). The germinal vesicle is spherical and contains a single and densely stained nucleolus. The cytoplasm also becomes intensely stained, being predominant basophilic. However, the cytoplasm is not fully homogenous because irregular areas with decreased staining affinity become visible, surrounding the germinal vesicle periphery or randomly displaced in the cytoplasm (Figure 2a,b). Presumably, those cloudy and relatively less basophilic areas are Balbiani corpuscles.
3.5.2 Multiple nucleoli step
The oocytes achieve a (major axis) diameter close to 80 µm, and the oocyte's spheroidal germinal vesicle contains multiple nucleoli that are randomly distributed (Figure 2d–f). Cytoplasm stain intensiveness remains as in the previous step. Balbiani corpuscles (Figure 2d,f) are also seen in this step as faded cytoplasmic zones that appear adjacent to the germinal vesicle or scattered throughout the cytoplasm. Elongated follicle cells are attached to the oocyte surface, but the follicular cell layer is so thin that is almost indistinct. The oocyte is surrounded by scarce loose connective tissue.
3.5.3 Perinucleolar step
The oocyte continues to enlarge, attaining a diameter approximately of 100 µm, and the germinal vesicle continues to be spheroidal but larger, with up to 50 µm or more in diameter. Multiple nucleoli that were arranged randomly in the previous step are now smaller and oriented around the inner membrane of the germinal vesicle (Figures 3a, 4a, 5a). These nucleoli are spherical and can have various diameters within the same oocyte. Balbiani corpuscles are also observed in this step, spread across the cytoplasm. Although the cytoplasm volume continues to widen, there is a slight decrease in its staining affinity, better perceived in the diminished basophilia with haematoxylin–eosin.
3.5.4 Cortical alveoli step
The name of this step is due to the appearance of vesicles, name cortical alveoli (or cortical vesicles, yolk vesicles, primary yolk or endogenous yolk). In an early cortical alveoli step, oocytes can reach up to 100 µm and still show multiple nucleoli positioned around the periphery of the germinal vesicle (Figures 3b, 4b, 5b). There is a significant loss of basophilic (haematoxylin) stain affinity in the cytoplasm, followed by the appearance of tiny vesicles, corresponding to the initiation of cortical alveoli formation. Usually, with haematoxylin–eosin stain, these premature cortical alveoli appear in the cytoplasm as non-stained or faintly stained “spaces” (Figure 3b inset). In turn, cortical alveoli appear as slight PAS-positive structures (Figure 4b inset). Lastly, with Goldner's trichrome stain, cortical alveoli stain blue (Figure 5b inset). In a transition step, between early and mid-cortical alveoli step (Figures 3c, 4c, 5c), the oocyte grows (up to 200 µm) due to cortical alveoli increase in number and size, migrating and appearing dispersed in the cytoplasm, especially in the mid-cortical alveoli step. In the latter step, the alveoli start to become numerous and larger, appearing dispersed in the cytoplasm, tending to be more numerous at the periphery (Figures 3d, 4d, 5d). In the transition step between mid- and late cortical alveoli step (Figures 3e, 4e, 5e), cortical alveoli reach larger dimensions and appear displaced towards the periphery in the oocyte cytoplasm. The zona pellucida starts to attain width. In these last cortical alveoli step, zona pellucida appears as a very pronounced layer (Figures 3f, 4f, 5f), red-stained in Goldner's trichrome and positively stained by PAS. Cortical alveoli occupy most of the oocyte volume and appear homogenously displaced in the last cortical alveoli phase, except around the germinal vesicle. The latter remains central and with multiple nucleoli peripherally oriented during the full step (Figures 3b–f, 4b–e, 5b–e).
3.6 Secondary growth stage
In this phase, also known as vitellogenic, the cortical alveoli are progressively displaced to the periphery of the oocyte, while yolk granules to yolk bodies (the latter viewed as the enlarging and the final granules) are assembled centripetally. In parallel, it is observed the prominence of the egg envelope surrounding the oocyte, namely the zona pellucida. The secondary growth phase comprises early secondary growth step and late secondary growth step.
3.6.1 Early secondary growth step
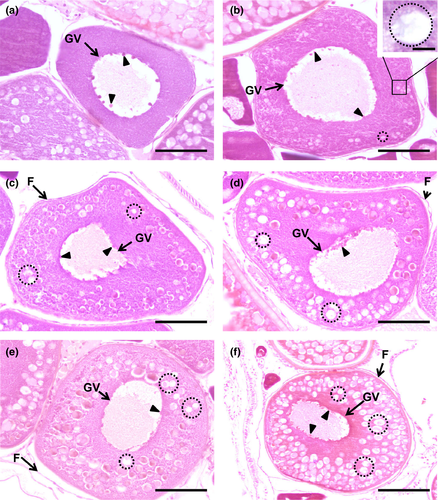
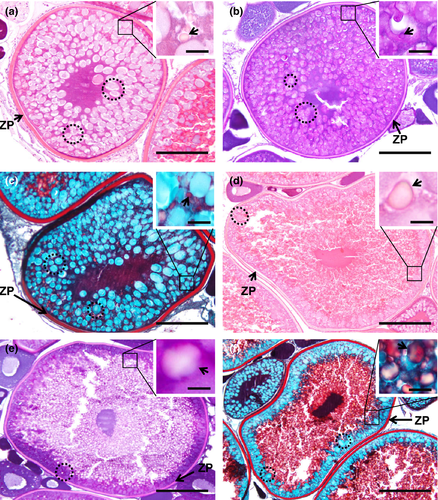
In this phase, there is an active deposition of yolk material and the oocytes grow further and attain a diameter up to 200 µm (Figure 6a–c). Early small and spherical yolk granules begin to accumulate at the oocyte periphery (Figure 6a–c insets). With haematoxylin–eosin, yolk granules are seen as small eosinophilic spheres accumulated within the oocyte margins, between cortical alveoli (Figure 6a inset). These granules appear as PAS-positive structures among the cortical alveoli (Figure 6b inset). With Goldner's trichrome, yolk granules stain red and are displaced amid the blue stained cortical alveoli (Figure 6c inset).
3.6.2 Late secondary growth step
Oocytes can reach up to more than 400 µm approximately of diameter in this phase. The yolk granules enlarge and begin to fuse throughout the cortical alveoli, appearing as irregular sized yolk bodies. These begin to deposit in the oocyte centre. Although bigger, yolk bodies remain as eosinophilic structures in haematoxylin–eosin stain (Figure 6d inset), becoming unstained with PAS and appearing as “empty spaces” (Figure 6e inset). Goldner's trichrome stains red the engorged red yolk bodies (Figure 6f inset). The eosinophilic zona pellucida attains maximum thickness, as detailed below.
3.6.3 Follicular layers in secondary growth stage
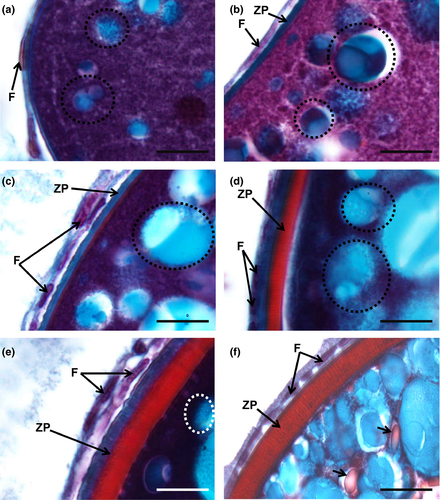
Goldner's trichrome was the most discriminative staining for studying the follicular layers (Figure 7). It revealed that in between the early and mid-cortical alveoli step, the follicular cells begin to develop, forming a thin one-cell thick cellular follicular layer that surrounds the oocyte (Figure 7a,b). The zona pellucida is initially very thin and stains in blue (Figure 7b). A thicker layer that stains initially blue and red, and then only red appears in the mid-cortical alveoli step, corresponds to the growth of the zona pellucida, subjacent to the follicle layer cells, that also appear thicker and more defined (Figure 7c,d). The zona pellucida progressively attains more width while developing faded radial “strips” in its border (Figure 7e). In the early secondary growth phase, the zona pellucida reaches its maximum dimension, as a well-differentiated striated layer between the oocyte and the overlying follicle layer cells, looking well highlighted in staining, but especially tinted with Goldner's trichrome (Figure 7f).
3.7 Follicular atresia
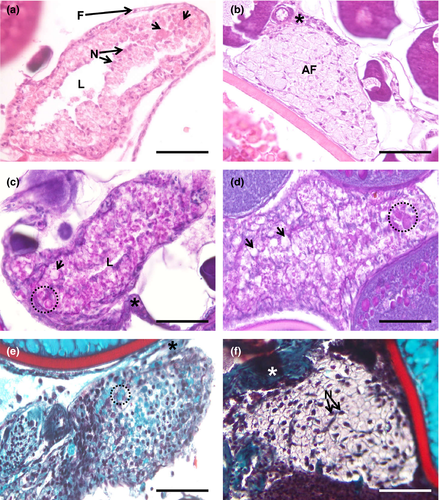
Ovarian atresia was also detected during the histological analysis of goldfish ovary (Figure 8). Atretic follicles appear as polymorphic structures, which result from the death of the oocytes and subsequent collapse and disintegration of follicles. The degenerative atretic process covers several stages. After oocyte death and dissolution, from which cell debris, namely cortical alveoli and yolk bodies, may persist (Figure 8a,c–e), the follicle cells, particularly the granulosa cells, proliferate and hypertrophy, to the point of occluding the atrium resulting from the space that was once occupied by the oocyte (Figure 8a,c). The engorged follicular cells pass by a stage when they are gently PAS-positive (Figure 8c) and have the cytoplasm stained blue with Goldner's trichrome (Figure 8e). In late periods of the atretic follicle life, the atrium disappears, and the remaining follicle cells have less staining affinity, (Figure 8b,d,f). Before disintegration, the follicle becomes a mass of vacuolated cells (Figure 8b,d,f). Pigment deposition was not observed within follicular atretic oocytes.
3.8 Summary of staining affinities
To support the histological description of the development of the ovarian follicles, we used haematoxylin–eosin, PAS and Goldner's trichrome. In Table 1, we summarize comparatively the results of the staining affinities of certain structures in view of the routine and special technics.
| Follicular structure | Haematoxylin–eosina | Periodic acid–Schiff | Goldner's trichrome |
|---|---|---|---|
| Cortical alveoli (early) | −/+ | + | +++ (blue) |
| Cortical alveoli (later, final) | −/++ | ++/+++ | +++ (blue) |
| Yolk granules (early globules) | + | + | ++/+++ (red) |
| Yolk bodies (grown globules) | + | - | ++/+++ (red) |
| Zona pellucida (early) | + | ++/+++ | +++ (blue) |
| Zona pellucida (mid, inner zone) | ++ | ++ | +++ (red) |
| Zona pellucida (mid, outer zone) | ++ | ++ | +++ (blue) |
| Zona radiata (later, final) | ++ | ++ | +++ (red) |
Note
- Reaction intensity: − (negative); + (weak); ++ (moderate); +++ (strong).
- a Affinity for eosin.
4 DISCUSSION
This paper evaluates the discriminative virtue of three histological staining techniques for the description of oocyte development in goldfish. Four major stages of development were found, based on oocyte and nucleus size, amount and distribution of cell inclusions (cortical alveoli and yolk granules and yolk bodies) and follicular layers width, as advised in the literature (Rocha & Rocha, 2006). Atretic follicles were also described. The development of the goldfish oocytes are overall similar to those described for other cyprinids (Grier, Uribe-Aranzábal, Patino, & Jamieson, 2009), but it falls in what seems to be a minority of species that do not accumulate lipid droplets.
In goldfish ovary, oogonia can be found either scattered among connective tissue cells or enclosed in cell nests, as seen in other teleosts (Grier, Uribe, & Parenti, 2007). After various mitotic divisions, oogonia became primary oocytes when chromosomes are stopped at the diplotene stage of the first meiotic prophase, where the chromatin starts to decondense and appears as fine filaments (Kagawa, 2013), as it was found here in goldfish in the chromatin–nucleolus phase. The transition between these first phases is characterized mostly by the gain of size and staining affinity. Also, in that phase, oocytes start to become surrounded by follicular cell layers. These are essential for proper oocyte growth, triggering and controlling mechanisms throughout oogonia proliferation and oocyte recruitment (Kagawa, 2013).
The primary growth phase is mostly characterized by the increase in the cell and nucleus sizes, intense basophilia of the cytoplasm and appearance of cortical alveoli. The rise in the cytoplasm basophilia indicates a period of the synthesis of the ribonucleic acid in the nucleolus that is transported to the cytoplasm, coupled with ribosome production to support the development of later stages of oogenesis and during the embryogenesis (Grier et al., 2009; Patiño & Sullivan, 2002; Wallace & Selman, 1981). Balbiani corpuscles are usually detected as slightly acidophilic zones in the cytoplasm and are thought to correspond to organelle concentration areas (Guraya, 1979; Rocha & Rocha, 2006; Selman & Wallace, 1989). These migrate to the oocyte periphery and disperse. Despite seldom illustrated, the structure of the Balbiani corpuscles does not seem universal in fish. Those of goldfish resemble images from zebrafish (Marlow & Mullins, 2008) and goodeids Crenichthys baileyi and Empetrichthys latos (Uribe et al., 2012), but differ from the large thread-like basophilic bodies of the swordfish (Corriero et al., 2004) and rainbow trout (Gülsoy, 2009), and the round basophilic ones of the catfish Jundiá (Ricci et al., 2018). The significance of such differences is unclear, but we argue that one cause for the variance in aspect is the corpuscle disintegration over time.
In the primary growth phase, the cortical alveoli were particularly highlighted with the use of the Goldner's trichrome. With this, it was clear that they develop gradually in parallel with the enhancement oocyte diameter, in line with prior observations for other fish (Selman & Wallace, 1989). In detail, Goldner's trichrome (with a superb refinement of the details) and PAS staining revealed that the early cortical alveoli of goldfish begin to develop as tiny and spherical vesicles in the cytoplasm periphery. When studying the red drum, Grier (2012) emphasized that the intense magenta staining of the cortical alveoli, with PAS, was a feature that could distinguish them from the yolk globules. The alveoli positivity for PAS exposes that they are glycoprotein-rich vesicles, a feature that seems consistent in fish (Blazer, 2002; Uribe et al., 2012). A survey on 102 teleosts showed nuances in the composition of cortical alveoli, with neutral glycoproteins and sialic acid-rich glycoproteins being very frequent (Bazzoli & Godinho, 1994).
In parallel with the increased number and size of the cortical alveoli, the zona pellucida became progressively eminent. The structure of this layer synthesis is detailed described by Lubzens et al. (2010), and it consists on the incorporation of proteins into secretory proteins that fuse with the oocyte plasma membrane and are deposited into the innermost layer of the thickening zona pellucida. The present study shows that Goldner's trichrome stain enables to see in fine detail the growth progression of the zona pellucida, and even the change in composition with time (as the red staining started in the inner part first). Our data are in line with other pieces of evidence pointing that the fish zona pellucida has external (rich in neutral and acid mucopolysaccharides) and inner (more proteinaceous) zones, where the first is produced by granulosa cells and the latter by the oocyte (Giulianini & Ferrero, 2001; Riehl & Patzner, 1998). Nagahama, Chan, and Hoar (1976) investigated the ultrastructure of pre- and post-ovulatory follicles in goldfish and saw that granulosa cells have well-developed rough endoplasmic reticulum and extensive Golgi apparatus; these suggest a significant role in polysaccharides and glycosylated protein synthesis.
In goldfish, we notice no accumulation of oil (lipid) droplets either in primary or in secondary growth steps. With PAS and Goldner's trichrome, virtually all roundish cytoplasmic structures that could be confounded with oil droplets are stained, which would not be the case if they were lipids. Many fish species display what some authors call a “lipid stage,” in which the oocytes start exhibiting small oil droplets in parallel with the appearance of the zona pellucida, such as reported in the swordfish (Corriero et al., 2004). In a joint “oil droplet and cortical alveoli step,” the lipidic accumulation can be massive with time, pushing cortical alveoli to a thin subplasmalemmal strip, as observed in the goodeids Crenichthys baileyi and Empetrichthys latos (Uribe et al., 2012). The emergence and build-up of lipid droplets in most teleosts phenotypically translate what is presently called “oocyte lipidation” (Reading et al., 2018). Like the goldfish, the zebrafish does not display lipid droplets in oocytes, despite accumulating lipids in yolk (Malone & Hisaoka, 1963; Selman, Wallace, Sarka, & Qi, 1993). Our data call for studies on how goldfish may handle free fatty acids, since re-esterification and subsequent storage are expected (Reading et al., 2018).
The secondary growth phase, also known as vitellogenic phase, is mainly characterized by the presence and accumulation of yolk granules/bodies (also named as globules), which result from the incorporation of yolk lipoproteins and that have primary importance for nutrition and metabolic activities during embryonic development (Lubzens et al., 2010; Uribe et al., 2012). In an early stage of this phase in goldfish, yolk granules that appear primarily in the oocyte periphery start to appear also in the centre. Subsequently, the newly formed yolk granules/ bodies keep growing and almost fill up the oocyte cytoplasm. During the accumulation of yolk globules, these appear equally stained during its growth, both in haematoxylin–eosin and in Goldner's trichrome. However, using PAS, the initial positively stained yolk granules later appear unstained, indicating changes in carbohydrate contents of the yolk composition. In the swordfish, the yolk globules were found to be faintly positive for PAS, denoting some neutral glycoproteins and glycolipids contents, and no changes in positivity were mentioned (Ortiz-Delgado, Porcelloni, Fossi, & Sarasquete, 2008). In contrast, yolk globules in the red drum were not stained with PAS (Grier, 2012). Our goldfish data, together with interspecific differences in PAS affinity by yolk globules, should represent, phenotypically, the current recognition that oocyte yolk composition changes with time and varies substantially among species (Reading et al., 2018).
Although atresia is not an oogenesis maturation stage, it was described in this study as a degenerative, resorptive and reparative process in which several ovarian follicles fail to complete maturation (Blazer, 2002; Saidapur, 1978). First, morphological signs of atresia are the disintegration of the nucleus, forming a lumen, followed by the hypertrophy of follicle cells. Follicle cells seem to be responsible for the initial resorption of oocyte remnants in goldfish (Khoo, 1975) and other fish species (Rocha & Rocha, 2006). Both granulocytes and macrophages are reported to intervene in the final stages of atresia, but their role is debated and not well known in the complex process that involves heterophagy, autophagy and apoptosis (Santos et al., 2008; Tingaud-Sequeira et al., 2009). Because of the heterogeneity of cellular morphology and non-cell-specific stains used, we could not confirm undoubtedly the presence of immune cells in the atretic follicles of the goldfish. In a previous detailed study on the structure and function of atretic follicles and post-ovulatory corpus luteum in goldfish, granulocytes and macrophages were also not reported (Khoo, 1975). Pigment deposits were not seen in goldfish atretic follicles, contrary to what is often described in other species, where those depositions are characterized as lipofuscin (Blazer, 2002). Fibroblast-like cells were found surrounding the remnants of the follicle and seem to indicate the end of the atretic process (Lubzens et al., 2010). The mechanism of atresia is a well-regulated process that appears to be crucial for the maintenance of ovarian homeostasis, and it can occur either at the end of each reproductive cycle or in any stage of development (Krysko et al., 2008; Rocha & Rocha, 2006). Herein, by their various sizes, the atretic follicles originated not from the early differentiation stages of oocytes.
In conclusion, despite the goldfish is a well-characterized model, there is a surprising lack of published studies that illustrate in detail, with histological techniques, the gonads of the species. This work uses histological techniques and offers data to support the use of goldfish as an animal model for studying reproductive biology and toxicology. The use of three stainings allowed us to differentiate and better characterize the features throughout follicle maturation. The ovary maturation phases in goldfish are overall similar to other teleost fish, specifically with well-known asynchronous spawners, such as zebrafish, but differ from others. There are follicular maturation cycles in some teleost and non-teleost fish species in which the oocytes are very rich in lipid droplets, which does not appear to be the case in goldfish giving our results. The Goldner's trichrome has been seldom explored in fish histology of the ovary. The latter procedure allowed us a superior differentiation of details of the growing oocytes, much better separating the yolk granules/bodies morphologically from the cortical alveoli. It allowed clear recognition of the zona pellucida right from its onset, and the identification of subtle staining affinity changes during its differentiation; which deserves further assessment in the future. Several gaps remain specifically on the mechanisms that lead to the formation of viable eggs and that govern atresia. Phenotypic anchoring of molecular, biochemical and physiological approaches is needed, and our fundamental research work should help on this endeavour.
ACKNOWLEDGEMENTS
This research was partially supported by the Strategic Funding UID/Multi/04423/2019 through national funds provided by FCT (Foundation for Science and Technology) and ERDF (European Regional Development Fund), in the framework of the programme PT2020. The authors thank Fernanda Malhão and Célia Lopes for the histotechnical training of M. L. Ferrão.
CONFLICT OF INTEREST
We have no conflict of interest to declare.


