Chronic ethanol exposure induced anxiety-like behaviour by altering gut microbiota and GABA system
Hui Yao and Dalin Zhang contributed equally to the work.
Abstract
Ethanol, also known as alcohol, is one of the most common drinks in the world. Chronic ethanol exposure has been reported to induce mental disorders. Ethanol also has a strong effect on the gut microbiota. The gut microbiota has been reported to affect the brain via multiple pathways, including changes in γ-aminobutyric acid (GABA) system, and cause a variety of mental disorders. The GABA system in the cortex is associated with anxiety. However, the role of gut microbiota played in ethanol exposure-induced changes in the GABA system and anxiety is still not clear. We established a 30-day ethanol exposure mouse model and investigated the effects of microbiota using the antibiotic minocycline. Minocycline alleviated ethanol-induced anxiety-like behaviour, dysbiosis of microbiota, intestinal barrier disruption, increased serum endotoxin and interleukin (IL)-6. Minocycline also attenuated ethanol-induced apoptosis and decreased expression of glutamate decarboxylases (GADs) and GABRA1 in the prefrontal cortex. Our results indicated that gut microbiota plays an important role in ethanol-induced anxiety-like behaviour by altering the function of GABA system. In addition, causal mediation analysis showed that endotoxin and IL-6 may mediate the connection between the gut microbiota and the expression of GABAA receptor in the prefrontal cortex.
1 INTRODUCTION
Ethanol, also known as alcohol, is a popular beverage and the most frequently abused drugs over the world. Alcohol use disorder (AUD), as a serious social and medical problem, could cause multiple damages to central nervous system (CNS).1 The effects of ethanol on CNS are associated not only with impaired learning and memory2, 3 but also with mental disorders, especially anxiety disorder and major depression disorder.4, 5 Animal experiments have also demonstrated that ethanol is an important risk factor for mental disorders such as anxiety-like and depressive-like behaviour.6, 7 In addition to the impairment on the brain, ethanol exposure also significantly alters the composition and function of the gut microbiota.8, 9
There are about 1010–1014 bacteria that reside in human gastrointestinal tracts, whose number is equal to that of human cells,11 and the number of genes is more than 100 times that of the human genome.12 Gut microbiota was reported to participate in the maintenance of the intestinal barrier, vitamin synthesis and catabolism of fibre.10, 13 Recent studies have shown that the gut microbiota not only affects the digestive system but also has a bidirectional connection with the distant CNS. Microbiota connects with the brain in a variety of bidirectional ways, which are called microbiota–gut–brain (MGB) axis, and participate in the pathogenesis of neurodegenerative diseases, including Parkinson's disease14 and Alzheimer's disease.15 The gut microbiota is also considered to be an important regulator of behaviour and emotion. A variety of chronic intestinal infections are frequently accompanied by an increase in anxiety behaviour; for instance, irritable bowel syndrome (IBS) patients are prone to high anxiety.16, 17 Supplementation with probiotics or prebiotics was effective in alleviating anxiety or depressive behaviour in a variety of animal models, including chronic unpredictable mild stress (CUMS)18 and immobilization stress (IS).19 In addition, clinical studies have shown that changes in gut microbiota of AUD patients are related to the severity of psychological symptoms.20
The MGB axis is an intricate network, including pathogen-associated molecular pattern (PAMPs), hypothalamic–pituitary–adrenal (HPA) axis and GABA system.21 GABA is the main inhibitory neurotransmitter in the mammalian brain. The dysfunction of GABA system in ventromedial prefrontal cortex (vmPFC) could lead to disinhibition of the amygdala causing limbic system hyperactivity and consequently anxiety.22 The effects of ethanol on the GABA system have been known for a long time. Ethanol has been reported to active the GABA system, which is regarded as the mechanism of acute AUD.23, 24 The following studies have shown that chronic ethanol exposure may have different effects on the GABA system, and the most striking effect is to inhibit the expression or function of GABAA receptor.25 Based on these findings, we hypothesized that ethanol may induce anxiety or depressive behaviour by altering the gut microbiota. We decided to demonstrate the effects of microbiota using antibiotic treatment, and minocycline was selected.
Minocycline, a broad-spectrum tetracycline antibiotic (structure is showed in Figure 1B), has the strongest antibacterial activity among similar drugs. The action of minocycline for antimicrobial activity is achieved via attaching to the bacterial 30S ribosomal subunit and preventing protein synthesis.26 Minocycline has been reported to alter the composition of the gut microbiota and reduce trait anxiety.27 However, whether minocycline could alleviate ethanol-induced mental disorders is still unknown. In this study, we investigated the effect of minocycline on ethanol-induced mental disorders using multiple behaviour tests and detected the changes in gut microbiota via 16S rRNA gene sequence. Then we explored the mechanism by examining the state of the GABA system, including GABA levels and the expression of glutamate decarboxylases (GADs) and γ-aminobutyric acid A receptor alpha 1 (GABRA1) in the prefrontal cortex. Moreover, peripheral pro-inflammatory cytokines, apoptosis and synaptic proteins in the prefrontal cortex were also detected. In addition, causal mediation analysis was used to explore the association between the gut microbiota, peripheral pro-inflammatory cytokines and GABA levels in the prefrontal cortex.
2 MATERIALS AND METHODS
2.1 Chemicals
All chemicals used in this study were of analytical grade. Unless stated otherwise, all chemicals including ethanol (PubChem CID: 702) were purchased from Beijing Chemical Works (Beijing, China).
2.2 Animals
Male C57BL/6N mice (9–10 weeks old, weighing 17–25 g) were purchased from the Laboratory Animal Center of China Medical University. Mice were housed two animals per cage with free access to water and food. The indoor temperature was controlled at 21 ± 1°C, the relative humidity was 50% ± 10%, and the light cycle was 12 h (6:00 am–6:00 pm). All animal procedures were conducted in accordance with the Guidelines for the Care and Use of Laboratory Animals of China Medical University. All experimental procedures were performed according to the National Institutes of Health Guide for the Care and Use of Laboratory Animals (NIH Publications No. 8023, revised 1978).
2.3 Ethanol exposure and minocycline administration
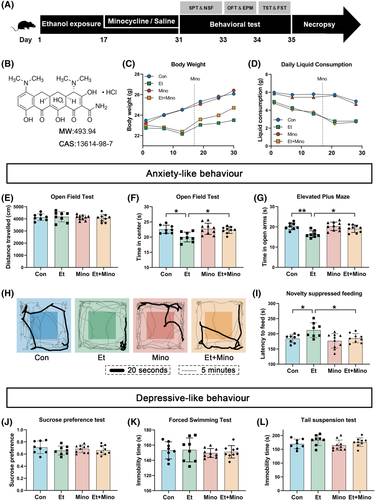
Mice were randomly divided into a control (Con) group, a 20% (m/V) ethanol (Et) group, a minocycline (Mino) and a 20% (m/V) ethanol + minocycline (Et + Mino) group. For Et and Et + Mino groups, the ethanol solution was the only choice of drinkable fluid. Mice in Et and Et + Mino groups received 10% ethanol for 2 days and 15% ethanol for 5 days, and then on Day 8, they were increased to their maximum concentration. From Day 17, the animals were treated with either saline or minocycline (10 mg/ml, PubChem CID: 54685925, A600356, Sangon Biotech, Shanghai, China) at a dose of 60 mg/kg by oral gavage once daily for the last 14 consecutive days (Figure 1A). Ethanol solutions or drinking water should be updated once a day. The beddings were renewed every day to clean up the faeces in the cages. The body weight and 24-h liquid consumption of mice were measured weekly.
2.4 Behaviour tests
Behaviour tests were performed after ethanol exposure and conducted in the order shown in Figure 1A. Mice were acclimated to the testing room for 2 h before testing. Behaviour test data were recorded by SMART™ tracking software program (San Diego Instruments, San Diego, CA, USA).
2.4.1 Sucrose preference test
Mice were presented with two pre-weight bottles containing 1% sucrose solution or purified water as previous reported,28 and the positions of bottles were switched every 12 h to prevent the effects of location preference. The consumption of sucrose solution or water was measured 24 h later by weighting the bottles. The sucrose preference index was calculated as the intake sucrose solution divided by the total liquid consumption.
2.4.2 Novelty suppressed feeding
The novelty suppressed feeding (NSF) test was performed as previously proposed, and the latency to eat reflects the anxiety-like behaviour in mice. All food was removed from the mice for 24 h, and water continued to be provided with free access. Then sweet food was placed in the centre of a plastic box (40 × 40 × 30 cm), and mice were placed in the corner of the arena. Mice were removed to the home cage immediately when the mice started eating, or the time reached 10 min.
2.4.3 Open field test
The open field test (OFT) was used to evaluate the depressive-like behaviours of mice performed as previously reported. The OFT consisted of an empty square arena (40 × 40 × 30 cm) constructed of plastic with a white base. The central region is 20 × 20 cm. Mice were placed individually in the corner of the OFT apparatus, then the spontaneous activities was recorded for 10 min using the SMART™ tracking program. After each test, the arena was cleaned with 75% ethanol solution to eliminate odour cues.
2.4.4 Elevated plus-maze (EPM)
The elevated plus-maze (EPM) was carried out as previously reported to evaluate the anxiety-like behaviours of mice. Mice were tested in a cross-shaped maze consisting of two open arms (50 × 10 cm), two closed arms (50 × 10 cm) and a central region (10 × 10 cm). Each mouse was placed in the central region of the maze and explored for 5 min. The time spent in each arm were recorded using SMART™ tracking program. After each test, the arena was cleaned with 75% ethanol to eliminate odour cues.
2.4.5 Forced swimming test
The forced swimming test (FST) was performed to explore the depressive-like behaviour of mice. The test device consisted of a transparent cylindrical glass container (10 cm in diameter, depth of 22 cm) filled with water (23°C to 25°C) and a video camera in front of the container. The mice could not touch the bottom of the container with its hind legs. The test was conducted for 6 min: The first 2 min was an adaption phase, after which the immobility of the mice in the water were recorded for 4 min (immobility refers to the mouse's body floating with the absence of any movement except for those necessary for keeping the nose above water).
2.4.6 Tail suspension test
The tail suspension test (TST) test was performed as previous described to assess the anhedonia.29 Mice were suspended by their tail (50-cm distance from the floor) using an adhesive tape at 1 cm from the tip of the tail. The TST test were conducted for 6 min, and duration of immobility in the last 4 min was recorded.
2.5 Animal stool and tissue collection
Stool samples were collected prior to behaviour tests. We first prepared an empty cage and covered the bottom with sterilized filter paper. A single mouse was placed in a cage and left to roam freely. Immediately after defecation, the stool sample was picked into the marked tube using tweezers. All the instruments were sterilized in advance. After each collection, the sterilized filter paper was changed with a new one.
After completing the behaviour tests, mice were anaesthetized with isoflurane, and blood from portal vein and vena cava was centrifuged and serum samples were stored in a −80°C freezer. Mice were then decapitated after cervical dislocation. The right prefrontal cortex was separated and stored in a −80°C freezer. The ileum was collected at a distance of 1 cm from the ileocecal part, then stored in a −80°C freezer for Western blot or fixated with xylene for haematoxylin and eosin (HE) staining.
2.6 Protein extraction and quantification
The extracted mouse prefrontal cortex and ileum were detergent-extracted on ice using radioimmunoprecipitation assay (RIPA) lysis buffer (Beyotime, Shanghai, China) with 1-mM phenylmethanesulfonyl fluoride (PMSF, Beyotime) and disrupted on ice for 30 min, and then fragmented with ultrasonication. Aprotinin (1 μg/ml, A8260, Beijing Solarbio Science & Technology Co., Ltd., Beijing, China) was added in the ileum samples. The lysates were collected and centrifuged at 21 000g for 15 min. Total proteins were quantified using a BCA protein assay kit (Beyotime).
2.7 Western blotting
Equal amounts of protein (up to 30 μg) were separated by 10% sodium dodecyl sulfate–polyacrylamide gel electrophoresis (SDS-PAGE) and transferred to polyvinylidene difluoride (PVDF) membranes. Transferred blots were blocked with non-fat milk for 2 h and then incubated overnight at 4°C with primary antibody (1:2000). The primary antibodies used were showed in Table S1. Blots were subsequently washed and incubated with goat anti-rabbit and goat anti-mouse secondary antibodies (Zsgb-Bio, 1:5000) for 2 h. Protein bands were detected with ECL reagent (Merck Millipore, Billerica, MA, USA). Chemiluminescent signals were detected and analysed using a Tanon-5500 chemiluminescent imaging system (Science and Technology Co., Ltd., Shanghai, China). The intensity of the bands was analysed using ImageJ 1.49 software (National Institutes of Health, Bethesda, MD, USA). The raw images are shown in Figure S5.
2.8 16S rRNA gene sequence
Faecal microbiota composition was studied by pyrosequencing of the V3–V4 region of the 16S rRNA gene. Total bacterial DNA from faecal samples was isolated using a QIAamp DNA Stool Kit (Qiagen, Valencia, CA, USA). The yield and quality of DNAs were measured by a NanoDrop ND 1000 Spectrophotometer (Thermo Fisher Scientific, USA) and 0.8% agarose gel electrophoresis, respectively. The V3–V4 region of the bacterial 16S rRNA gene was amplified by polymerase chain reaction (PCR) (forward primer: 5′-ACT CCT ACG GGA GGC AGC A-3′ and reverse primer: 5′-GGA CTA CHV GGG TWT CTA AT-3′). PCR products were purified with Vazyme VAHTS™ DNA Clean Beads (Vazyme, Shanghai, China) and quantified using a PicoGreen dsDNA Assay Kit (Invitrogen, USA). The sequencing service was provided by Personal Biotechnology Co., Ltd (Shanghai, China). The genescloud tools (http://www.genescloud.cn), a free online platform based on QIIME2 (2019.4 Denver, CO, USA), were used for statistical analysis and plotting. The sequences were screened to remove chimeras, followed by dereplication and amplicon sequence variants (ASVs) feature table construction using the DADA2 method30 (https://github.com/benjjneb/dada2). Taxonomy was assigned to ASVs using the naïve Bayes classifier trained31 against the Greengenes Database32 (release 13.8, http://greengenes.secondgenome.com/) trimmed to match the V3–V4 region sequenced. The alpha diversity, including the Chao1 and Shannon indices, was calculated using OTUs in QIIME2. Beta diversity was visualized by principal coordinate analysis (PCoA). The metadata was used for the analysis as Supporting information S2: Mapping file used for 16S rRNA gene sequencing analysis.
2.9 Enzyme-linked immunosorbent assay
The inflammatory cytokines and GABA in plasm or prefrontal cortex were investigated using assay kits (Table S2) obtained from Shanghai Enzyme-linked Biotechnology Co., Ltd. (Shanghai, China) and following the manufacturer. A 10-μl sample was diluted 5× for detection, and the absorbance at 450 nm was measured. The concentration was calculated according to the standard curve (Figure S4) drawing by Curve Expert 1.4 software (Daniel Hyams, Hixson, TN, USA).
2.10 Causal mediation analysis
Causal mediation analyses were carried out using R 3.6.3 with an R package (‘mediation’) based on two general linear models: the mediator model and the outcome model.33 The total effect included the direct effect estimated and the indirect effect. The ratio of indirect effect to total effect was defined as the proportion of mediation, and 95% confidence intervals (CIs) for mediated proportion were derived by the quasi-Bayesian Monte Carlo simulation with 1000 times. The R code used in this study has been provided as Supporting information S3: R code for causal mediation analysis. The raw data and results have been provided as Supporting information S4: Raw data of causal mediation analysis.
2.11 Statistical analysis
All data were expressed as the mean ± standard deviation (SD) unless otherwise stated. Statistical analysis of data was performed using analysis of variance (ANOVA) and Tukey's multiple comparisons test. A p value of <0.05 was considered significant. GraphPad Prism 8 (GraphPad Software, San Diego, CA, USA) was used for statistical analysis and plotting. All detailed statistical data are provided in Table S3.
3 RESULTS
3.1 Basic physiological conditions of mice
Mice exposed to ethanol grew more slowly (Figure 1C) and consumed less fluid (Figure 1D) than those on a regular diet. Notably, there were significant differences at Days 14, 21 and 28. Minocycline alleviated ethanol-induced slow rate of weight gain, especially on the 30th day (p < 0.05, Figure 1C), but never affected the body weight of those on a regular diet. Notably, minocycline administration had no effect on daily liquid consumption (Figure 1D).
3.2 Minocycline alleviated ethanol-induced anxiety-like behaviour in mice
There was no statistical difference in the distance travelled in the OFT by each group, which indicated that the remaining behavioural differences were not caused by impaired motor ability (Figure 2E). Mice in Et group showed less time in the open arms of EPM (Figure 2G) and the central area of OFT (Figure S2F,H), especially in the initial 20-s period of OFT (Figure 2H), more latency time to sweet food in NSF (Figure 2I) than those in Con and Et + Mino groups. These results strongly suggested that mice exposed to ethanol for 30 days showed significant anxiety-like behaviours and minocycline was effective in alleviating ethanol-induced anxiety.
3.3 Minocycline and ethanol exposure had no effect on depressive-like behaviour in mice
Depressive-like behaviour of mice was detected by FST, TST and sucrose preference test (SPT). There was no statistical difference between all groups in the sucrose preference (Figure 2J), immobility time of the FST (Figure 2K) and TST (Figure 2L). These results suggested that ethanol exposure for 30 days, as well as minocycline treatment, could not cause depressive-like behaviour.
3.4 Minocycline alleviated ethanol exposure-induced dysbiosis of gut microbiota
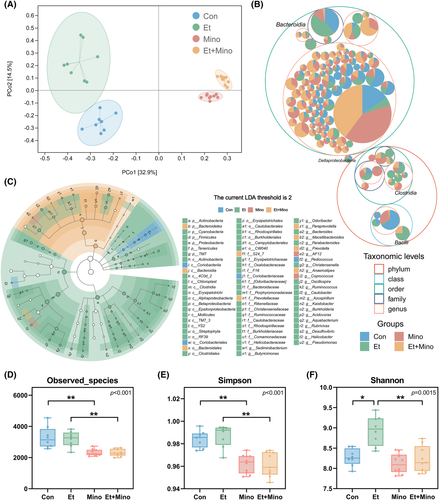
By analysing the results of 16S rRNA gene sequencing, both ethanol exposure and minocycline administration caused changes in the composition of gut microbiota at various taxonomic levels (Figure 2B), produced unique OTU clustering (Figure S1A) and significantly altered the biomarkers of microbiota (Figure 2C, Figure S1B). PCoA analysis also showed the significant differences in the composition of the microbiota of each group (Figure 2A).
Α diversity analysis also showed that ethanol and minocycline had specific effects on the gut microbiota. Observed species (Figure 2D) and number of taxa (Figure S1D) in Mino and Et + Mino Con and Et groups were significantly decreased compared with Con and Et groups. These results strongly suggest that minocycline treatment is able to reduce the number and alter composition of gut microbiota, whereas ethanol exposure for 30 days could only alter the composition without affecting the total number of gut microbiota.
Reduced Simpson index (Figure 2E) in Mino and Et + Mino groups and increased Shannon index (Figure 2F) in Et groups indicated that minocycline attenuates ethanol-induced changes, including increase in confusion and the proportion of rare microbial communities.
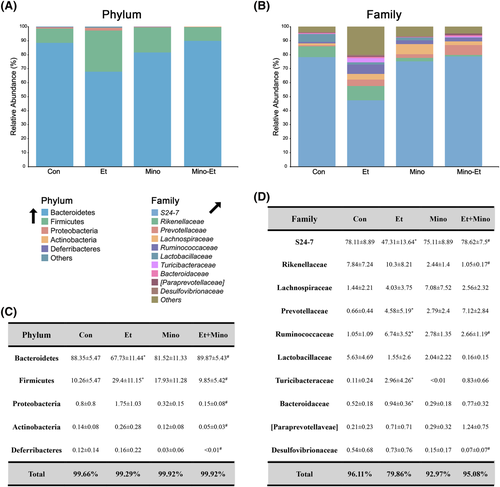
More detailed analyses of individual microbial clusters were performed at different taxonomic levels. With the help of barplots, the obvious changes were shown at phylum (Figure 3A), family (Figure 3B) and genus levels (Figure S1C), especially at family level. Changes of single microbial cluster at phylum (Figure 3C), family (Figure 3D; Figure S2C) and genus were shown in the table of microbial abundance or heatmap. At phylum level, minocycline attenuated ethanol-induced increase of Firmicutes and decrease of Bacteroidetes. At family level, minocycline attenuated the increase of Ruminococcaceae and the decrease of S24–7 induced by ethanol. In addition, minocycline attenuated ethanol-induced increase of Ruminococcus and Odoribacter at genus level.
3.5 Minocycline ameliorated ethanol-induced intestinal barrier disruption
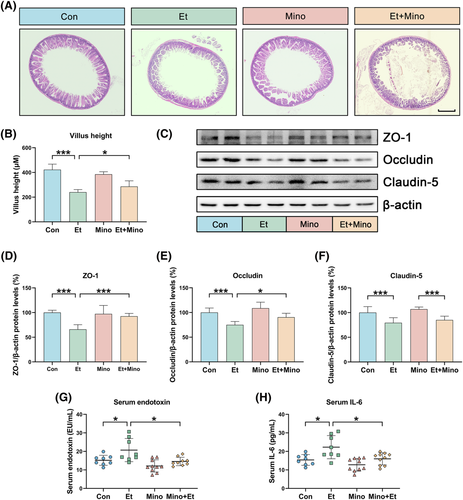
The intestinal barrier, which is at the forefront of the gut–brain axis, is the direct contact of the gut microbiota. Disruption of microbiota is likely to cause damage to the intestinal barrier. HE staining showed significant ileum pathological changes in Et group, including shedding of some villi, shallower crypt depth and shorter villus height (Figure 4A,B). Tight junction proteins (TJPs) zona occludens protein-1 (ZO-1), occludin and claudin-5 were detected by Western blot (Figure 4C). Compared with the control group, the expression of ZO-1 (Figure 4D), occludin (Figure 4E) and claudin-5 (Figure 4F) in Et group significantly decreased. And ZO-1, occludin in Et + Mino group increased compared with that in Et group. These results indicate that minocycline treatment could partially repair intestinal tight junction structure and reduce ethanol-induced intestinal barrier injury to a certain extent.
3.6 Minocycline alleviated ethanol exposure-induced increase of peripheral endotoxin and IL-6
Gut microbiota changes and intestinal barrier damage could both alter pro-inflammatory cytokines levels in circulation. Therefore, endotoxin and interleukin (IL)-6 were selected for detection. Serum endotoxin (Figure 4G) and IL-6 (Figure 4H) in the Et group were significantly increased compared with other groups, which indicated that minocycline alleviated ethanol-induced increasing of pro-inflammation cytokines.
3.7 Minocycline diminished changes of GABA system induced by ethanol exposure in prefrontal cortex
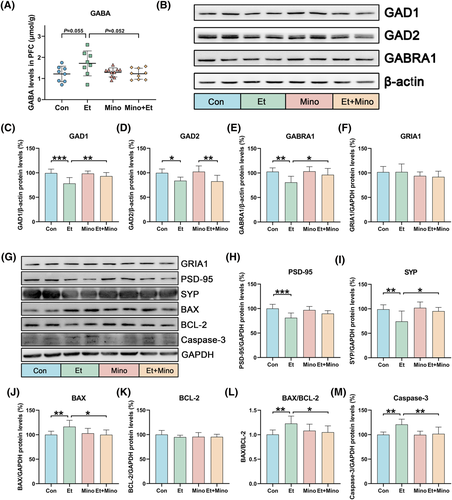
An abnormal GABA system in the prefrontal cortex is an important cause of anxiety behaviour. The GABA level in prefrontal cortex was detected by enzyme-linked immunosorbent assay (ELISA), the catalytic enzyme GADs and GABA receptor GABRA1 were detected by western blot (Figure 5B). The results showed that the expressions of GAD1 (Figure 5C), GAD2 (Figure 5D) and GABRA1 (Figure 5E) were significant reduced after ethanol exposure. The GABA levels in Et group were slightly elevated, but there was no statistically significant (Figure 5A). After minocycline administration, the GABA levels, the expression of GAD1 and GABRA1 in prefrontal cortex were restored. These suggest that ethanol exposure for 30 days is sufficient to alter the function of the GABA system in prefrontal cortex in various aspects, whereas minocycline could partially undo this inhibition.
3.8 Minocycline attenuated ethanol-induced apoptosis and changes of synaptic proteins in prefrontal cortex
GABA is not only an important neurotransmitter but also has been reported to have neurotrophic effects and regulate the apoptosis. Based on these, cell apoptosis-associated proteins and synaptic proteins in prefrontal cortex were also detected. There was a significant increase in the expression of BAX, caspase-3 and the ratio of BAX/BCL-2 in prefrontal cortex of Et group, which indicated that minocycline alleviated cell apoptosis in prefrontal cortex caused by ethanol. There was no statistical difference in ionotropic glutamate receptor 1 (GRIA1) expression among all groups. Compared with the Con group, postsynaptic density protein-95 (PSD-95) and synaptophysin (SYP) in Et group were remarkably decreased. SYP in the Et + Mino group was increased to the Et group. This suggested that minocycline may reduce synaptic damage caused by ethanol.
3.9 Pro-inflammatory cytokines may mediate the association between gut microbiota and GABRA1 levels in prefrontal cortex
In order to explore the association between changed microbiota, pro-inflammatory cytokines and GABRA1, we introduced correlation analysis and causal mediation analysis to conduct the study.
The GABRA1 expression in prefrontal cortex was positively correlated with the relative abundance of S24–7 (Figure S3B) and Bacteroidetes (Figure S3C). While the GABRA1 expression in prefrontal cortex was negatively correlated with the abundance of Ruminococcus (Figure S3A), Odoribacter (Figure S3D), Ruminococcaceae (Figure S3E) and Firmicutes (Figure S3F).
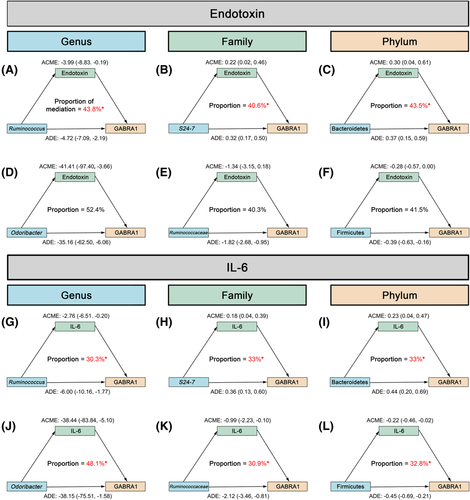
As shown in Figure 6, endotoxin may mediate the association between Ruminococcus (Figure 6A), S24–7 (Figure 6B), Bacteroidetes (Figure 6C) and GABRA1 while IL-6 may mediate the association between Odoribacter (Figure 6J), Ruminococcaceae (Figure 6K), Bacteroidetes (Figure 6I), Firmicutes (Figure 6L) and GABRA1.
4 DISCUSSION
Chronic ethanol exposure is positively correlated with the major depressive disorder, but the mechanism is not clear. Given the close connection between ethanol, gut microbiota and mental disorders, we hypothesized that ethanol exposure may induce the mental disorder by altering gut microbiota. Epidemiological investigation and clinical study have found that ethanol-induced mental disorders depend on dose and the duration of exposure.34, 35 Anxiogenic effects were also shown in animal models of ethanol exposure.36, 37 Then the present study focused on the effects of chronic ethanol exposure; it is necessary to ensure that mice are continuously exposed to ethanol for a long enough period of time. This time span of exposure in mice has proven difficult or impossible to attain with fully liquid diets containing ethanol or by repeated ethanol gavage or injections. The use of ethanol in water coupled with normal chow diets, which causes less systemic responses, is the most practical solution for long-term ethanol exposure in mice.38
In this study, a variety of behaviour tests were performed, in order to comprehensively reflect the behaviour and emotional state of mice. From the results, ethanol caused significant anxiety-like behaviour in mice, which was attenuated by oral minocycline administration. These results indicated that anxiety was the main symptom of short-term ethanol exposure-induced mental disorders while the effects of minocycline suggested that ethanol-induce mental disorders may be regulated by gut microbiota.
Results from 16S rRNA gene sequencing an intestinal examination further confirmed the role of gut microbiota. Ethanol exposure leads to dysbiosis of microbiota, increase of rare microbiota and changes of microbial composition at various taxonomic levels. Minocycline greatly mitigated these changes caused by ethanol, making the microbial distribution more similar to the control. The effects of minocycline are reflected at almost every taxonomic level, relative abundance of microbiota changed by ethanol, including Ruminococcus, Odoribacter, S24–7, Ruminococcaceae, Bacteroidetes, Firmicutes, was restored to normal levels with the help of minocycline.
Gut microbiota plays an important role in maintaining the homeostasis of the intestinal barrier.39, 40 Many studies have shown that when the stability of microbiota is damaged, the structure and function of the intestinal barrier are often accompanied.41 Consistent with these studies, we found that ethanol induced damage to intestinal structures and loss of TJPs, which was restored by minocycline. These changes further helped to confirm the influence of ethanol and minocycline on the gut microbiota and provided effective clues to explore the association between the microbiota and anxiety-like behaviour. Injury to intestinal barrier may lead to the increase of pro-inflammatory cytokines in the circulation, and two types of cytokines, endotoxin and IL-6, were detected in our study.
The effect of ethanol on the GABA system is complex, and different exposure duration may produce different consequences. Ethanol also has different effects on the synthesis, transport and receptor binding of GABA. As a result, we detected concentration, the synthesis catalysis enzyme and the important receptor of GABA in the prefrontal cortex. Chronic ethanol exposure inhibited the expression of receptor GABRA1 and synthesis catalytic enzyme GADs, suggesting that chronic ethanol exposure began to inhibit the function of the GABA system. Minocycline restored the expression of GABRA1 significantly and GAD1 to a certain extent, indicating that minocycline could reduce the effects ethanol on GABA, and GABRA1 may play an important role. Studies have also shown that GABA or GABAA receptor has a neuroprotective effect and could reduce neuronal apoptosis.42, 43 The changes of apoptosis-related proteins and synaptic proteins further helped to confirm that minocycline could alleviate the effects of ethanol on the GABA system.
Oral minocycline treatment effectively alleviated the effects of chronic ethanol exposure on gut microbiota and the GABA system, especially GABRA1, suggesting that gut microbiota plays an important role in ethanol-induced mental disorder. We performed statistical analysis of the single microbial community that significantly changed in this study. Because it is difficult to target specific microbial communities with existing techniques, we introduced correlation analysis and causal mediation analysis commonly used in epidemiological studies. Analysis showed that those species were strongly correlated with the expression of GABRA1. The expressions of GABRA1 and GADs were reported to be regulated by inflammatory cytokines.44 Combined with the results of peripheral pro-inflammatory cytokines, we speculated that endotoxin and IL-6 mediated the association between the gut microbiota and GABRA1. The mediation analysis results confirmed our speculation, and endotoxin and IL-6 play a mediation role. Interestingly, we found that endotoxin and IL-6 had mediated the effects of different microbiota on GABRA1 expression, which is worth further exploration in the future.
There are some limitations to this manuscript: The results were based on the analysis of relative abundances that do not adjust for the compositional nature of next-generation sequencing data. Results based on relative abundance can be misleading and unpredictable.45
5 CONCLUSIONS
Taken together, these results suggested that gut microbiota and consequent increased endotoxin and IL-6 might be promising candidates for the therapy of ethanol-associated mental diseases in the future.
ACKNOWLEDGEMENTS
We thank Dr. Wenting Guo from School of Tongji Medical College, Huazhong University of Science and Technology, for helping with the statistical analysis. This work was supported by the National Natural Science Foundation of China (grant number 82101979 to Xiaolong Wang), the Department of Education of Liaoning Province, China (grant number QN2019037 to Xiaolong Wang), the National Natural Science Foundation of China (grant number 81172904 to Guohua Zhang), the Natural Science Foundation of Liaoning Province, China (grant number 201102299 to Guohua Zhang), the Shenyang Scientific and Technological Plan, China (grant number F11-264-1-67 to Guohua Zhang), and the Doctoral Start-up Foundation of Liaoning Province, China (grant number 2019-BS-145 to Hao Yu).
CONFLICT OF INTEREST
All authors declare that they have no conflict of interest. The funders of the study had no role in study design, data collection, data analysis, data interpretation or writing of the report. All authors had full access to all the data in the study.
AUTHOR CONTRIBUTIONS
All authors contributed to and have approved the final manuscript. Hui Yao, Guohua Zhang and Xiaolong Wang conceived and designed the study. Hui Yao, Dalin Zhang, Hao Yu, Hui Shen, Xinze Lan and Xiaohuan Chen performed the experiments and analysed the data. Hui Yao and Dalin Zhang drafted the manuscript. Xu Wu, Guohua Zhang and Xiaolong Wang provided critical revision. All authors read and approved the final manuscript.
Open Research
DATA AVAILABILITY STATEMENT
The raw data of 16S rRNA sequencing were deposited in the NCBI Sequence Read Archive (SRA) database under accession number PRJNA825717 (https://www.ncbi.nlm.nih.gov/bioproject/PRJNA825717).


