Investing in Netflix: Accounting for Content Assets*
Accepted by Seda Oz. I thank the associate editor, Seda Oz, and two anonymous reviewers for helpful comments. I appreciate financial support from the William Birchall Foundation Fellowship in Accounting. All errors are my own. This case has been written on the basis of published sources only. Consequently, the interpretation and perspectives presented in this case are not necessarily those of Netflix, Inc., or any of its employees.
ABSTRACT
enThis case describes an equity investment scenario in the context of the COVID-19 pandemic. A fictional decision-maker, Amandeep Singh, is considering whether or not to invest in Netflix, Inc. (Netflix). Netflix has benefited from changing habits during the pandemic, but Singh questions whether those benefits will persist post-pandemic. To make his decision, Singh needs to perform a qualitative analysis of the video streaming industry and Netflix itself before moving to a quantitative analysis of Netflix's performance. To properly assess performance, Singh needs to fully understand Netflix's accounting methods and estimates for content assets—especially original content. The case is ideally suited to an MBA or Executive MBA audience. Students can easily engage with the case since they will be familiar with the company and industry. This familiarity allows for a general discussion about the industry's future and key success factors. The case provides an opportunity to cover core financial statement analysis concepts and drives home the importance of understanding accounting judgments when assessing firm performance.
RÉSUMÉ
frCette étude de cas présente un scénario d'investissement en actions dans le contexte de la pandémie de COVID-19. Un décideur fictionnel, Amandeep Singh, se demande s'il doit investir ou non dans Netflix, Inc. (Netflix). Netflix a tiré profit des changements d'habitudes survenus durant la pandémie, mais M. Singh n'est pas certain que ces avantages persisteront après la pandémie. Pour prendre sa décision, M. Singh doit réaliser une analyse qualitative du secteur de la diffusion vidéo en continu et de l'entreprise Netflix elle-même, et effectuer par la suite une analyse quantitative du rendement de Netflix. Pour évaluer le rendement de façon adéquate, M. Singh doit comprendre pleinement les méthodes comptables et les estimations des actifs de contenu de Netflix – en particulier le contenu original. Cette étude de cas convient parfaitement aux étudiants et aux cadres inscrits au MBA. Les étudiants peuvent facilement l'aborder, car ils connaissent la compagnie et le secteur d'activité. Cette familiarité favorise une discussion générale à propos de l'avenir et des principaux facteurs de succès de l'industrie. Cette étude de cas fournit une occasion de présenter les concepts de base de l'analyse des états financiers et fait ressortir l'importance de comprendre les jugements comptables dans le cadre de l'évaluation du rendement d'une compagnie.
INTRODUCTION
We live in uncertain times with restrictions on what we can do socially and many people are turning to entertainment for relaxation, connection, comfort and stimulation. (Netflix, Inc., 2020b)
In early December 2020, Amandeep Singh sat in front of his laptop after finishing a Zoom call with members of his technical team. He worked as a project manager for a large US software development firm. Singh missed the days of face-to-face meetings and casual banter in the lunch room—all dispensed with during the changes wrought by the COVID-19 pandemic.
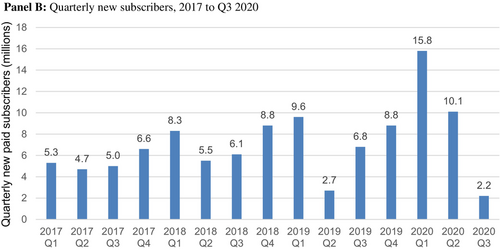
Spending so much time online caused Singh to consider which companies would prosper during the pandemic, with many countries experiencing pandemic lockdowns or restrictions on public gatherings. As Singh wound down at the end of his workday, he scrolled through streaming options to find a television show of interest. He reasoned that many people would be in the same position, using streaming to pass the time that used to be spent with friends, dining out, or attending live entertainment. Singh began to consider whether Netflix, Inc. (Netflix) would be a company well positioned to benefit from the pandemic. Supporting his line of thinking, Singh found that Netflix added over 26 million new paying subscribers in the first half of 2020—more than double the 12 million subscribers that Netflix added over the same period in 2019 (Netflix, Inc., 2020b).
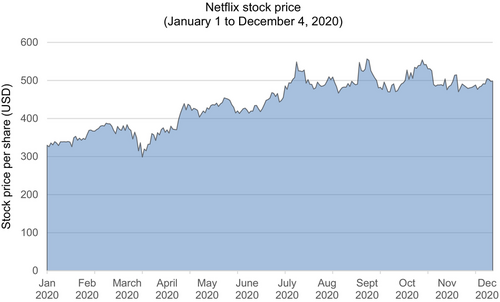
Singh had been investing since his teenage years, inspired by the example of successful investors like Warren Buffett. He saw investing as a long-term proposition and aimed to develop a comprehensive understanding of companies before investing. His key investment goal was to find undervalued companies whose stock price would rise over the long term. See Exhibit 1 for Singh's investment profile. Netflix's stock had initially dropped to $300/share as the pandemic surged in March 2020, but its stock rebounded to $550/share before falling back to $500/share in recent days.1 Singh viewed the recent decline in share price as a buying opportunity if he acted fast. See Exhibit 2 for a Netflix stock price chart for 2020.
EXHIBIT 1. Investment profile for Amandeep Singh
Age: 50.
Investment philosophy: Find high-quality, undervalued companies and invest in those companies for the long term.
Investment experience: Singh has been investing in stocks and bonds for more than 30 years.
Time horizon: Singh intends to retire at age 65, at which point he will begin to draw down his investments to help cover his retirement expenses.
Risk tolerance: High. Singh invests solely in equity securities and is comfortable with taking risk if the potential return justifies the risk.
Investment objectives: Singh focuses on capital appreciation rather than income.
Portfolio size: $350,000.
Current portfolio breakdown: US equities 40%, international equities 40%, cash 20%.
Historical rate of return: Singh has achieved annualized returns averaging 10.6% over 1990–2019. This return slightly exceeds the average annualized return of 10.1% on the S&P 500 (see https://www.officialdata.org/us/stocks/s-p-500/1990?amount=100&endYear=2019 for S&P 500 returns). Singh's worst year of returns was −42%, in 2008. His best year of returns was 36%, in 1995.
EXHIBIT 2. Netflix stock price chart
Source: Created by the author from stock price data for January 1, 2020, to December 4, 2020. Downloaded from Yahoo Finance (https://finance.yahoo.com/quote/NFLX/history?p=NFLX).
After reading through recent analyst reports on Netflix, Singh was surprised by the wide divergence of opinion about the company's prospects. He focused on two conflicting reports. First, CFRA, an independent equity research firm, published a $600/share target price (CFRA, 2020). In contrast, Morningstar, Inc., an American investment research firm, argued that Netflix shares were heavily overvalued. In fact, this firm believed the fair value of each share was $200, a far cry from Netflix's current share price (Morningstar, Inc., 2020). Relatedly, Singh remembered a recent Forbes article with the gloomy title “All the Reasons Why Netflix Is Doomed” (Trainer, 2019a).
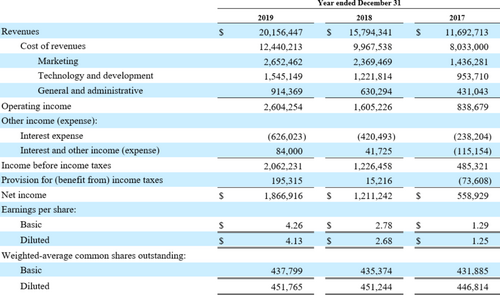
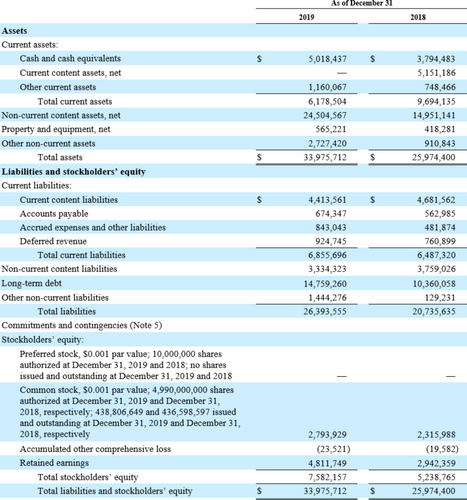
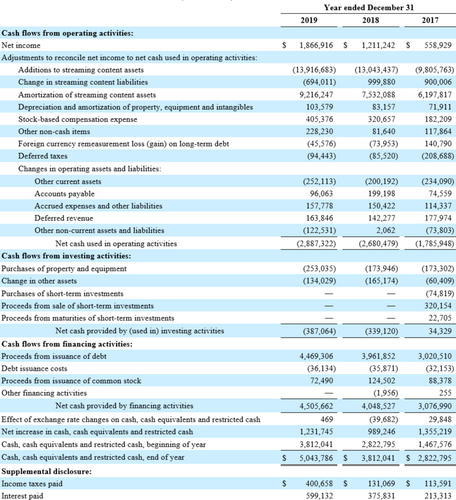
Singh needed to perform his own analysis of Netflix to reach an investment decision. He started by reviewing Netflix's 2019 financial statements (see Exhibit 3). Noting that content represented the majority of Netflix's assets, he wanted to develop a deep understanding of these particular assets. He knew he would need to make a quick decision to take advantage of the recent drop in share price. Singh poured himself a cup of coffee and started reading.
EXHIBIT 3. Netflix consolidated financial statements
Consolidated Statements of Operations
Consolidated Statements of Comprehensive Income
Consolidated Balance Sheets
Consolidated Statements of Cash Flows
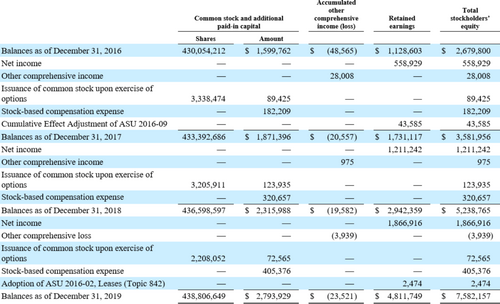
Consolidated Statements of Stockholders' Equity
Notes: See accompanying notes to consolidated financial statements.
Source: Netflix, Inc. (2019, pp. 41–45).
COMPANY BACKGROUND
Netflix was founded in 1997 by Reed Hastings and Marc Randolph (Netflix, Inc., n.d.-a). In its early years, Netflix operated as a DVD rental company through the mail and evolved to be the leading streaming service provider. Netflix differentiated itself by emphasizing unlimited usage and personalized recommendations.
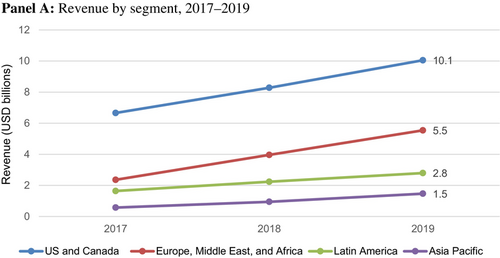
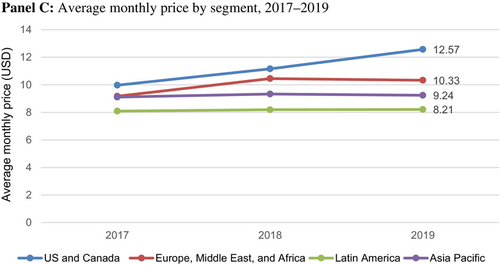
Netflix became a public company by listing on the NASDAQ in 2002, using NFLX as its ticker symbol. In 2007, Netflix introduced digital streaming of television shows and movies. In 2010, Netflix began its international expansion by making its services available in Canada. By 2016, Netflix was available in over 190 countries. In recent years, Netflix began disclosing information for four geographic segments: (1) United States and Canada; (2) Europe, Middle East, and Africa; (3) Latin America; and (4) Asia Pacific. See Exhibit 4 for segment data for 2017–2019.
EXHIBIT 4. Netflix segment data
Source: Created by the author from data in Netflix, Inc. (2019, pp. 21–22).
In 2012, Netflix generated its first piece of original content—a comedy special, “Bill Burr: You People Are All the Same.” Previously, all content had been licensed from outside providers. Netflix then moved heavily into original content with “House of Cards,” “Hemlock Grove,” and “Orange Is the New Black.” By 2020, Netflix was setting aside approximately 38% of content spending for original content, which was up from 7% of spending in 2014. Netflix users spent approximately 33% of their time watching original content, with the remainder spent on licensed content (Spangler, 2021). In 2019, Netflix won three Academy Awards (Oscars) for “Roma,” a dramatic film set in Mexico City (Roxborough, 2019).
Impact of COVID-19 Pandemic
The COVID-19 pandemic has dramatically changed everyday activities worldwide. In particular, many countries have enforced lockdowns, which moved more entertainment from live shows and movie theaters to the home. Key beneficiaries of these trends have been streaming services, as people have sought alternate sources of home entertainment.
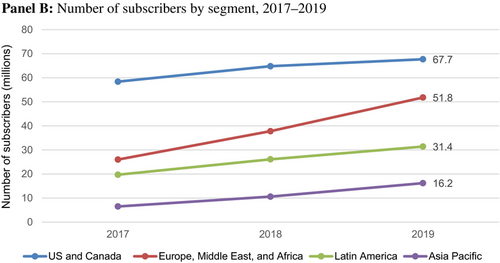
In Q1 2020, Netflix added 15.8 million new subscribers, which was more than double its forecast of 7.0 million. Similarly, in Q2 2020, it added 10.1 million new subscribers versus its forecast of 7.5 million. In Q3 2020, subscriber growth slowed considerably, with 2.2 million new subscribers versus its forecast of 2.5 million. The company forecasts 6.0 million new subscribers in Q4 2020 (Netflix, Inc., 2020c). See Exhibit 5 for subscriber information.
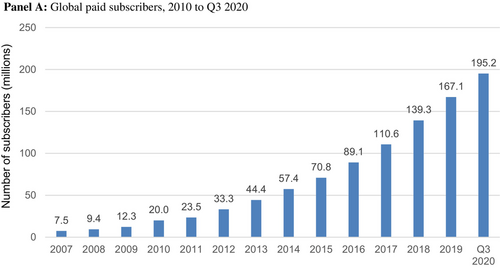
EXHIBIT 5. Netflix subscriber information
Source: Panel A: Created by the author from data in Netflix, Inc. (2010, p. 21; 2014, p. 16; 2019, p. 19; 2020a, p. 20). Panel B: Created by the author from data in Netflix, Inc. (2020c, p. 2).
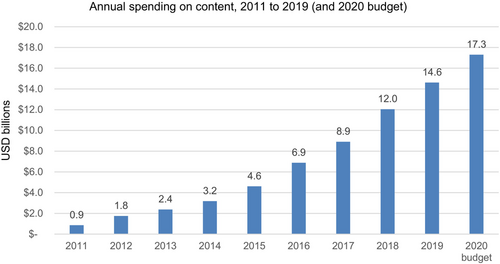
The pandemic has also impacted Netflix's ability to film new content. In early 2020, production was brought to a standstill on many titles. When filming returned, Netflix encountered challenging safety protocols that slowed production and increased costs. As a result of these challenges, Netflix's 2020 spending on content is expected to be $3–4 billion below what was budgeted. See Exhibit 6 for content spending.
INDUSTRY BACKGROUND
Streaming offers the ability to watch content on demand rather than waiting for a scheduled time like traditional television. In the early years of streaming, slow Internet connectivity and data limits provided barriers to growth. However, in recent years, these barriers have largely been removed as high-speed Internet connections became commonplace. The surge of unlimited data plans also allows users to consume as much content as desired.
In recent years, a larger proportion of customers began moving away from traditional cable television services and toward the convenience of streaming services. By 2020, 62% of US adults subscribed to at least one streaming service (Watson, 2020). Meanwhile, US customers of traditional cable declined by 5%–10% each year (Spangler, 2020a). The rise of Internet-connected smartphones has led to more content being accessed through these devices; however, 70% of content is still watched on a television. The remainder is split between computers and smartphones/tablets (Kafka, 2018).
CONTENT
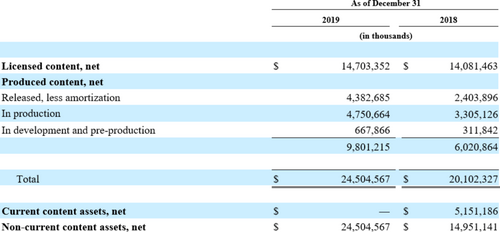
Netflix's primary assets relate to its content library. In fiscal 2019, content assets accounted for over 70% of total assets ($24.5 billion of $34.5 billion of total assets). Initially, Netflix licensed only existing content from other providers. For example, it licensed the television show “Friends” for 2019 from WarnerMedia for a rumored cost of $100 million before the show moved to HBO Max in 2020 (Bloom, 2018). In recent years, Netflix has moved heavily into generating its own content. However, users still watch licensed content for the majority of watching hours, with “Friends,” “The Office,” and “Grey's Anatomy” being some of Netflix's most popular shows (Trainer, 2019b).
With the proliferation of streaming services, content licensing has become more challenging and expensive. NBCUniversal outbid Netflix for the streaming rights to “The Office” with a bid of $500 million for a license from 2021 to 2025 (Whitten, 2019a). Similarly, the $100 million price tag for “Friends” in 2019 was over triple the $30 million annually that Netflix paid for its licensing from 2015 to 2018 (E. Lee, 2018). When The Walt Disney Company (Walt Disney) introduced the Disney+ streaming service in 2019, it stopped licensing its content to Netflix (Whitten, 2019b). This included Marvel superhero movies, Star Wars, Pixar movies, and National Geographic.
The Streaming Wars
Until recently, Netflix had faced limited competition—especially in the United States, its home market. Prime Video, provided by Amazon, entered the streaming market in 2011, where it was provided free of charge to Amazon Prime customers. (Amazon Prime gave unlimited fast, free shipping to members.) Hulu, now owned by Walt Disney, launched in 2007, focusing on television programming with advertising but at a lower price than key competitors. Hulu announced a premium ad-free package in September 2015 (Lieberman, 2015).
Recent years have seen dramatic growth in the number and diversity of streaming services. A 2019 Forbes article argued that “The Streaming Wars Are Intensifying” (Feldman, 2019). The highest profile new entrant was the launch of Disney+ in November 2019—it had nearly 30 million subscribers by the end of that year (Jarvey, 2020). Disney+ carries all of Walt Disney's classic content plus content from Lucasfilms, Marvel Studios, Pixar, and National Geographic. Disney+ also features original content, with “The Mandalorian,” set in the Star Wars universe, being its highest profile release to date. Other recent new entrants were Apple TV+, which launched in November 2019 and promised all-original content before recognizing the need to license existing shows. Subscriber growth for Apple TV+ has been slow thus far. In 2020, new services launched included (1) HBO Max in May, which provided a large catalog of television (including “Friends”) and movies, with plans for original content, including a prequel to “Game of Thrones”; (2) Peacock in April with a focus on television shows, including “The Office”; and (3) Quibi in April, which focused on shorter television shows, most of which were approximately 10 min (Reilly, 2019).
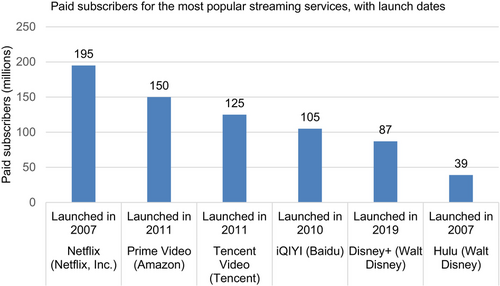
See Exhibit 7 for subscriber information for major streaming services.
EXHIBIT 7. Global subscribers by streaming service (fall 2020)
Source: Launch dates: Netflix, Inc. (n.d.-a); Prime Video (theSkimm, 2019); Tencent Video (Tencent, n.d.); iQIYI (Business Insider, 2020); Disney+ (Whitten, 2021); and Hulu (n.d.-a). Paid subscribers: Netflix, Inc. (2020c); Prime Video (Csathy, 2020); Tencent Video and iQIYI (Frater, 2021); Disney+ (Spangler, 2020b); and Hulu (Barnes, 2021).
Pricing
Netflix was generally priced higher than its key competitors in the United States (see Exhibit 8). Its original pricing was a flat fee of $7.99/month for all subscribers. In 2014, Netflix introduced three pricing tiers: basic, standard (which allowed two streams and high definition [HD]), and premium (which allowed four streams and Ultra HD). Basic increased to $8.99/month in 2019. Standard increased to $13.99/month in late 2020. Premium increased to $17.99/month, also in late 2020 (Haselton, 2020).
EXHIBIT 8. Monthly US subscription fees for services (fall 2020)
| Service | Monthly fee (USD) |
|---|---|
| Netflix | $8.99 basic—1 screen $13.99 standard—2 screens + HD $17.99 premium—4 screens + Ultra HD |
| Prime Video | $8.99 |
| Hulu | $5.99 with ads, $11.99 for ad-free |
| Disney+ | $6.99 |
| HBO Max | $14.99 |
| Apple TV+ | $4.99 |
Source: Netflix, Inc. (n.d.-b); Prime Video (Amazon.com, Inc., n.d.); Hulu (n.d.-b); Disney+ (Walt Disney, n.d.); HBO Max (WarnerMedia Direct, n.d.); and Apple TV+ (Apple, Inc., n.d.).
Accounting for Content Costs
Content costs represent the majority of Netflix's expenses. In 2019, content expenses totaled $9.2 billion, which was 50.4% of total expenses. For typical licensing deals, the accounting implications are straightforward. For example, when Netflix licensed the 2019 rights to “Friends” for $100 million, these costs would be fully recorded as an expense in 2019. Accounting for original content was much more challenging. For example, Netflix funded the production of “The Irishman,” a 209-min epic film directed by Martin Scorsese and starring Robert De Niro and Al Pacino. It had a budget of $160 million and became available on Netflix in November 2019 (Mendelson, 2019). Netflix owns the movie and can provide it to subscribers in perpetuity. The company said that 26.4 million households streamed the movie in its first week of availability, and 64.0 million households streamed it over the first month (IrishCentral, 2020; W. Lee, 2019). Singh pondered: how and when should the $160 million of production costs be amortized to expense?
In general terms, GAAP requires that expenses are matched to the revenues they help to earn. If done consistently, this matching process generates a meaningful net income (or loss) by deducting matched expenses from revenues. Many of the costs incurred that could potentially generate intangible assets like content assets are expensed under GAAP because the future value is considered too uncertain. For example, research and advertising costs must be expensed without exception. Under US GAAP, however, certain costs, such as software development, content licensing fees, and film and television production costs, can be capitalized. Singh wondered why it made sense for content costs to be capitalized when many other similar costs were expensed—how were content costs different?
Netflix disclosed that more than 90% of an average content asset was amortized to expense over the first 4 years of availability, which equated to a declining balance amortization rate of approximately 45% annually. They base their amortization on observed historical viewing patterns or estimated future viewing patterns. Amortization starts when a title is made available to subscribers. Netflix used this accelerated amortization method since viewership was concentrated soon after release. Straight-line amortization is permitted as an alternative, which amortizes an equal amount to expense each year over the estimated period of use. Singh wondered what the impact would be if straight-line amortization were used instead. Which amortization method would be most appropriate for licensed content and original content?
Companies need to ensure that assets are not recorded in excess of the amount that can be generated through the asset's future use or via an asset sale. Netflix needed to conduct an impairment test on content assets when conditions indicated that values may be impaired. For original content, assets were written down when book value exceeded fair value, which could be determined based on discounted cash flows stemming from the asset (i.e., value-in-use). For Netflix, impairment testing of content assets was challenging since customers did not pay to license specific television shows or movies; rather, customers paid subscription fees that provided access to the entire content library, which included both licensed and original content.
See Exhibit 9 for Netflix's accounting policy for streaming content and disclosures of its streaming assets.
EXHIBIT 9. Netflix accounting for streaming content
Streaming Content
The Company acquires, licenses and produces content, including original programming, in order to offer members unlimited viewing of TV series and films. The content licenses are for a fixed fee and specific windows of availability. Payment terms for certain content licenses and the production of content require more upfront cash payments relative to the amortization expense. Payments for content, including additions to streaming assets and the changes in related liabilities, are classified within “Net cash used in operating activities” on the Consolidated Statements of Cash Flows.
The Company recognizes content assets (licensed and produced) as “Non-current content assets, net” on the Consolidated Balance Sheets. For licenses, the Company capitalizes the fee per title and records a corresponding liability at the gross amount of the liability when the license period begins, the cost of the title is known and the title is accepted and available for streaming. For productions, the Company capitalizes costs associated with the production, including development costs, direct costs, and production overhead. Participations and residuals are expensed in line with the amortization of production costs.
Based on factors including historical and estimated viewing patterns, the Company amortizes the content assets (licensed and produced) in “Cost of revenues” on the Consolidated Statements of Operations over the shorter of each title's contractual window of availability or estimated period of use or 10 years, beginning with the month of first availability. The amortization is on an accelerated basis, as the Company typically expects more upfront viewing, for instance due to additional merchandising and marketing efforts, and because film amortization is more accelerated than TV series amortization. On average, over 90% of a licensed or produced streaming content asset is expected to be amortized within 4 years after its month of first availability. The Company reviews factors impacting the amortization of the content assets on an ongoing basis. The Company's estimates related to these factors require considerable management judgment.
The Company's business model is subscription-based as opposed to a model generating revenues at a specific title level. Content assets (licensed and produced) are predominantly monetized as a group and therefore are reviewed in aggregate at a group level when an event or change in circumstances indicates a change in the expected usefulness of the content or that the fair value may be less than unamortized cost. To date, the Company has not identified any such event or changes in circumstances. If such changes are identified in the future, these aggregated content assets will be stated at the lower of unamortized cost or fair value. In addition, unamortized costs for assets that have been, or are expected to be, abandoned are written off.
Content Assets
As of December 31, 2019, approximately $5,793 million, $3,733 million, and $2,518 million of the $14,703 million unamortized cost of the licensed content is expected to be amortized in each of the next 3 years. As of December 31, 2019, approximately $1,552 million, $1,187 million, and $882 million of the $4,383 million unamortized cost of the produced content that has been released is expected to be amortized in each of the next 3 years.
As of December 31, 2019, the amount of accrued participations and residuals was not material.
Source: Netflix, Inc. (2019, pp. 47–52).
QUANTITATIVE ANALYSIS
Singh also wanted to complete a quantitative analysis of Netflix's financial statements. He often started by performing vertical analysis of the company's income statement along with analysis of key ratios such as ROA and ROE. In addition, he believed it was important to analyze the company's past revenue growth and expectations for the future.
Singh knew it would be helpful to place Netflix's performance in the context of the broader industry or key competitors. Complicating his analysis, Singh realized that Netflix was among the only “pure” video streaming entities in the market. For most key competitors, video streaming represented a smaller component of a larger overall business. For example, Prime Video was just one component of a Prime membership with Amazon, which itself was a single component of a larger business that included online sales and Internet hosting.
Next, to aid in his investment decision, Singh wanted to calculate the value of a Netflix share to determine whether the market was undervaluing or overvaluing Netflix. Singh could determine a price based on an appropriate multiple of earnings per share (i.e., price-to-earnings ratio). He knew that shares of an average company on the NASDAQ exchange were currently trading at approximately 24 times earnings.2 Netflix traded at a higher price-to-earnings multiple due to its expected growth profile. Currently, Netflix was trading at 121 times its 2019 diluted EPS of $4.13. Over time, Netflix's price-to-earnings ratio was expected to fall as its growth trajectory lessened; Singh expected the ratio to drop to 50 over the upcoming years. Netflix could also be valued based on a multiple of EBITDA. Analysts often used a multiple of EBITDA to determine a firm's enterprise value (EV), which is calculated as the sum of market value of equity (i.e., market capitalization) and total debt, less cash. In 2019, Netflix had an EV/EBITDA multiple of approximately 56, based on EV of approximately $150 billion and EBITDA of approximately $2.7 billion. Singh similarly expected this multiple to fall as Netflix's growth slowed. He expected an EV/EBITDA of about 30 over the long term.
CONCLUSION
Singh rubbed his eyes as he finished reading an industry report on streaming services. Netflix still had the largest paid subscriber base despite new entrants into the market in recent years. Netflix certainly had benefited from subscriber growth during the pandemic. Singh needed to make a decision soon—should he invest in Netflix?
ASSIGNMENT QUESTIONS
- Assess the potential impact of the loss of key shows like “Friends” and “The Office” on Netflix's subscriber base. Calculate the financial effect of the content loss on the company's revenue. What strategies can Netflix use to retain subscribers? What other key risks and opportunities does Netflix face?
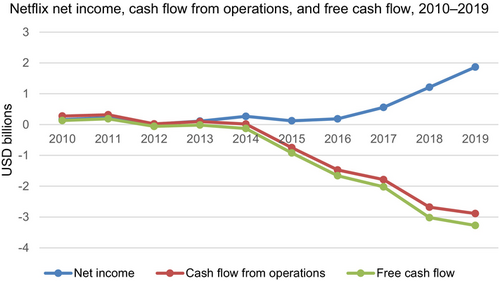
- Perform a quantitative analysis of Netflix's financial statements using ratio analysis. What ratios would be the most informative for Singh's investment decision? What insights can you draw based on your calculations? What caused the big difference between net income and operating cash flow in recent years? (See Exhibit 10).
- Content assets: Should licensed and original content costs be capitalized? Why? What amortization method should be used for each (accelerated declining balance or straight-line)? How would Netflix's financial statements be affected if straight-line amortization was used for its content assets? How would future cash flows be calculated for specific content?
- Determine the value of a share of Netflix stock. Is Netflix undervalued or overvalued?
- Should Singh invest in Netflix? Why or why not?
EXHIBIT 10. Netflix net income, cash flow from operations, and free cash flow
| Year | Net income (USD billions) | Cash flow from operations (USD billions) | Free cash flow (USD billions) |
|---|---|---|---|
| 2010 | 0.16 | 0.28 | 0.13 |
| 2011 | 0.23 | 0.32 | 0.19 |
| 2012 | 0.02 | 0.02 | −0.06 |
| 2013 | 0.11 | 0.10 | −0.02 |
| 2014 | 0.27 | 0.02 | −0.13 |
| 2015 | 0.12 | −0.75 | −0.92 |
| 2016 | 0.19 | −1.47 | −1.66 |
| 2017 | 0.56 | −1.79 | −2.02 |
| 2018 | 1.21 | −2.68 | −3.02 |
| 2019 | 1.87 | −2.89 | −3.27 |
|
|||
Source: Created by the author from data in Netflix, Inc. (2014, p. 14; 2019, p. 18).
TEACHING NOTES
Teaching notes for instructional cases are not published in the journal but are made available to full CAAA member subscribers via the CAAA website. If you are a full member of the CAAA and wish to obtain a copy of the Teaching Notes, please go to https://www.caaa.ca/en/journals-and-research/accounting-perspectives-ap/ and click on “Teaching Notes”. You will then be directed to your member login where you can access and download the notes.
REFERENCES
- 1 All values are stated in US dollars.
- 2 See https://ycharts.com/companies/NDAQ/pe_ratio


