The significance of follow-up serum uric acid levels in predicting all-cause mortality and cardiovascular mortality in peritoneal dialysis patients
Yaomin Wang and Qilong Zhang contributed equally in the study.
Funding information: Grant of National Natural Science Foundation of P.R. China, Grant/Award Number: 81900694; Grant of Natural Science Foundation of Zhejiang Province, Grant/Award Number: Q19H050030; Medical and Health Science and Technology Project, Grant/Award Number: 2020380978; Public Applied Research Project of Huzhou City, Grant/Award Number: 2019GY72
Abstract
Background
This study aimed to analyze the change of serum uric acid (SUA) level post peritoneal dialysis (PD), and the correlation between follow-up SUA and prognosis in patients with PD.
Methods
A total of 1402 patients with PD were evaluated. We graded SUA levels into four grades at baseline, 6 months, 12 months, 18 months, and 24 months post PD, and then compared all-cause mortality and cardiovascular mortality among patients with different SUA grades at each time point. Kaplan–Meier and Cox proportional-hazards regression models were used in the analysis.
Results
The SUA levels were 7.97 ± 1.79, 7.12 ± 1.48, 7.05 ± 1.33, 7.01 ± 1.30, and 6.93 ± 1.26 mg/dl at baseline, 6, 12, 18, and 24 months, respectively. There was significant difference on all-cause mortality among patients with PD with different graded SUA levels at 6 months post PD (p = 0.010), and the all-cause mortality was lowest in patients with the grade of 5.65 mg/dl ≤ SUA <7.13 mg/dl.
Conclusion
SUA level decreased after PD during follow-up. At 6 months post PD, the grade of 5.65 mg/dl ≤ SUA <7.13 mg/dl was appropriate for better patients' survival.
1 BACKGROUND
Uric acid (UA) is the final product of purine nucleotides metabolism. Purine metabolism disorder or the abnormal renal UA excretion can affect serum UA (SUA) level. Hyperuricemia is common in patients with renal failure, which is caused by impaired SUA excretion in the kidney [1, 2]. In addition, hyperuricemia has been reported to be closely correlated with cardiovascular events and mortality in patients with chronic renal failure [3-5]. Peritoneal dialysis (PD) is one of the main renal replacement therapies, which was increasingly used in patients of end-stage renal disease in China [6]. The mortality of patients with PD is still high, which is affected by many risk factors [7]. A retrospective study of 156 patients with PD showed that elevated SUA level was an independent risk factor for all-cause mortality [8]. Another cohort in Chinese population showed that elevated SUA level was an independent risk factor for all-cause mortality and cardiovascular mortality in male patients with PD [9, 10]. However, the results of 2264 patients with PD from seven centers in China showed that the predictive value of SUA as a continuous categorized variable decreased or disappeared after adjusting for traditional cardiovascular risk factors related to uremia among patients with PD [11].
The above studies on the correlation between SUA level and all-cause mortality and cardiovascular mortality in patients with PD were mainly based on the results of baseline SUA level [8-11]. This study analyzed the change of SUA level post PD, and the correlation between follow-up SUA levels and prognosis of patients with PD in our center. We studied the effects of SUA on all-cause mortality and cardiovascular mortality and explored the appropriate SUA level in different periods of PD therapy to improve the patients' survival.
2 SUBJECTS AND METHODS
All the patients who received PD catheterization and maintaining PD therapy in our hospital from March 2, 2001 to March 8, 2017 were screened. The exclusion criteria were as follows: (1) the duration of PD treatment was less than 6 months; (2) lack of any one of the information including outcome, follow-up time, or SUA at 6 months of PD; (3) lack of more than five values of key indicators during follow-up; (4) conversion to hemodialysis; and (5) younger than 18 years old at the start of PD.
We collected the data at the start of PD including gender, age, body mass index (BMI), SUA, C-reactive protein, hemoglobin, intact parathyroid hormone, systolic blood pressure (SBP), diastolic blood pressure (DBP), Charlson comorbidity index (CCI), creatinine clearance rate (Ccr), and serum creatinine, potassium, calcium, phosphorus, albumin, triglyceride, total cholesterol, high-density lipoprotein cholesterol, low-density lipoprotein cholesterol, alkaline phosphatase, and serum glucose. We also collected SUA levels at 6, 12, 18, and 24 months after PD, PD duration and patients' outcomes. The sample mean standard deviation method was used to grade SUA during the follow-up period.
2.1 Statistical analysis
Statistical analysis was performed using Graphpad Prism 8.0 and SPSS 23.0 software package. The results were expressed as means ± standard deviation for normally distributed continuous variables, median values (interquartile ranges) for non-normally distributed continuous variables, or proportions for categorical variables. Student's t-test was used for comparisons of normally distributed continuous variables. Comparisons of non-normally distributed continuous variables were performed using Mann–Whitney U-test. Chi-square test was used for comparisons of categorical variables. The difference of SUA levels at different time points during the PD follow-up period was compared by repeated measurement variance analysis. The mean standard deviation method was used to grade SUA during the follow-up period. SUA levels and the risks of death were analyzed by Kaplan–Meier and Cox proportional-hazards regression models. We reported the multivariable adjusted hazards ratios (HR) with 95% CIs. All probabilities were two-tailed, and the level of significance was set at 0.05.
3 RESULTS
In this retrospective study, 2320 patients with PD were screened while 918 patients were excluded. Among the patients excluded, 269 patients were followed up for less than 6 months, 263 patients were converted to hemodialysis, 97 patients had no key clinical information, 264 patients had no complete data of research indicators, and 25 patients were under 18 years old at the start of PD therapy. A total of 1402 patients were included. There were 763 males (54.42%) and 639 females (45.58%). Their average age at the start of PD was 49.50 ± 14.20 years old. There were 317 (22.61%) patients received renal transplantation, and 22 (1.57%) patients lost follow-up.
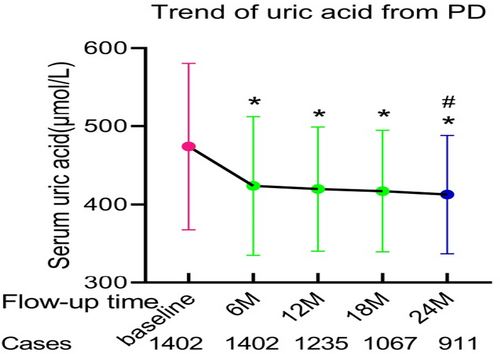
The trend of SUA level during PD follow-up was shown in Figure 1. The SUA levels were 7.97 ± 1.79 mg/dl at baseline, 7.12 ± 1.48 mg/dl at 6 months, 7.05 ± 1.33 mg/dl at 12 months, 7.01 ± 1.30 mg/dl at 18 months, and 6.93 ± 1.26 mg/dl at 24 months. There were significant differences in SUA levels between baseline and each follow-up time (6, 12, 18 or 24 months post PD) (p < 0.01), and there was statistical difference between 6 months and 24 months post PD (p < 0.01).

During median follow-up time of 31 (18, 49) months, 173 (12.34%) all-cause deaths occurred, including 68 (39.3%) cardiovascular deaths, 20 (11.6%) deaths with infectious diseases, 85 (49.1%) deaths with other causes. The characteristics of the patients with all-cause deaths and cardiovascular deaths were shown in Table 1. The values of age, DM percentage, SUA at 6 months, serum glucose and CCI were higher in patients with all-cause deaths than the other patients; while the values of follow-up time, baseline SUA, DBP, and serum levels of creatinine, phosphorus and albumin were lower in patients with all-cause deaths than the other patients. The values of age, DM percentage, SBP, CCI, and serum levels of triglyceride and glucose were higher in patients with cardiovascular deaths than the other patients; while the values of follow-up time, baseline SUA, serum levels of creatinine and albumin were lower in patients with cardiovascular deaths than the other patients.
| Variants | Total (n = 1402) | Grouped by all-cause death | Grouped by cardiovascular death | ||||
|---|---|---|---|---|---|---|---|
| All-cause death (173) | Other (1229) | p value | Cardiovascular death (68) | Other (1334) | p value | ||
| Follow-up duration (m) | 36.11 ± 23.26 | 30.82 ± 18.04 | 36.85 ± 23.81 | 0.001 | 30.35 ± 19.47 | 36.40 ± 23.40 | 0.036 |
| Male (N, % ) | 763 (54.42) | 90 (52.0) | 673 (54.76) | 0.499 | 42 (61.76) | 721 (54.05) | 0.213 |
| Age (y) | 49.50 ± 14.20 | 61.27 ± 13.24 | 47.84 ± 13.53 | <0.001 | 58.57 ± 13.36 | 49.04 ± 14.09 | <0.001 |
| DM (N, % ) | 199 (14.1) | 44 (25.4) | 155 (12.6) | <0.001 | 27 (39.7) | 172 (12.8) | <0.001 |
| SUA (baseline) (mg/dl) | 7.97 ± 1.79 | 7.65 ± 1.91 | 8.01 ± 1.77 | 0.014 | 7.52 ± 1.66 | 7.99 ± 1.79 | 0.034 |
| SUA (PD 6 m) (mg/dl) | 7.12 ± 1.48 | 7.38 ± 1.81 | 7.08 ± 1.43 | 0.015 | 7.30 ± 1.91 | 7.11 ± 1.46 | 0.303 |
| SUA (PD 12 m) (mg/dl) | 7.05 ± 1.33 | 7.11 ± 1.43 | 7.04 ± 1.32 | 0.569 | 6.98 ± 1.18 | 7.06 ± 1.34 | 0.678 |
| SUA (PD 18 m) (mg/dl) | 7.01 ± 1.30 | 7.15 ± 1.33 | 6.99 ± 1.30 | 0.186 | 7.03 ± 1.23 | 7.01 ± 1.31 | 0.932 |
| SUA (PD 24 m) (mg/dl) | 6.93 ± 1.26 | 6.96 ± 1.47 | 6.93 ± 1.24 | 0.792 | 7.10 ± 1.43 | 6.93 ± 1.26 | 0.400 |
| BMI (kg/m2) | 21.52 ± 3.26 | 21.63 ± 3.51 | 21.50 ± 3.22 | 0.633 | 22.27 ± 3.16 | 21.48 ± 3.26 | 0.051 |
| Serum creatinine (mg/dl) | 8.54 ± 3.16 | 7.66 ± 3.02 | 8.67 ± 3.16 | <0.001 | 7.62 ± 2.54 | 8.59 ± 3.18 | 0.014 |
| Potassium (mmol/L) | 4.54 ± 0.70 | 4.51 ± 0.71 | 4.54 ± 0.70 | 0.590 | 4.50 ± 0.70 | 4.54 ± 0.70 | 0.645 |
| Calcium (mmol/L) | 2.08 ± 0.25 | 2.10 ± 0.23 | 2.08 ± 0.26 | 0.504 | 2.11 ± 0.22 | 2.08 ± 0.25 | 0.467 |
| Phosphorus (mmol/L) | 1.82 ± 0.49 | 1.72 ± 0.54 | 1.83 ± 0.26 | 0.007 | 1.74 ± 0.48 | 1.82 ± 0.49 | 0.191 |
| Albumin (g/L) | 36.92 ± 5.32 | 35.29 ± 5.23 | 37.15 ± 5.30 | <0.001 | 35.36 ± 5.51 | 37.00 ± 5.30 | 0.013 |
| Triglyceride (mmol/L) | 1.54 ± 0.97 | 1.65 ± 1.02 | 1.53 ± 0.97 | 0.139 | 1.80 ± 1.24 | 1.53 ± 0.96 | 0.027 |
| Total cholesterol (mmol/L) | 4.31 ± 1.19 | 4.42 ± 1.34 | 4.29 ± 1.17 | 0.172 | 4.11 ± 1.36 | 4.30 ± 1.18 | 0.327 |
| High-density lipoprotein cholesterol (mmol/L) | 1.11 ± 0.35 | 1.09 ± 0.37 | 1.11 ± 0.35 | 0.42 | 1.05 ± 0.33 | 1.11 ± 0.35 | 0.18 |
| Low-density lipoprotein cholesterol (mmol/L) | 2.38 ± 0.87 | 2.44 ± 0.98 | 2.37 ± 0.85 | 0.307 | 2.45 ± 1.00 | 2.37 ± 0.86 | 0.477 |
| Alkaline phosphatase (U/L) | 78.52 ± 52.85 | 82.74 ± 58.11 | 77.92 ± 52.07 | 0.262 | 79.49 ± 29.89 | 78.48 ± 53.77 | 0.876 |
| Glucose (mmol/L) | 4.82 ± 1.20 | 5.33 ± 2.00 | 4.74 ± 1.03 | <0.001 | 5.60 ± 2.60 | 4.77 ± 1.07 | <0.001 |
| C-reactive protein (mg/L) | 9.75 (2.5,9.75) | 2.30 (1.50,7.53) | 2.90 (1.50,7.70) | 0.588 | 2.80 (1.80,9.20) | 9.75 (2.5,9.75) | 0.918 |
| Hemoglobin (g/L) | 83.49 ± 16.74 | 82.19 ± 17.59 | 83.67 ± 16.62 | 0.274 | 83.36 ± 19.35 | 83.50 ± 16.61 | 0.946 |
| Intact parathyroid hormone (pg/mL) | 285.00 (151.75454.00) | 224.00 (128.98365.75) | 288.50 (155.00467.50) | 0.089 | 203.00 (108.00330.50) | 290.00 (154.00456.50) | 0.050 |
| Systolic blood pressure (mm Hg) | 146.57 ± 20.59 | 148.43 ± 25.54 | 146.31 ± 19.80 | 0.203 | 151.40 ± 25.48 | 146.32 ± 20.29 | 0.047 |
| Diastolic blood pressure (mm Hg) | 88.76 ± 14.09 | 85.23 ± 15.43 | 89.26 ± 13.82 | <0.001 | 87.18 ± 15.86 | 88.85 ± 14.00 | 0.342 |
| Residual creatinine clearance rate (ml × week/min/ /1.73m2) | 52.24 ± 36.31 | 50.57 ± 36.15 | 52.48 ± 34.68 | 0.502 | 55.03 ± 38.81 | 52.11 ± 34.65 | 0.507 |
| Charlson comorbidity index | 2.51 ± 0.94 | 2.97 ± 1.24 | 2.44 ± 0.87 | <0.001 | 3.06 ± 1.13 | 2.48 ± 0.92 | <0.001 |
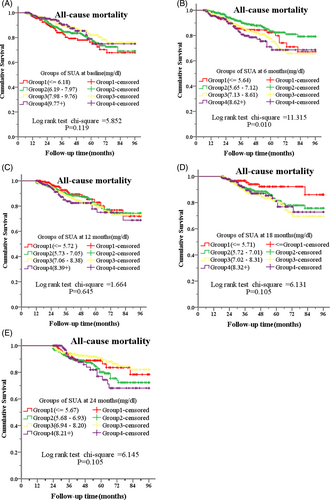
We graded SUA levels at baseline, 6, 12, 18 and 24 months during follow-up by mean of SUA plus or minus a standard deviation as cut-off values. Kaplan–Meier survival analysis and Cox regression analysis showed that there were no significant differences on all-cause mortality among groups with different graded SUA levels at baseline, 12 months, 18 months, and 24 months during follow-up (Figure 2, ACDE; Table 2). There were also no significant differences on cardiovascular mortality among groups with different graded SUA levels at baseline, 6, 12, 18, and 24 months during follow-up (data not shown).

| Baseline | 6 months | 12 months | 18 months | 24 months | ||||||||||||||||
|---|---|---|---|---|---|---|---|---|---|---|---|---|---|---|---|---|---|---|---|---|
| HR | 95% CI | P | HR | 95% CI | P | HR | 95% CI | P | HR | 95% CI | P | HR | 95% CI | P | ||||||
| Grade1 | 0.985 | 0.657 | 1.475 | 0.94 | 1.442 | 0.864 | 2.407 | 0.161 | 0.927 | 0.542 | 1.586 | 0.782 | 0.507 | 0.238 | 1.081 | 0.079 | 0.715 | 0.384 | 1.333 | 0.291 |
| Grade2 | reference | reference | reference | reference | reference | reference | reference | reference | reference | reference | reference | reference | reference | reference | reference | reference | reference | reference | reference | reference |
| Grade3 | 0.776 | 0.531 | 1.134 | 0.19 | 1.656 | 1.11 | 2.471 | 0.013 | 1.012 | 0.692 | 1.479 | 0.951 | 0.912 | 0.6 | 1.386 | 0.667 | 0.564 | 0.343 | 0.927 | 0.024 |
| Grade4 | 0.825 | 0.496 | 1.374 | 0.46 | 2.063 | 1.313 | 3.243 | 0.002 | 1.291 | 0.795 | 2.095 | 0.301 | 0.91 | 0.535 | 1.55 | 0.729 | 1.044 | 0.586 | 1.861 | 0.883 |
- Note: The factors adjusted included age, serum creatinine, serum phosphorus, serum albumin, serum glucose, diastolic blood pressure, Charlson comorbidity index, DM and residual creatinine clearance rate.
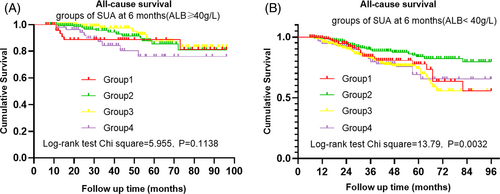
For SUA at 6 months of PD, we graded the patients with PD into Grade 1 (SUA <5.65 mg/dl), Grade 2 (5.65 mg/dl ≤ UA <7.13 mg/dl), Grade3 (7.13 mg/dl ≤ SUA ≤ 8.61 mg/dl), and Grade 4 (SUA >8.61 mg/dl) according to mean of SUA plus or minus a standard deviation as cut-off values. Kaplan–Meier analysis showed that there was significant difference on all-cause mortality among the above Grades (χ2 = 11.315, p = 0.010) (Figure 2b). Multivariate Cox regression analysis showed the all-cause mortality tended to be lowest in Grade 2, and significantly lower in Grade 2 than those in Grade 3 and Grade 4 (HR = 1.656, p = 0.013; HR = 2.063, p = 0.002, respectively) when the factors including age, serum creatinine, serum phosphorus, serum albumin, serum glucose, DBP, CCI, DM, and residual Ccr were adjusted. (Table 2). Because the nutritional status may influence the SUA level and all-cause mortality, we further performed analysis of different SUA levels at 6 months and all-cause mortality under stratified serum albumin level (≥40 g/L or < 40 g/L). Kaplan Meier analysis showed the difference in all-cause mortality under different SUA levels no more existed for patients with albumin ≥40 g/L (χ2 = 5.955, p = 0.1138), but remained obvious for patients with albumin <40 g/L (χ2 = 13.79, p = 0.0032) (Figure 3). Multivariate Cox regression analysis adjusted by the factors including age, serum creatinine, serum phosphorus, serum glucose, DBP, CCI, DM and residual Ccr showed that the HR for Grade 3 remained significant only in patients with serum albumin <40 g/L (HR = 1.82, p = 0.005), while the HR for Grade 4 remained significant in both patients with serum albumin≥40 g/L and serum albumin <40 g/L (HR = 2.649, p = 0.037; HR = 1.749, p = 0.031, respectively) (Table 3).

| (6 months) | ALB ≥ 40 g/L | ALB < 40 g/L | ||||||
|---|---|---|---|---|---|---|---|---|
| HR | 95% CI | p | HR | 95% CI | p | |||
| Grade1 | 1.439 | 0.529 | 3.909 | 0.476 | 1.236 | 0.717 | 2.131 | 0.447 |
| Grade2 | reference | reference | reference | reference | reference | reference | reference | reference |
| Grade3 | 0.655 | 0.249 | 1.724 | 0.392 | 1.82 | 1.193 | 2.778 | 0.005 |
| Grade4 | 2.649 | 1.061 | 6.613 | 0.037 | 1.749 | 1.052 | 2.906 | 0.031 |
- Note: The factors adjusted included age, serum creatinine, serum phosphorus, serum glucose, diastolic blood pressure, Charlson comorbidity index, DM, and residual creatinine clearance rate.
4 DISCUSSION
This study showed that the SUA levels post PD were decreasing, with significant differences between baseline and follow-up periods. The reason may be that PD can discharge UA and improve hyperuricemia [12], and the aggravated nutritional status with long-term PD treatment. For most studies on the correlation between SUA and mortality in PD patients, the SUA values were taken from baseline SUA values at the beginning of PD. According to the trend of SUA during the follow-up periods, we believe that the baseline SUA may not be able to represent the SUA level during PD, which may be the main reason for inconsistent conclusions based on baseline SUA. Therefore, we used SUA levels at different follow-up periods (baseline, 6, 12, 18, and 24 months) to analyze the correlation between SUA and the long-term prognosis of patients with PD.
Cox regression analysis shows that high SUA at 6 months post PD is an independent risk factor for all-cause death in patients with PD. It was reported that elevated SUA level may play a role in endothelial dysfunction [12], and it showed that there was independent correlation between SUA level and the degree of endothelial dysfunction in long-term PD patients [13]. Furthermore, a study of 134 patients with PD from Korea found that hyperuricemia was significantly correlated with the decline rate of residual renal function (RRF) after adjusting demographic data [14], and there is a study shows hypoalbuminemia is associated with an increased risk of RRF loss in patients with PD [15]. RRF, inflammation, and left ventricular hypertrophy were interrelated, which would increase the risk for mortality in patients with PD [16]. The preservation of RRF and proper management of the comorbidities may help to improve the survival of maintaining PD patients [17]. However, at 24 months after PD, this study showed that slightly higher SUA level was a protective factor for all-cause death in patients with PD. Studies showed that low SUA levels might increase the risk for all-cause death in hemodialysis patients [18, 19].
It also showed that SUA level was positively correlated with albumin levels and negatively correlated with comorbidity index [18]. And a large retrospective study on patients with PD showed that low SUA was independently associated with low serum albumin, low BMI and low serum phosphorus level, indicating malnutritional status [20]. It also showed that low serum albumin level in patients with PD was associated with all-cause mortality [21-23]. The aggravation of nutritional status was shown to be the relative risk factor for death in patients with PD [24], and malnutrition was the main factor leading to the increase of mortality in patients with low SUA [25]. So, we further performed analysis of different SUA levels at 6 months under stratified serum albumin levels. It is interesting that the difference in all-cause mortality under different SUA levels no more existed for patients with albumin ≥40 g/L but remained obvious for patients with albumin <40 g/L. Cox regression analysis also showed that the HR for Grade 3 diminished for patients with serum albumin ≥40 g/L, but for patients with Grade 4, which is the highest quartile as SUA >8.61 mg/dl, HR remained significant for both patients with serum albumin ≥40 g/L and serum albumin <40 g/L. These results suggested that moderate hyperuricemia may be associated with nutritional improvement, but excessive hyperuricemia was still a risk factor for poor prognosis, whether malnutrition exists or not.
There were some limitations in our study. First, the patients were from a single center. Second, this was a retrospective study with a relatively large time span of the enrolled patients, which may cause bias in the treatments. Third, some traditional risk factors, like smoking and some co-morbidities were not available. Fourth, the UA-lowering drugs were used little during this study and could not be statistics. It is necessary to do a prospective multicenter trial to find the appropriate SUA level to improve the long-term survival in maintaining patients with PD.
5 CONCLUSION
In summary, our study showed that the SUA level decreased during the follow-up period of PD. At 6 months post PD, higher SUA level was an independent risk factor of all-cause mortality, while slightly high SUA level at 24 months post PD might be a protective factor. Further studies are needed to clarify the underlying mechanisms.
AUTHOR CONTRIBUTIONS
All of the authors listed have made substantial contributions to the paper. Yaomin Wang, Qilong Zhang and Jianghua Chen designed the research, conducted analysis and interpretation of data. Pingping Ren, Yixuan Pan, Yi Liu, Chenglin Li, Zhenzhen Fan, Jianghua Chen, and Xiaohui Zhang contributed to acquisition of data and assisted data analysis. Yaomin Wang and Qilong Zhang drafted the manuscript. Fei Han revised the manuscript.
FUNDING INFORMATION
This study was supported by the funds from Public Applied Research Project of Huzhou City (2019GY72); Medical and Health Science and Technology Project (2020380978); Grant of Natural Science Foundation of Zhejiang Province (Q19H050030); Grant of National Natural Science Foundation of P.R. China (81900694).
CONFLICT OF INTEREST
There are no conflicts of interest to disclose.
Open Research
DATA AVAILABILITY STATEMENT
The data sets used and/or analyzed during the current study are available from the corresponding author on reasonable request.


