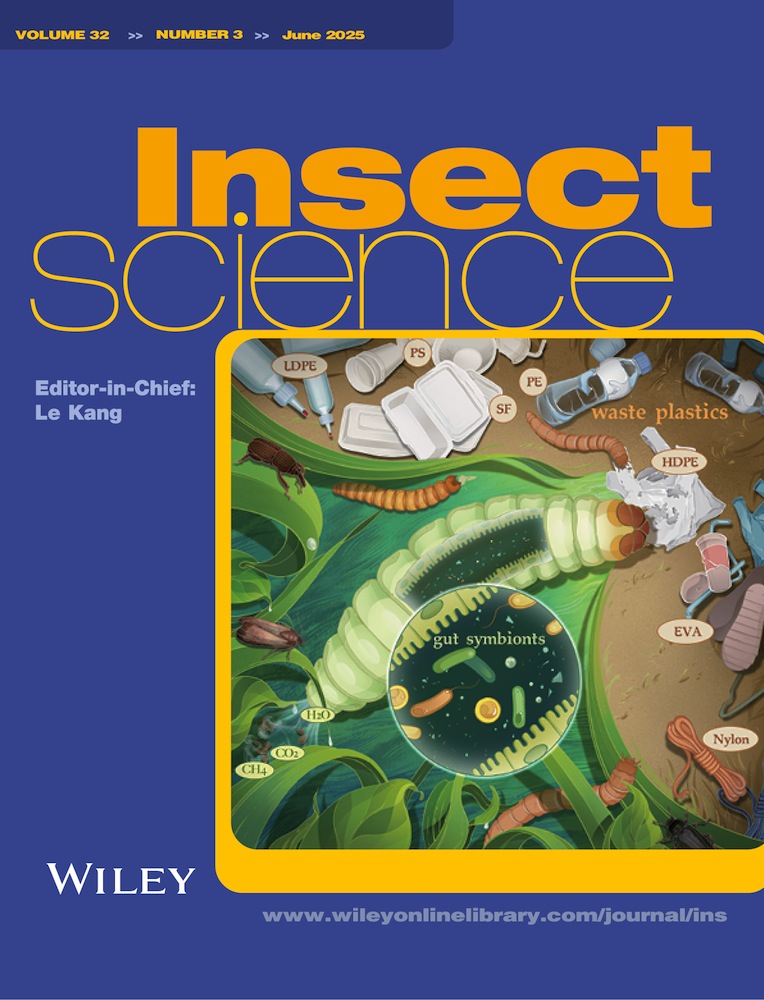
Development of the insect adult fat body relies on glycolysis, lipid synthesis, cell proliferation, and cell adhesion
Abstract
The fat body of the holometabolous insect is remodeled by the degradation of the larval fat body and the development of the adult fat body during metamorphosis. However, the mechanism of adult fat body development is quite unclear. Using the agricultural pest Helicoverpa armigera, the cotton bollworm, as a model, we revealed that the development of adult fat body was regulated by glycolysis, triglyceride (triacylglycerol [TAG]) synthesis, cell proliferation, and cell adhesion. RNA sequencing detected a set of genes that were upregulated in the 8-d late pupal fat body at a late metamorphic stage compared with the 2-d pupal fat body at an earlier metamorphic stage. The pathways for glycolysis, TAG synthesis, cell proliferation, and cell adhesion were enriched by the differentially expressed genes, and the key genes linked with these pathways showed increased expression in the 8-d pupal fat body. Knockdown of phosphofructokinase (Pfk), acetyl-CoA carboxylase (Acc1), phosphatidylinositol 4,5-bisphosphate 3-kinase catalytic subunit (P110) and collagen alpha-1(IV) chain (Col4a1) by RNA interference resulted in abnormal eclosion and death at pupal stages, and repressed lipid droplets accumulation and adult fat body development. The expression of Acc1, P110, and Col4a1 was repressed by the insect steroid hormone 20-hydroxyecdysone (20E). The critical genes in the 20E pathway appeared to decrease at the late pupal stage. These data suggested that the development of the insect adult fat body is regulated by glycolysis, lipids synthesis, cell proliferation, and cell adhesion at the late pupal stage when the 20E signal decreases.
Introduction
The insect fat body plays similar roles as the mammalian liver and adipose tissue for energy storage and metabolism (Li et al., 2019). The larval fat body proliferates to a large size along with larval growth to store lipids for adult development during metamorphosis after feeding stops (Nelliot et al., 2006). The larval fat body is dissociated and degraded through programmed cell death (PCD) during insect metamorphosis (Smith et al., 2014). Larval fat body PCD includes autophagy and apoptosis sequentially occurring at the early stage of metamorphosis (Xie et al., 2016). In Drosophila melanogaster, the larval fat body is dissociated into individual cells during metamorphosis, and the adult fat body may rebuild from the remaining larval fat body cells or is newly generated from adult progenitor cells (Aguila et al., 2007; Zheng et al., 2016). Lipid droplet (LD) is the main structure for lipid storage in adipose tissue, and triglyceride (triacylglycerol [TAG]) is the major component of LD (Walther & Farese, 2012). LD is the center of lipid and energy homeostasis, which has a unique architecture consisting of a hydrophobic core of neutral lipids and a phospholipid monolayer (Olzmann & Carvalho, 2019). In Bombyx mori, the LD abundance dramatically increased from the late stage of the last larval instar to the stage before pupation, but significantly reduced after the pupal early stage and then increased again at the late pupal stage and adult stage (Peng et al., 2018). However, the mechanism of the development of the adult fat body is unclear.
20-hydroxecdysone (20E) is the key hormone promoting metamorphic development. The 20E titer is low at larval feeding stages, but increases from wandering stages and reaches high levels at middle pupal stages, and then decreases to lower levels at late metamorphic stages in the whole body (Kang et al., 2019) and in the hemolymph (Di et al., 2021a) in Helicoverpa armigera. It is known that the increased high levels of 20E triggers PCD during metamorphosis (Nicolson et al., 2015); however, the significance of the decrease of the 20E titer at late metamorphic stages is unknown.
We used H. armigera, the cotton bollworm, a lepidopteran insect, as a model to reveal that the adult fad body was developed by increased gene expression in glycolysis, TAG synthesis, cell proliferation, and cell adhesion pathways at late metamorphic stages when the 20E signal was decreased.
Materials and methods
Insects
H. armigera were reared with artificial diet at 27 °C in our laboratory, with a 14 h light and 10 h dark cycle and 60% relative humidity.
Morphology observation of fat body and LD staining
The fat bodies on pupal d 2 (P-2) and P-8 were dissected, and washed with phosphate-buffered saline (PBS, 10 mmol/L Na2HPO4, 1.8 mmol/L KH2PO4, 140 mmol/L NaCl, and 2.7 mmol/L KCl, pH 7.4), and fixed with 4% paraformalde hyde for 30 min at room temperature. Then, the fat bodies were washed with PBS 3 times, 5 min each time, incubated with PBST (PBS, 0.05% Tween, and 0.5% Triton X-100) for 5 min to increase the permeability of the cell membrane, and then stained with Nile red (1: 1 000; 7385-67-3, Sigma-Aldrich, MO, USA) for 30 min at 37 °C to detect LDs. The fat bodies were then washed with PBST 3 times, stained with 4′, 6-diamidino-2-phenylindole (DAPI, 1: 1 000; KGA215, KeyGEN Biotechnology, Nanjing, China) for 10 min at room temperature, and washed with PBS 3 times, 5 min each time. Finally, the fat bodies were placed on glass slides for observation. The fluorescence signaling was observed under an Olympus BX51 fluorescence microscope (Olympus Optical Co, Tokyo, Japan).
TAG concentration detection
Briefly, 100 mg of fat bodies at different developmental stages of H. armigera, from the 6th instar 6 h (6th-6 h) to adult, were dissected and ground with extraction buffer (N-heptane:isopropanol = 1:1), centrifuged at 4 °C, and the supernatant was extracted for subsequent processing according to the kit instructions (BC0620, Solarbio, Beijing, China). The principle is that TAG is extracted by isopropanol, the KOH hydrolyzes TAG to glycerol and fatty acids, glycerol was oxidized to formaldehyde in the presence of chloride, and condensed with acetylacetone to produce yellow 3,5 diacetyl, 1,4 dihydromethylpyridine (Hu et al., 2018).
RNA sequencing
The fat body samples of P-2 and P-8 were dissected and then frozen in liquid nitrogen. Total RNA was extracted with TRIzol and then enriched for messenger RNA (mRNA) with a polyA tail using magnetic beads with oligo(dT). The RNA fragments were obtained using lysis buffer, reverse transcription was performed using random N6 primers, and double-stranded DNA (dsDNA) was synthesized from complementary DNA (cDNA). The end of the synthesized dsDNA is flattened and phosphorylated at the 5′ end, with the 3′ end forming a sticky end protruding from an “A” and then connecting a bubbling connector with a protruding “T” at the 3′ end. The resulting sequences were amplified by polymerase chain reaction (PCR) using specific primers (next-generation transcriptome assembly). The PCR product was denatured thermally into single-stranded DNA, and then the single-stranded DNA was cyclized to a single-stranded circular DNA library and sequenced by Qingdao Huada (BGI.Q, Qingdao, China).
Data analysis
The H. armigera genome reference was downloaded from the website and the Gene IDs correspond to The National Center for Biotechnology Information (https://www.ncbi.nlm.nih.gov/Taxonomy/Browser/wwwtax.cgi?mode = Info&id = 29058). All clean reads were aligned with the H. armigera genome using HISAT software (http://www.ccb.jhu.edu/software/hisat). The fragments per kilobase of exon per million reads mapped (FPKM) values of genes and transcripts were calculated by software RNA sequencing (RNA-Seq) by Expectation–Maximization (RSEM, http://dewelab.biostat.wisc.edu/RSEM) after determining the gene alignment ratio using Bowtie2 to align clean reads to the reference sequence. Differentially expressed genes (DEGs) were filtered using NOIseq as genes with differential expression greater than or equal to 2 (|log2(fold change)| ≥ 1) and P-value (probability of different expression between sample groups) ≥ 0.8. The heatmaps of the DEGs were prepared by heatmap based on R software, and soft clustering was performed by Mufzz (http://mfuzz.sysbiolab.eu) based on R software. We clarified DEGs by function according to Gene Ontology (GO) annotations and official standards and used the phyper module based on R software for enrichment analysis, with P values ≤ 0.01 as notable enrichment (Wiki https://en.wikipedia.org/wiki/Hypergeometric_distribution). Kyoto Encyclopedia of Genes and Genomes (KEGG) analysis was performed to clarify DEG biological functions according to KEGG annotations and official standards, and we used the phyper module of R software for enrichment analysis, with P values ≤ 0.01 as notable enrichment.
Quantitative real-time PCR (qRT-PCR)
Total RNA was extracted from P-2 and P-8 using TRIzol and reverse transcribed into cDNA using a reverse transcriptional kit. Then, qRT-PCR was performed with a CFX96 real-time system (Bio-Rad, Hercules, CA, USA) using a 2× SYBR Green qRT-PCR pre-mixture (PC3301, Aidlab, Beijing, China). The relative mRNA expression level was calculated by the 2−ΔΔCT method (ΔΔCT = ΔCTsample−ΔCTcontrol, ΔCTcontrol = CTgene−CTActb), with Actb as the control. The primers used for the study are listed in Table S1.
Double-stranded RNA interference
The control group and the experimental group were selected from 40 H. armigera 4 d after pupation. The double-stranded RNA (dsRNA) was diluted to 1000 ng/μL with sterilized PBS on a sterile ultra-clean bench, and 2 μL of dsRNA was injected into each pupa with a microinjector. A second injection was injected 48 h after the first injection, and a third injection was injected 24 h after the second injection. All 3 injections injected the same type of dsRNA. Then, 24 h after the third injection (8 d after pupation), 3 pupae were randomly selected from each group to extract tissue RNA, and qRT-PCR was used to detect the interference efficiency. Morphological observations were made using Nile red staining for TAG content to observe changes in the fat body morphology and to observe the eclosion and mortality of pupae.
Hormone regulation
20E was purchased (Cayman Chemical, Ann Arbor, USA). Different concentrations of 20E (100, 200, 300, or 500 ng/pupa) were injected into P-2 pupal hemolymph and treated for 12 h. Dimethyl sulfoxide (DMSO) was used as a control for 20E. Total RNA was extracted and gene expression was analyzed by qRT-PCR.
Statistical analysis
All experiments were repeated 3 times. Statistical analysis was conducted using t-tests for 2-pair comparisons. In the figures, asterisks indicate significance (*P < 0.05 and **P < 0.01, ***P < 0.001). The values are the mean ± standard deviation. Data were generated using GraphPad 7.0 (GraphPad Inc., La Jolla, CA, USA).
Results
The adult fat body was developed from the dispersed fat body pieces and the increase of TAG
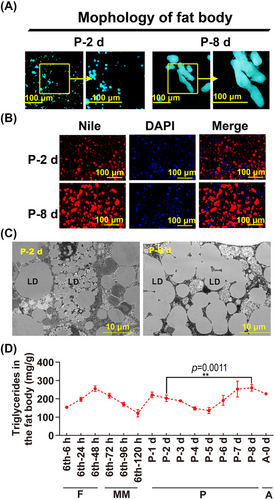
To show the variation of the fat body from the earlier pupal stage (P-2) to the later pupal stage (P-8, 1 d before emergence), the morphology, LD, and TAG of the fat body were examined. The results showed the fat body at P-2 appeared as dispersed pieces; however, the fat body at P-8 appeared as a short rod-like form, suggesting that the fat body at P-8 was developed by growth or association of the dispersed pieces (Fig. 1A). Nile red staining further showed that LDs, key and primary structures of adipose cells, were enlarged at P-8 compared with P-2 (Fig. 1B). Transmission electron microscopy showed the detail of the LDs (Fig. 1C). In addition, TAG, a central component of LDs, was significantly increased at P-8 compared with P-2 (Fig. 1D). These results suggested that the development of adult fat body includes the growth and association of the small pieces of fat body, TAG synthesis and LD enlargement.
RNA-seq revealed a set of DEGs in P-2 and P-8 fat bodies
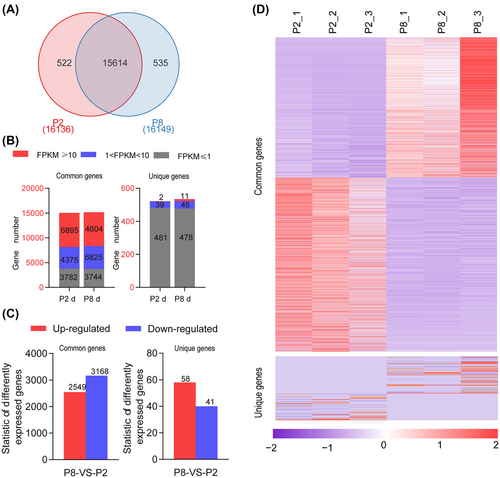
To identify the genes involved in adult fat body development, we compared the difference in gene expression by RNA-seq in the fat body at P-2 and P-8. In total, 148 486 985 and 188 513 002 clean reads were obtained from the fat bodies at P-2 and P-8, respectively, and a Pearson correlation showed that repeated groups had higher correlations and that all databases were able to be further studied (Fig. S1, Table S2). The clean reads were mapped to the H. armigera reference genomes, showing that 16 136 genes at P-2 and 16 149 genes at P-8 were identified, in which 15 614 genes were commonly shared by P-2 and P-8, and 522 genes and 535 genes were exclusively expressed in P-2 and P-8, respectively (Fig. 2A). Moreover, based on the FPKM values of expressed genes, 6 895 and 4 604 common genes were highly expressed in the P-2 and P-8 groups, respectively (Fig. 2B). When the genes with log2 (P-8 d FPKM/P-2 d FPKM) were defined as DEGs, of the commonly shared genes, 2 549 were found to be upregulated genes and 3 168 were downregulated genes, as identified by the ratio P-8/P-2. Of the unique genes, there were 58 upregulated genes and 41 downregulated genes defined by the ratio P-8/P-2 (Fig. 2C). The heatmap analysis showed that DEGs appeared specific to developmental stages (Fig. 2D, Table S3). These results suggested that adult fat body development is related to differential gene expression.
Glycolysis, lipogenesis, cell proliferation, and cell adhesion pathways were enriched from P-2 and P-8 fat bodies
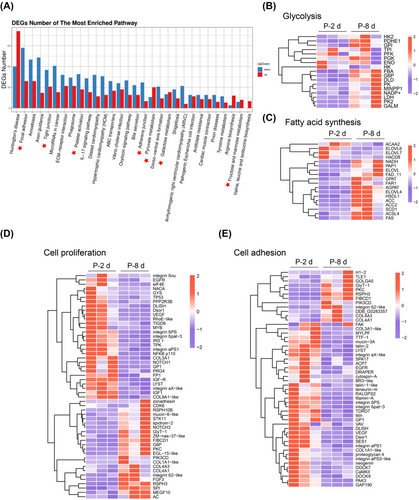
To identify the pathways of the DEGs, KEGG analysis was performed. The results showed that pathways related to cell adhesion were enriched, including those associated with focal adhesion, tight junction, extracellular matrix-receptor interaction, and adherent junction. In addition, glycometabolism pathways, such as pyruvate metabolism, galactose metabolism, and fructose and mannose metabolism, were enriched. The pathways for cell proliferation, such as the platelet activation pathway, were also enriched with genes that increase or decrease expression, by comparing P-8 with P-2 (Fig. 3A). The genes in the pathways related to glycometabolism, lipid metabolism, cell proliferation and cell adhesion were chosen from RNA-seq data and the expression of the genes is presented in a heatmap according to the FPKM, which showed that the genes in these pathways were differentially expressed in fat body at P-2 and P-8 (Fig. 3B–E). These data suggest that the pathways related to glycometabolism, lipogenesis, cell proliferation, and cell adhesion pathways were involved in adult fat body development.
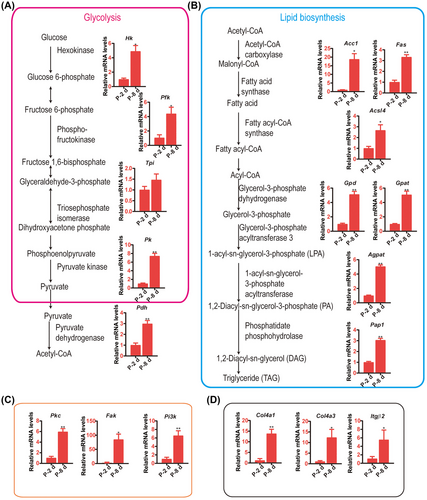
The genes in these pathways were examined by qRT-PCR to evaluate the levels of these pathways at P-2 and P-8. The critical and rate-limiting enzymes, hexokinase (Hk), phosphofructokinase (Pfk), pyruvate kinase (Pk) in glycolysis, and pyruvate dehydrogenase (Pdh) in acetyl-CoA production that connects the lipid biosynthesis pathway, showed increased expression significantly in the P-8 fat body group compared with P-2 (Fig. 4A). The acetyl-CoA carboxylase1 (Acc1), fatty acid synthase (Fas), and acyl-CoA synthetase long-chain family member (Acsl4), which are key enzymes of fatty acid synthesis, and glycerol-3-phosphate dehydrogenase (Gpd), glycerol-3-phosphate acyltransferase 3 (Gpat), 1-acyl-sn-glycerol-3-phosphate acyltransferase 3 (Agpat) and phospholipid phosphatase 5-like (Pap1) in TAG synthesis were upregulated on P-8 compared with P-2 (Fig. 4B). The protein kinase C (Pkc), focal adhesion kinase (Fak), and phosphatidylinositol 4,5-bisphosphate 3-kinase (Pi3k, subunit P110), which promote cell proliferation, were also upregulated in the P-8 fat body group (Fig. 4C). In addition, Col4a1, collagen alpha-1(IV) (Col4a3), and integrin β2 (Itgβ2) in the cell adhesion pathway were upregulated in the P-8 fat body group compared with P-2 (Fig. 4D). These results suggested that glycolysis, lipid biosynthesis, cell proliferation and cell adhesion are upregulated in the P-8 fat body compared with P-2.
Adult fat body development relied on glycolysis, lipogenesis, cell proliferation, and cell adhesion
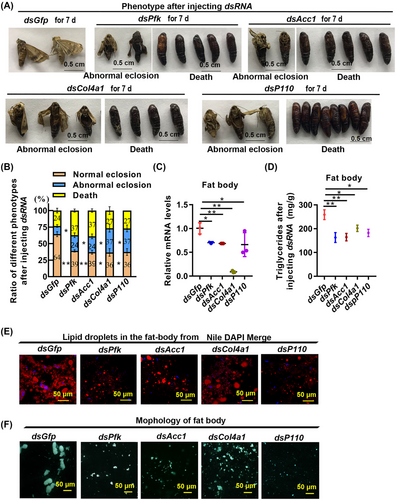
To elucidate the roles of glycolysis, triglyceride synthesis, cell proliferation, and cell adhesion in the development of the adult fat body, we knocked down some genes in these pathways, respectively, including Pfk, Acc1, Col4a1, and P110, in vivo by injecting dsRNA targeting the genes into the hemolymph of 4-d pupae (P-4), with dsGfp as a control. Pfk, Acc1, Col4a1, and P110 knockdown resulted in abnormal eclosion and death (Fig. 5A). According to the statistics of the phenotype, 37% of the pupae in the dsPfk-injected group exhibited death, and 24% abnormal eclosion at the pupal stage; 37% of the pupae in the dsAcc1-injected group exhibited death, and 24% abnormal eclosion at the pupal stage; 27% death and 37% of the pupae in the dsCol4a1-injected group exhibited abnormal eclosion at the pupal stage; 27% death and 37% of the pupae in the dsP110-injected group exhibited abnormal eclosion at the pupal stage (Fig. 5B). The interference efficiency test showed that the Pfk, Acc1, Col4a1, and P110 genes had been significantly knocked down (Fig. 5C). In addition, TAG levels decreased after knockdown of Pfk, Acc1, Col4a1, and P110 genes in the fat body (Fig. 5D). LDs were decreased after Pfk, Acc1, Col4a1, and P110 were knocked down (Fig. 5E). The adult rod-shaped fat body was not formed at P-8 after Pfk, Acc1, Col4a1, and P110 knockout (Fig. 5F). These results suggest that the development of the adult fat body relies on glycolysis, lipogenesis, cell proliferation, and cell adhesion.
20E differentially regulated Pfk, Acc1, Col4a1, and P110 expression
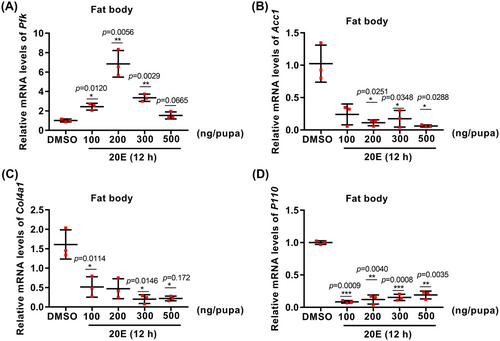
The effects of 20E on the gene expression of Pfk, Acc1, Col4a1, and P110 were examined to address the mechanism of gene upregulation at P-8. The result showed that 20E promoted the expression of Pfk, except at high concentrations. However, 20E repressed Acc1, Col4a1, and P110 expression at all concentrations tested (Fig. 6). These results suggested that 20E differentially regulates the expression of Pfk, Acc1, Col4a1, and P110.
The expression of genes in 20E and insulin pathways were further analyzed by comparison of the gene expression at P-2 and P-8 to examine the roles of 20E and insulin in adult fat body development. A heatmap showed that the key genes in the 20E pathway including transcription factors ecdysone-induced protein (E93), Broad-Complex (Br-c), and Usp were highly expressed at P-2 d, but lowly expressed at P-8 (Fig. S2A), suggesting 20E signal was decreased on P-8. In the insulin pathway, some genes had increased expression at stage P-8; however, the insulin receptor (Insr) was not increased (Fig. S2B, Table S3). These data suggested the increased expression of Pfk, Acc1, Col4a1, and P110 on P-8 was likely by the decrease of 20E signaling, but unlikely by the INSR-mediated signaling.
Discussion
This study revealed that insect adult fat body development relies on the regulation of glycolysis, triacylglycerol accumulation, cell proliferation, and cell adhesion. Some genes in glycolysis, triacylglycerol synthesis, cell proliferation, and cell adhesion were increased in expression to promote adult fat body development at the late metamorphic stage when 20E signal decreased.
Adult fat body development relies on the regulation of glycolysis, lipid synthesis, cell proliferation, and cell adhesion
Fat body remodeling is quite different from the midgut (Hakim et al., 2010), because the larval fat body is mixed with the progenitor cells of an adult fat body as observed in H. armigera (Zhao et al., 2022). The larval fat body begins decomposition and performs PCD from the last instar larvae (Li et al., 2016) and is dissociated into small pieces at earlier pupal stages, then forms the rod-shaped adult fad body at late pupal stages (Di et al., 2021a). The mechanism of adult fat body development is not well understood, although some studies have indicated that cell proliferation is involved in adult fat body development (Di et al., 2021a; Zhao et al., 2022). This study revealed that the adult fat body develops by integration of metabolic and cell processes, including the glycolysis, synthesis of lipids, cell proliferation, and cell adhesion mediated by the increase in a set of key genes, including pfk, Acc1, Col4a1, and P110, in their related pathways at late pupal stages.
PFK is a critical enzyme in glycolysis. Glycolysis is the basic bio-substrate-producing pathway of lipid synthesis and cell proliferation. The glycolytic intermediate dihydroxyacetone phosphate can be used as a substrate for the synthesis of lipids. The glycolytic product pyruvate is oxidized to form acetyl-CoA, which in turn can be used as a substrate in lipid synthesis (Rui, 2014). ACC1 is the key enzyme in lipid synthesis. COL4A1 is a collagen in the basement membrane to integrate membrane proteins. The fat body cells in D. melanogaster can synthesize COL4A1, which is secreted into the hemolymph to promote the formation of the shape of the organ (Dai et al., 2017). In addition, collagen can interact with integrins on cell membranes to promote the activation of the PI3K-Akt signaling pathway in cells and promote cell proliferation (Ao et al., 2018). PI3K plays a critical role in cell proliferation (Yu & Cui, 2016). Our study found that these genes increased expression at the late metamorphic stages, and the knockdown of these genes caused failure of the adult fat body development, thus the development of the insect adult fat body is regulated by the integrated cell processes of glycolysis, TAG accumulation, cell proliferation, and cell adhesion.
20E signal decreases at late pupal stages to allow some gene expression for adult fat body development
20E is the key hormone tpromoting metamorphosis by upregulating gene expression in autophagy and apoptosis. The 20E titer is low during the feeding stages, which could not induce the PCD-related gene expression, whereas 20E titer increases from wandering larval stages and reaches the highest levels at the middle pupal stages to promote PCD. In addition, 20E also represses glycolysis pathway gene expression during metamorphosis and pupation (Tian et al., 2010). 20E titer then decreases to lower levels at late metamorphic stages (Kang et al., 2019; Di et al., 2021a). We observed that Pfk, Acc1, Col4a1, and P110 expression levels were lower at P-2 in the earlier pupal stage, but the expression of these genes increased at P-8 in the late pupal stage. In parallel, the expression of 20E pathway genes decreases at P-8 compared with P-2, including transcription factor E93, and Br-c that initiates metamorphosis in holometabolan insects (Belles, 2020; Palli et al., 1997; Liu et al., 2015). These data suggested that high 20E levels at early and middle pupal stages repress some gene expression in glycolysis, triacylglycerol synthesis, cell proliferation, and cell adhesion, but low 20E levels at late pupal stages release gene expression from 20E repression.
The roles of insulin pathway genes in the adult fat body development need further study
Insulin is a major hormone for stimulating lipid accumulation and inhibiting lipolysis (Defferrari et al., 2016). Insulin positively influences lipid synthesis by promoting the synthesis of fatty acids and triacylglycerol (Sparks & Sparks, 1994). Glycolysis produces the substrate of the lipogenesis in adipose cells, which synthesizes the triglyceride backbone and glycerol phosphate (Dashty, 2013). Insulin also causes crosstalk with cell proliferation signaling pathways to promote cell proliferation (Burnol et al., 2013). Insulin pathway plays important roles during insect larval growth; however, the expression and the phosphorylation of INSR are repressed by 20E during H. armigera metamorphosis from the wandering stage to the later pupal stage (Li et al., 2021). INSR was also not observed to increase at P-8 in this study, suggesting the INSR-mediated insulin signal is unlikely to be involved in adult fat body development. However, some genes in the insulin pathway were upregulated at P-8 and the roles in adult fat body development need to be addressed in future studies. In addition, many genes in the insulin pathway are overlapped with cell proliferation because of their similar roles in cell proliferation. P110 is reported to increase at late pupal stages (Di et al., 2021b). Here we further showed P110 plays a critical role in insect adult fat body development. The role and mechanism of P110 in insect adult fat body development need further study.
We obtained a lot of DEGs at P-2 and P-8 by RNA-seq; however, some genes are not able to be detected in RNA-seq, which might be because of the lower expression levels of these genes in this tissue or at these stages. In addition, the expression of some genes detected by RNA-seq could not be confirmed by qRT-PCR, which might be caused by the different techniques, or regulation in vivo and in vitro.
Conclusion
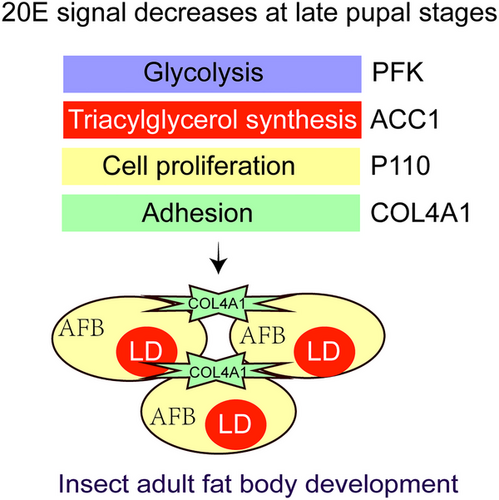
The key genes such as Pfk, Acc1, P110, and Col4a1 in glycolysis, triglyceride synthesis, cell proliferation, and cell adhesion pathways are increased in expression at the late pupal stages when the 20E signal is decreased, which increases glycometabolism, TAG synthesis, cell proliferation, and cell adhesion to promote insect adult fat body development (Fig. 7).
Acknowledgments
We thank Zhao-Yuan Cui of the Core Facilities for Life and Environmental Sciences, State Key Laboratory of Microbial Technology of Shandong University for the detection of TAG concentration using a microplate spectrometer. The research was supported by grants from the National Natural Science Foundation of China (Grant Nos. 32270507 and 32330011).
Disclosure
The authors declare no conflict of interest.


