Semi-automatic fault/fracture interpretation based on seismic geometry analysis
ABSTRACT
Fault and fracture interpretation is a fundamental but essential tool for subsurface structure mapping and modelling from 3D seismic data. The existing methods for semi-automatic/automatic fault picking are primarily based on seismic discontinuity analysis that evaluates the lateral changes in seismic waveform and/or amplitude, which is limited by its low resolution on subtle faults and fractures without apparent vertical displacements in seismic images. This study presents an innovative workflow for computer-aided fault/fracture interpretation based on seismic geometry analysis. First, the seismic curvature and flexure attributes are estimated for highlighting both the major faults and the subtle fractures in a seismic volume. Then, fault probability is estimated from the curvature and flexure volumes for differentiation between the potential faults and non-faulting features in the geometric attributes. Finally, the seeded fault picking is implemented for interpreting the target faults and fractures guided by the knowledge of interpreters to avoid misinterpretation and artefacts in the presence of faulting complexities as well as coherent seismic noises. Applications to two 3D seismic volumes from the Netherlands North Sea and the offshore New Zealand demonstrate the added values of the proposed method in imaging and picking the subtle faults and fractures that are often overlooked in the conventional seismic discontinuity analysis and the following fault-interpretation procedures.
INTRODUCTION
Robust interpretation of faults and fractures is crucial for subsurface structure interpretation from three-dimensional (3D) seismic surveys. In the past decades, significant efforts have been devoted to computer-aided fault/fracture characterization by analysing seismic signals from two perspectives: the dynamics reflection wave-field and the kinematics reflection depth (or two-way travelling time). Specifically, the former measures the similarity of the waveform between neighbouring seismic traces (Bahorich and Farmer 1995), whereas the latter tracks the variation of the geometry of seismic reflectors (Roberts 2001). For the convenience of description in this study, we denote them as seismic discontinuity analysis and seismic geometry analysis, respectively.
The seismic discontinuity analysis was first presented as the coherence attribute for highlighting the faults and stratigraphic features from a seismic cube (Bahorich and Farmer 1995). Since then, such attribute and its variants have been improved for better detection resolution and noise robustness (e.g. Luo, Higgs and Kowalik 1996; Marfurt et al. 1998, 1999; Gersztenkorn and Marfurt 1999; van Bemmel and Pepper 2000; Cohen and Coifman 2002; Tingdahl and de Rooij 2005; Al-Dossary, Wang and McFarlane 2014; Di and Gao 2014a; Wang et al. 2016). However, besides the faults, the discontinuity analysis also highlights some certain non-faulting features, such as salt domes and diapirs, stratigraphic channels and coherent noises present in seismic data. For further enhancing the accuracy of seismic discontinuity analysis, additional efforts are then needed to suppress these non-faulting features prior to reliable fault interpretation (Ashbridge et al. 2000; Barnes 2006). For example, Pedersen et al. (2002) introduced the concept of ant colony optimization from computer science and developed an ant-tracking algorithm for sharpening the lineaments in a variance volume. Al-BinHassan and Marfurt (2003) applied the 2D Hough transform for extracting the fault lines on a time section, and later Wang and AlRegib (2014a) extended it to 3D space for fault surface detection from a semblance volume. Barnes (2006) performed eigenvector analysis to a coherence volume and designed a discontinuity filter for imaging the steeply dipping discontinuities. Lavialle et al. (2006) presented a nonlinear filtering approach for noise suppression and fault enhancement based on the 3D gradient structure tensor analysis. Hale (2013) developed a discrete-scanning algorithm over dips and strikes for lineament thinning from a semblance volume. Zhang et al. (2014) binarized a discontinuity volume for fault skeletonization using a biometric algorithm. Machado et al. (2016) performed volumetric fault imaging by applying the directional Laplacian of a Gaussian filter to coherence anomalies along reflector dip and azimuth. A comprehensive summary of the discontinuity analysis can be found in Chopra (2002), Kington (2015) and Di and Gao (2017a).
However, the conventional discontinuity analysis is limited in its detection capability for subtle faults and fractures, particularly those imaged as minor fluctuations in continuous seismic reflection events. Moreover, such analysis is based on the similarity between two pieces of adjacent seismic traces and thereby provides no quantitative estimate of the changes in seismic signals due to faulting and fracturing, for example, the vertical displacements from one fault block to the other. Then, for more robust fault detection and fracture characterization from 3D seismic data, the seismic geometry analysis is developed by quantifying the lateral variations of the geometry of seismic reflectors, including the second-order curvature attribute (Roberts 2001) and the third-order flexure attribute (Di and Gao 2017b). In particular, the curvature describes the bending of a reflector and is capable of highlighting the faults and tensile fractures, whereas the flexure describes the shearing of a reflector and is capable of highlighting the shear faults and fractures (Gao 2013). Specifically, for the curvature analysis, the Gaussian curvature was first introduced to seismic interpretation from other industries and disciplines (e.g. Lisle 1994; Wood 1996), and various seismic curvatures have been developed for depicting subtle faults and fractures, including the dip/strike curvatures and the most positive/negative curvatures (Roberts 2001; Al-Dossary and Marfurt 2006). However, if examining the curvature attribute from the perspective of fault/fracture interpretation, it fails to highlight a fault in a direct manner, but by depicting its nearby anticlinal and synclinal blocks, with the fault/fracture indirectly interpreted as the lineament or zone between a positive curvature and a negative curvature. Then, the flexure analysis is developed for resolving such limitation and also providing a direct link between the lineaments on a flexure map and the potential faults/fractures. The two-dimensional (2D) flexure was first computed as the lateral variation of the curvature attribute (Gao 2013; Yu 2014), and later a set of algorithms extend the concept to 3D for volumetric flexure extraction, including the dip flexure (Di and Gao 2014b), the most positive/negative flexures (Di and Gao 2016a) and the signed maximum flexure (Di and Gao 2016b). Comprehensive summaries of the curvature and flexure analysis can be found in Roberts (2001) and Di and Gao (2017b), respectively.
The enhanced resolution of the seismic curvature and flexure analysis makes it possible for delineating the subtle lineaments that are often overlooked in the conventional discontinuity analysis, and thereby an experienced interpreter can manually pick the potential faults and fractures from curvature/flexure maps in a more accurate way. However, besides the faults and fractures of interest, both attributes also reflect the subtle fluctuations in the reflection geometry over the anticlinal/synclinal blocks, which adds the difficulties for computer programs to automatically differentiate the actual faults from the non-faulting fluctuations. Specifically, for a fault, the curvature attribute depicts its anticlinal and synclinal blocks, and zero curvature is estimated over the fault plane, whereas the flexure attribute highlights the fault plane with a peak lineament, and two sidelobes are observed over its blocks. Therefore, some additional work is in need for differentiating the faults and fractures from the non-faulting features prior to performing computer-aided fault interpretation on the curvature/flexure volumes.
Considering the low efficiency and intensive labour of manual seismic interpretation for large datasets, semi-automatic/automatic object interpretation has been the research focus since the 1990s. For example, Meldahl et al. (1999) presented a semi-automatic approach for detecting seismic chimneys by combining directive attributes and artificial neural network, and such approach was later adapted to fault extraction from 3D seismic data by Tingdahl and de Rooij (2005) and Zheng, Kavousi and Di (2014). Gibson et al. (2005) and Zhang et al. (2014) proposed grouping fault points into local planar patches and then merging these small patches into larger fault surfaces under certain geometric constraints. Admasu, Back and Toennies (2006) and Wang and AlRegib (2014b) developed an auto-tracking method of fault line propagation from one section to another within the entire seismic volume for fault patch extraction. Hale (2013) presented an algorithm of dynamic time wrapping to generate fault surfaces based on the boundary constraints derived from the thinned discontinuity images. With the recent emerging of artificial intelligence, more image processing and machine learning techniques have been implemented for the problem of seismic fault detection and interpretation (e.g. Araya-Polo et al. 2017; Di, Shafiq and AlRegib 2017, 2018; Hami-Eddine et al. 2017; Huang, Dong and Clee 2017; Lin et al. 2017; Di, Wang and AlRegib 2018; Wang et al. 2018).
If examining their results from the perspective of an experienced interpreter, these algorithms are limited in three aspects. First, due to the complexities of faulting and fracturing as well as the noises present in seismic data, they are unable to simultaneously achieve both high resolution in extracting true faults and high accuracy in avoiding non-fault artefacts. The common result is either an aggressive case with high resolution (most/all true faults extracted) but low accuracy (many false positives), or a conservative one with high accuracy (few false positives) but low resolution (few true faults extracted) (Di and Gao 2017a). Second, they are based on the conventional discontinuity analysis, which in nature fails to highlight the faults and fractures without apparent displacements. Correspondingly, the subtle fractures are ignored in this process, and only the major faults are picked as patches. Third and more importantly, most of these algorithms are designed for simple fault models, such as planar or conical shaped, and thus cannot meet the need for picking complicated faults, for example, listric faults (Shafiq, Di and AlRegib 2018). Even for simple faults, if calibrating the picked faults to the seismic images for quality control, for some study areas, we notice two minor problems, including the splitting of a large fault into several small pieces and the underestimate of the fault size (B. Payne, personal communications, 2015). Therefore, semi-automatic/automatic fault interpretation is still in the experimental phase for testing and not ready for practical implementation and application to industrial projects. Reliable picking of faults and fractures is difficult without interpreters’ knowledge, especially for a study area with geologic complexities in the subsurface.
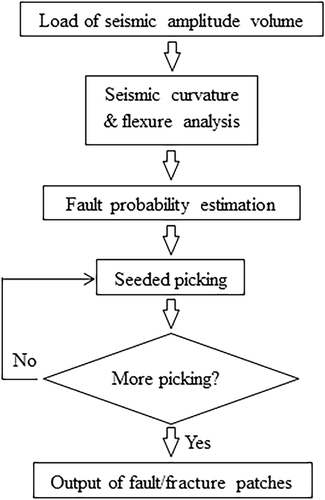
This paper presents an innovative workflow for fault and fracture interpretation based on seismic geometry analysis. It starts with generating the curvature and flexure attributes from a seismic volume. Then, the fault probability is estimated from the curvature and flexure volumes for differentiating the faults and fractures from the non-faulting features. The last step is to perform seeded picking for interpreting the target faults and fractures of interpretational interest. To be more specific, among all possible curvatures and flexures, this study uses the signed maximum ones (Di and Gao 2016b) that are considered most physically linked to subsurface faulting and fracturing, including their magnitude and azimuth. Correspondingly, we propose the fault probability estimation in two scenarios: (a) the unweighted scenario that is independent of the faulting intensity and promotes the visibility of the subtle fractures, and (b) the weighted scenario that uses the curvature/flexure magnitude to filter out the faults and fractures of small displacements. Finally, depending on the quality of fault/fracture imaging and the interpreters’ knowledge of the target faults, we propose the step of seed picking also in two scenarios: (a) the single-seed picking for interpreting those that are well imaged as continuous lineaments/surfaces and (b) the multiple-seed picking for the large faults that are imaged as several isolated segments. The proposed workflow is verified through applications to two seismic datasets over the Netherlands North Sea and the Great South Basin in New Zealand. The results demonstrate not only good match between the semi-automatic pickings and the seismic images, but also the potential for fast volumetric imaging of the entire fault system from a 3D seismic survey to help investigate the complexities of faulting and fracturing in an exploration area.
METHODOLOGY
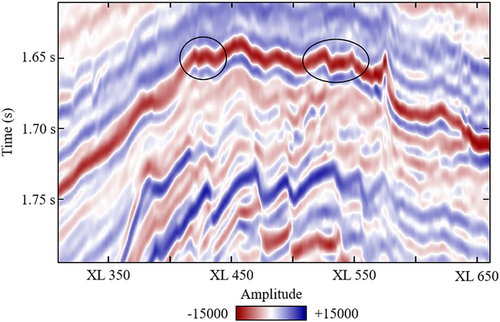
This study presents a new workflow for semi-automatic fault/fracture interpretation, which consists of three components: (a) seismic geometry analysis that highlights the faults and fractures, (b) fault probability estimation that differentiates the faults and fractures from non-fault features and (c) seeded picking that extracts patches for the target faults and fractures guided by interpreters’ knowledge (Fig. 1). For illustrating the workflow more effectively, we use the vertical section of inline #504 from the F3 block dataset over the Netherlands North Sea, where the structure is dominated by salt domes as well as normal faulting and fracturing over the anticline crest due to the rising of salt evaporates (Fig. 2).
Seismic geometry analysis
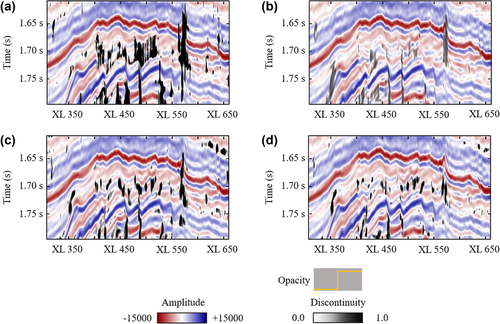
Seismic geometry analysis, including the fist-order dip, the second-order curvature and the third-order flexure, evaluates the lateral variation of the geometry of seismic reflectors at different scales and has been popular in subsurface structural interpretation, particularly fault detection and fracture characterization (e.g. Roberts 2001; Al-Dossary and Marfurt 2006; Di and Gao 2017a; Qi and Marfurt 2017). Compared with the conventional discontinuity analysis (e.g. semblance and variance) (Fig. 3), it is superior in detecting the subtle faults and fractures without apparent vertical displacements, such as those over the anticline crest denoted by the circles in Fig. 2. As shown in Fig. 4, more lineaments are recognized with the aid of the curvature and flexure attributes, especially the subtle ones not resolvable from the discontinuity attributes. A second improvement is that, the curvature and flexure attributes have two properties, magnitude and azimuth, providing more geophysical implications for fault/fracture interpretation in a quantitative manner. Specifically, the magnitude measures how the geometry of a reflector is distorted by faults and fractures, and correspondingly, the major faults of apparent displacements are represented as the lineaments of large curvature/flexure magnitude (Fig. 4a and 4c). The azimuth property not only quantifies the most-likely orientation of faults and fractures in an automatic way, but also promotes the visibility of the subtle fractures to the same level as the major faults. Correspondingly, the shadow effect of a major fault over its surrounding subtle fractures is avoided, and the adjacent lineaments are better delineated (Fig. 4b and 4d).
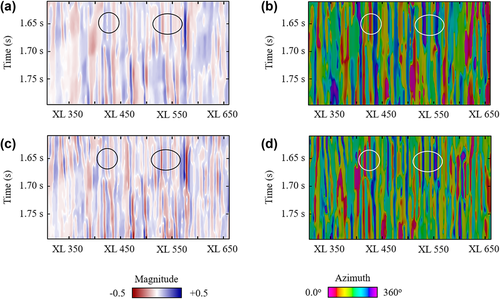
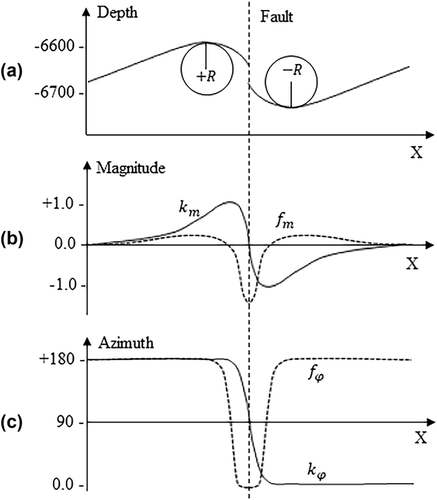
Prior to conducting fault/fracture interpretation from the curvature and flexure maps, it is necessary to understand how a fault is represented in both attributes. By examining the magnitude/azimuth maps (Fig. 4), we notice distinct expressions from curvature to flexure. Figure 5 builds a simple model for illustrating the differences, in which a simplified 2D horizon is cut by a normal fault. Specifically, using the curvature magnitude (Fig. 5b), the fault is highlighted as a juxtaposition of positive curvature and negative curvature (denoted as solid curve), and their absolute values are similar. Instead, a negative peak with two positive sidelobes is observed for the fault by the flexure magnitude (denoted as dotted curve), and the ratio between the peak and the sidelobes is expected to vary from fault to fault, depending on the fault properties, such as dipping angle. Then, we turn to the azimuth of both attributes (Fig. 5c). Let the strike direction of the fault be 0o, the curvature azimuth is estimated as 0o at the synclinal block and jumps to the opposite direction (180o) at the anticlinal block (denoted as solid curve), whereas the flexure azimuth is estimated as 0° close to over the faulting zone but reverses (180o) at both blocks (denoted as dotted curve). In this study, the curvature azimuth is deliberately extended to the range of [0o, 360o) by rotating the azimuth to its opposite direction when positive magnitude is estimated, so that the anticlinal and synclinal blocks could be easily differentiated in curvature azimuth map (Fig. 4b).
Fault probability estimation
As shown in Fig. 5, the faulting distorts the reflector not only across the fault plane but also on its anticlinal and synclinal blocks, and correspondingly, both the fault and its blocks are mapped together in the generated curvature/flexure images (Di and AlRegib 2017). On the one hand, such mixture reveals more information for an experienced interpreter to better understand the subsurface deformation. However, on the other hand, it adds the difficulties for computers/workstations to correctly differentiate the faults from their nearby blocks and extract the corresponding patches at their actual locations.
 and
and  to represent the curvature magnitude and azimuth, and
  and
and  for the flexure magnitude and azimuth.
-
Unweighted fault probability
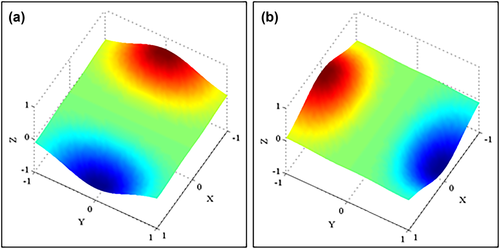
 between the anticlinal block and the synclinal block, and thereby the fault locates at the point where the curvature azimuth abruptly reverses. Given the popular Gaussian filter, this study first develops the operator for quantifying the variation of the curvature azimuth. As shown in Fig. 6, the operators along the inline (x-) and crossline (y-) directions are evaluated as
 (1a)
(1a) (1b)
(1b) is used for the examples shown below. Finally, the unweighted fault probability (
 ) is estimated by convoluting equation (1) with the curvature azimuth
  ,
,
 (2)
(2)
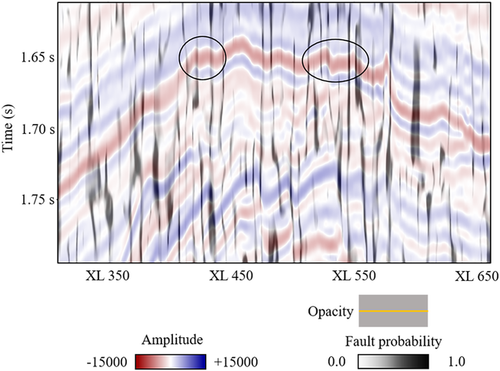
 ) overlaying the seismic amplitude of inline #504. Note the enhanced imaging of both the major faults and the subtle fractures over the anticlinal crest (denoted by circles), compared with the conventional seismic discontinuity analysis (Fig. 3).
 between the fault and both of its blocks, and thereby the fault now locates at the point where the flexure azimuth abruptly reverses simultaneously towards its two sides. Figure 8 displays the set of operators along the inline (x-) and crossline (y-) directions used for quantifying the variation of the flexure azimuth, and in math, they are represented as
 (3a)
(3a) (3b)
(3b)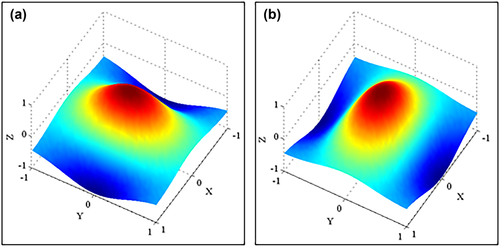
 ) is estimated by convoluting equation (3) with the flexure azimuth
  ,
,
 (4)
(4)- b. Weighted fault probability
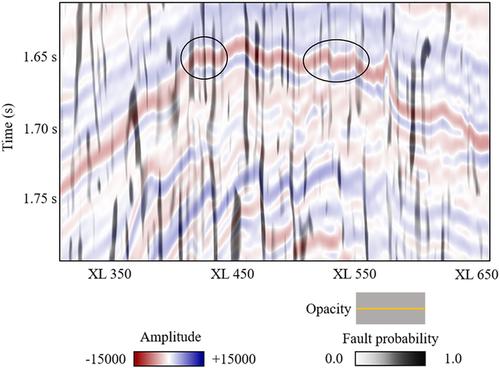
 ) overlaying the seismic amplitude of inline 504. Note the enhanced imaging of both the major faults and the subtle fractures over the anticlinal crest (denoted by circles), compared with the conventional seismic discontinuity analysis (Fig. 3).
 and
and  results, which evaluates the weighted fault probability from the curvature attribute (
 ) as
) as
 (5)
(5) ) as
) as
 (6)
(6)Figures 10 and 11 display the weighted fault probability from the curvature and flexure attributes, respectively, overlaying the seismic amplitude for quality control. Compared with the unweighted fault probability (Figs 7 and 9), the weighted one preserves only the major faults with apparent vertical displacements, whereas the rest associated with subtle geometry variations are successfully suppressed to avoid confusion during fault interpretation.
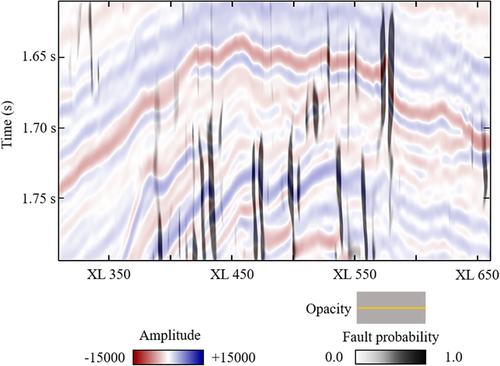
 ) overlaying the seismic amplitude of inline #504. Note the suppression of the subtle fractures without apparent displacement compared with the unweighted fault probability (Fig. 7). Considering the capability of the curvature attribute in detecting the tensile deformation (Gao 2013), the isolated lineaments represent the tensile components of the faults and fractures.
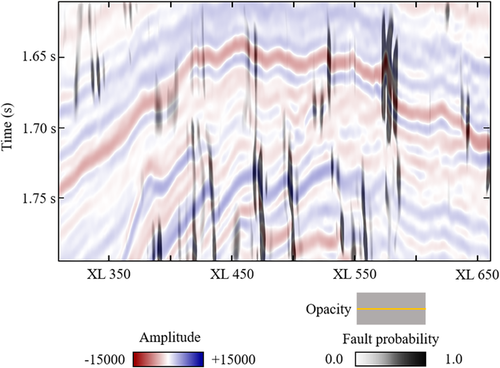
 ) overlaying the seismic amplitude of inline #504. Note the suppression of the subtle fractures without apparent displacement compared with the unweighted fault probability (Fig. 8). Considering the capability of the flexure attribute in detecting the shear deformation (Gao 2013), the isolated lineaments represent the shear components of the faults and fractures.
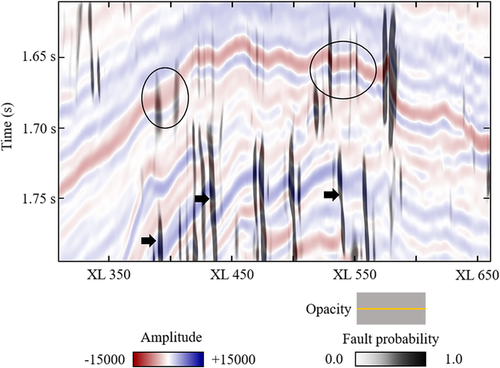
By comparing Figs 10 and 11, we notice that both curvature and flexure lead to good match between the fault probability and the seismic images. Meanwhile, it is obvious that certain faults and fractures are imaged in different ways between the results from the curvature attribute (Fig. 10) and the flexure attribute (Fig. 11). Such difference may imply the complexities of faulting and fracturing in this area, particularly when considering the finding by Gao (2013) about the capabilities of curvature and flexure in differentiating tensile and shear deformation, respectively. A tentative explanation is that the curvature (Fig. 10) and flexure (Fig. 11) maps represent the tensile and shear components of the faults and fractures, respectively, and further research collaborated with structural geologists is in need for validating such assumption. In this work, we integrate both curvature and flexure results as suggested by Gao (2013), and Fig. 12 displays the integrated fault probability. Compared with the conventional discontinuity analysis (Fig. 3), the proposed method helps depict the subtle fractures over the anticline crest (denoted by circles), which provides clues for understanding the process of faulting and fracturing from the bottom zone towards the top during the rising of salt evaporates. For example, these lineaments may be connected to the major faults clearly depicted at the depth of 1750 ms (denoted by arrows), but are visually segmented due to the poor data quality.
Seeded picking
-
Single seed
| Pseudo-algorithm for seeded fault picking | |
|---|---|
Input: Seeds  ; fault probability f ; fault probability f |
|
| Output: Fault points p | |
| 1. | for  to n do to n do |
| 2. | p.append(si) |
| 3. | while forward_propagation do |
| 4. | si → si + |
| 5. | p.append(si + ) |
| 6. | end while |
| 7. | while backward_propagation do |
| 8. | si → si − |
| 9. | p.append(si − ) |
| 10. | end while |
| 11. | end for |
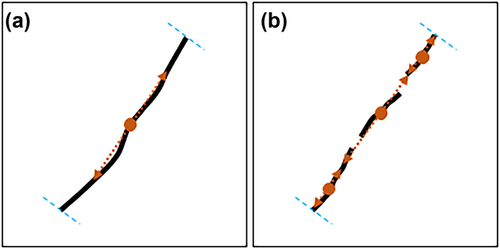
- b. Multiple seeds
For large faults that are detected as several pieces (Fig. 12), the single-seeded picking may fail to interpret them fully as expected by interpreters, since unexpected termination would occur in the local gaps of poor fault imaging. In such cases, multiple seeds are suggested for ensuring continuous picking across such gaps (Fig. 13b). For example, by defining the starting seed and the end seed of a fault, the picking within two seeds is deliberately enforced to continue even in the zones where the estimated fault probability is beyond the threshold. Correspondingly, the generated fault surface is continuous between the seeds without non-geologic holes in it.
When designing the algorithm for seeded fault/fracture picking, there exist three key factors that control the picking accuracy, including (a) searching orientation, (b) size of the searching window and (c) weight distribution within the window for finding the most-likely fault locations. All of them arise from the assumption of planar faults used in this study and take into account the fault complexities that several faults in different orientations may intersect with each other. In such case, the searching orientation is expected perpendicular to the faulting plane to reduce the searching window size and the corresponding computational costs. Moreover, when comparing the fault probability within the searching window, the centre one should be given with more weight than the marginal ones. Otherwise, two intersected faults in different orientations may be mistakenly merged into one fault patch with abrupt change in its geometry.
RESULTS
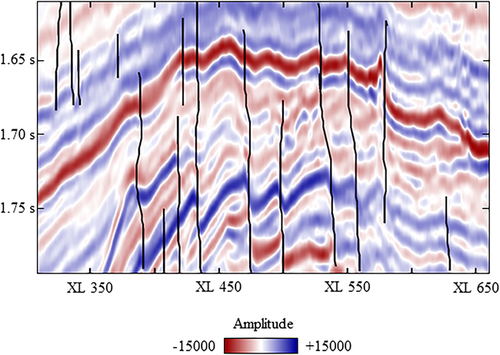
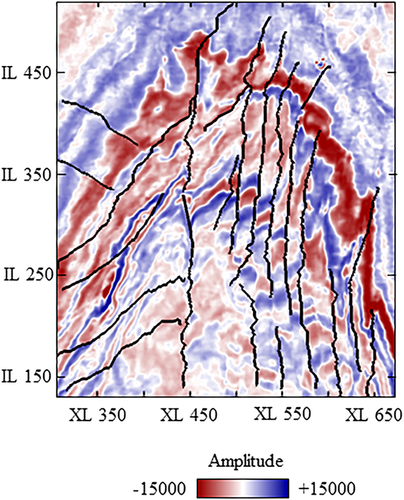
After the description of the proposed method, we investigate its applications for fault/fracture imaging and interpretation from two 3D seismic volumes. First, the proposed semi-automatic picking is applied to the F3 seismic dataset from the Netherlands North Sea. Figure 14 displays the extracted fault patches in 3D view. In general, the fault planes are north-south oriented with large dipping angles. Then, for quality control, the extracted patches are clipped to the vertical section of inline #504 (Fig. 15) and the time section at 1624 ms (Fig. 16), with the black lines representing the picked faults and fractures. Both maps demonstrate good matches between the pickings and the seismic images, indicating the accuracy of the proposed method in fault and fracture picking. In this work, the fault interpretation is based on our assumption that the faults penetrate from the anticline crest (∼1650 ms) to the deep zone (∼1750 ms), even though they are not clearly imaged in the middle zone (∼1700 ms); correspondingly, the multi-seeded picking scheme is used for interpreting them. Such assumption allows us to well verify the capability of the proposed workflow. From the perspective of experienced geologists, however, such interpretation may not be valid in geology, and therefore further work is recommended for re-interpreting them based on an in-depth understanding of the subsurface structures in this area.
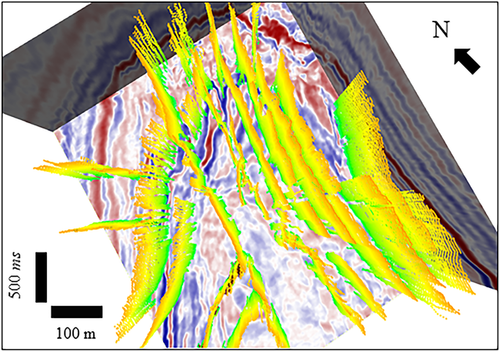
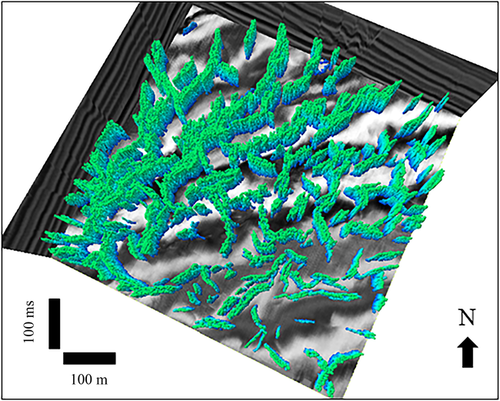
Besides the semi-automatic fault/fracture picking, the proposed method also has the potential for volumetric fault/fracture imaging extraction, which not only is computationally efficient but also helps avoid the bias from interpreters. In some areas, the subsurface deformation creates a number of faults and fractures with varying sizes and orientations, and a general view of them is often necessary for interpreters before spending much time and efforts on interpreting any of them. Applying the proposed seismic geometry analysis and lineament isolation makes it possible for fast depicting an outline of all the major faults and fractures and understanding the faulting complexities in a study area, with an enhanced resolution compared with the conventional discontinuity analysis. Figure 17 displays the volumetric fault/fracture imaging from the 3D seismic dataset over the Great South Basin in New Zealand, which was formed during the mid-Cretaceous and is rich in faults that cut the basin into several sub-basins. Such volumetric imaging not only clearly maps the spatial distribution of the polygonal faulting, but also offers new insights for analysing every fault in the entire system and investigating its role in basin evolution over this area.
CONCLUSIONS
We have presented a new method for semi-automatic interpretation of faults and fractures from 3D seismic data that consist of three components. First, the seismic geometry analysis is performed to highlight both the faults and the subtle fractures, especially those are often overlooked in the conventional discontinuity analysis. Then, the fault probability is estimated from these attributes for differentiating the potential faults and fractures from the non-faulting features. Finally, the seeded picking is used to interpret the target faults and fractures with the knowledge of interpreters to ensure reliable interpretation in geology. With the assistance of the proposed method, a fault system could be better investigated in two ways: first, to perform volumetric fault imaging for fast depicting the spatial distribution of all faults and fractures in a study area and, second, to pick the target faults as patches for quantitative structure interpretation and framework modelling.
The proposed workflow is most computationally expensive in the first component of seismic geometry analysis, which is dependent on the selection of computation algorithms as well as the size of seismic volumes. On the contrary, the step of fault probability estimation and seeded picking has relatively low requirement on computational resources and can be completed in a few seconds as tested on a laptop of Intel Core i7 processor and 16 GB memory.
ACKNOWLEDGEMENTS
This work is supported by the Center for Energy and Geo Processing at Georgia Tech and King Fahd University of Petroleum and Minerals. Thanks go to the Editor Tijmen Jan Moser, the Associate Editor, and the reviewers Behzad Alaei and two anonymous ones for their helpful comments that have certainly helped improve the quality of this work. We thank the OpendTect Open Seismic Repository (opendtect.org/osr) for providing the F3 dataset over the Netherlands North Sea, and the New Zealand Petroleum and Minerals (NZP&M) for the GSB dataset. The code is available at https://haibindi.wixsite.com/haibin-di/software-tools


